Bugs Matter citizen science survey of insect abundance in Kent
←
→
Page content transcription
If your browser does not render page correctly, please read the page content below
Bugs Matter citizen science survey of insect abundance in
Kent
Lawrence Ball1, Robbie Still1, Alison Riggs2, Alana Skilbeck1 & Paul Tinsley-Marshall1
1KentWildlife Trust, Tyland Barn, Sandling Lane, Maidstone, Kent, ME14 3BD 2Diocese of Oxford, Church
House Oxford, Langford Locks, Kidlington, Oxford, OX5 1GF

Author for correspondence: paul.tinsley-marshall@kentwildlife.org.uk

Abstract
In recent years, scientists and the media have drawn attention to global declines in insect abundance or
the so-called ‘insect apocalypse’, the consequences of which are potentially catastrophic. Invertebrates
are critical to ecosystem functions and services, and without them life on earth would collapse. However,
there is currently insufficient data to make robust conclusions about trends in insect abundance in the
UK, because standardized insect sampling approaches are not widely applied to all insect groups or at a
national scale. Here, we demonstrate the use of an innovative and scalable invertebrate sampling
technique conducted by citizen scientists, to examine the difference in invertebrate abundance in Kent
over a 17 year timeframe. The ‘windscreen phenomenon’ is a term given to the anecdotal observation
that people tend to find fewer insects squashed on the windscreens of their cars now, compared to in the
past. This observation has been ascribed to major declines in insect abundance. In this study, citizen
scientists were asked to record the numbers of squashed insects and other invertebrates on their vehicle
number plates following a journey, having first removed any residual insects sampled on previous
journeys. We compared the number of insects sampled by vehicles in Kent in 2021 (n = 389 journeys)
with the Kent results of a national survey using this methodology led by the RSPB in 2004 (n = 638
journeys). The results show that the number of insects sampled on vehicle number plates in Kent
decreased by 71.5% between 2004 and 2021, and this difference was statistically significant. This is
consistent with the declining trends in insect abundance widely reported by others, and informs a
growing requirement for conservation research, policy and practice targeted at invertebrates in the UK.
However, our results are based on data with low temporal resolution and consequently we interpret this
short-term pattern with caution. Furthermore, inter-annual variation in a range of unmeasured factors,
such as wind speed, predation or land-use change, could significantly influence the observed pattern. To
draw robust conclusions about long-term trends in insect abundance in Kent, scientists require data from
multiple years, over long time periods, and over large spatial scales – the Bugs Matter citizen science
survey has the potential to generate such data.

1 Introduction
A growing body of evidence (Fox et al., 2013; Hallmann et al., 2017; Goulson, D. 2019, Sánchez-Bayo et
al., 2019, Thomas et al., 2019, van der Sluijs, 2020) highlights population declines in insects and other
invertebrates at global scales (herein referred to collectively as ‘insects’). These declines, which are
evident across all functional groups of insects (herbivores, detritivores, parasitoids, predators and

15/12/2021

pollinators) could have catastrophic impacts on the earth’s natural systems and human survivability on
our planet. Invertebrates are functionally of greater importance than large-bodied fauna, and in terms of
biomass, bioabundance and species diversity, they make up the greatest proportion of life on earth.

Invertebrates are critical to ecosystem functions and services. They pollinate most of the world’s crops,
provide natural pest control services, and decompose organic matter and recycle nutrients into the soil.
Without them we could not grow onions, cabbages, broccoli, chillies, most tomatoes, coffee, cocoa, most
fruits, sunflowers, and rapeseed, and demand for synthetic fibres would surge because bees pollinate
cotton and flax. Invertebrates underpin food chains, providing food for larger animals including birds,
bats, reptiles, amphibians, fish and terrestrial mammals. Almost all birds eat insects, and many of those
that eat seeds and other food as adults must feed insects to their young – it is thought to take 200,000
insects to raise a single swallow chick (Chapman et al., 2013) . Without insects, life on earth would
collapse, millions of species would go extinct, and we would be surrounded by the carcases of dead
animals. Consequently, considerable conservation effort is targeted at invertebrates.

Evidence of insect declines comes from targeted surveys using specific sampling techniques aimed at
specific target groups. Many of these have generated long-term data sets, such as the Rothampstead
Insect Survey of aphids and larger moths, since 1964 (Taylor, 1986), the UK Butterfly Monitoring Scheme,
since 1976, (Brereton et al., 2020), and the National Moth Recording Scheme, since 2007 (Fox et al.,
2021), and they provide a good indication of trends for those target taxa. However, generalizing regional,
national and global trends from surveys of a limited number of insect groups could be inaccurate.
Patterns and trends for specific species or species groups are nuanced, and while trends in some insect
groups are well understood, there is a paucity of data for many others. Whilst some survey techniques
such as moth trapping and butterfly transects are discriminate in terms of what species they record, there
are very few established methods for large-scale monitoring of insect abundance across a broad range of
insect groups. Both discriminate and indiscriminate approaches have advantages and disadvantages. Here
we present the results from a survey that used an innovative method for large-scale indiscriminate
monitoring of flying insect abundance , which has potential to provide an efficient, standardised and
scalable approach to monitor insect population trends across local, regional and global scales.

The ‘windscreen phenomenon’ (Wikipedia, 2021) is a term given to the anecdotal observation that fewer
insects tend to get squashed on the windscreens of cars now compared to a decade or several decades
ago. This effect has been ascribed to major global declines in insect abundance. Flying insects are
inadvertently sampled when they become squashed on vehicle windscreens and number plates when
they are impacted. We implemented an invertebrate sampling technique based on the ‘windscreen
phenomenon’. The data was collected by citizen scientists to assess invertebrate abundance over a 17
year timeframe (Tinsley-Marshall et al., 2021a, 2021b). The aim was to quantify insect populations in Kent
using a standardised approach and to make comparisons with pre-existing baseline data from 2004,
which was collected as part of a national survey using the same methodology led by the RSPB. By
repeating the survey in Kent in 2021 it was possible to compare the numbers of insects sampled between
these points in time.

We aimed to test the null hypothesis H0: there is no evidence of variation in the numbers of insects
sampled on vehicle numberplates in Kent between 2004 and 2021 and to determine whether an
alternative hypothesis H1: there is evidence of variation in the numbers of insects sampled on vehicle
numberplates in Kent between 2004 and 2021 could be accepted. This report summarises the results of
an analysis of the insect abundance and participation data from the Bugs Matter survey in and around
Kent, and adds to the evidence base for patterns in invertebrate abundance locally.

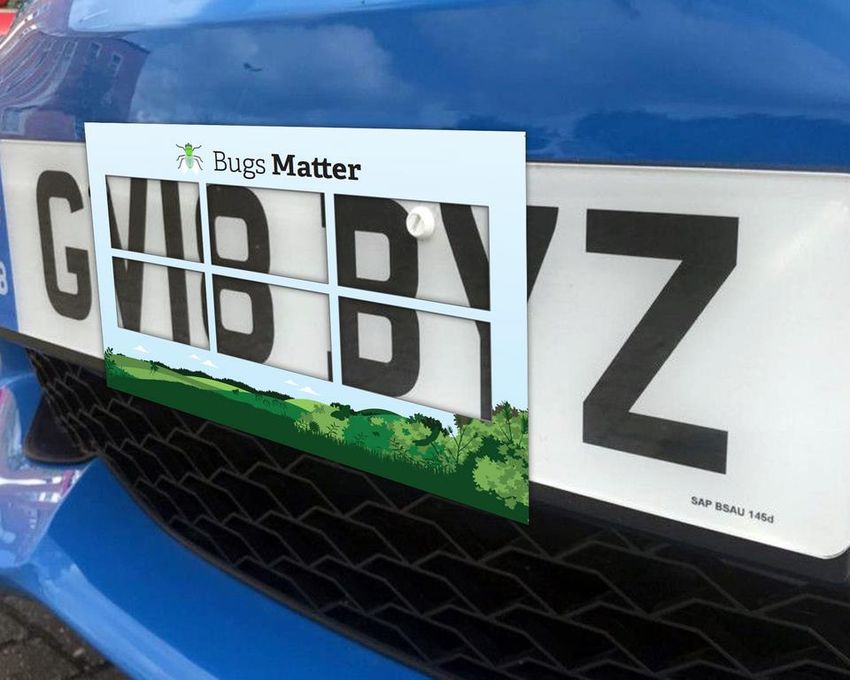
15/12/2021

2 Materials and Methods
Study area and survey design
The parameters of the study landscape were defined as the entire administrative extent of Kent,
accepting that some data would be collected from journeys that spanned the county boundary (Figure 1).
It was not possible to isolate at which point in each journey insects were sampled, therefore each
complete journey was included, where journeys crossed borders.

Figure 1. A map showing the distribution and extent of journeys included in this analysis of Bugs Matter
survey data on insect numbers sampled by vehicle number plates for the county of Kent

The focus of this research was defined as invertebrate abundance, acting as a proxy for the ecosystem
services provided by insect populations, and as a metric for insect population change. Survey design was
informed by a list of desirable attributes of monitoring programmes, ordered from most elemental to
most aspirational (Pocock et al., 2015) and aimed to ensure that all relevant attributes were adopted.

Insect sampling method
Prior to commencing a journey, citizen scientists cleaned the front number plate of their vehicle to
remove any residual insects. Insects were then sampled when they collided with the number plate
throughout the duration of a journey. Citizen scientists were asked to participate only on essential
journeys and not to make journeys specifically to take part in the survey. Using a standardised sampling
grid, termed a ‘splatometer’, citizen scientists recorded the number of insects and other invertebrates
squashed on the number plate of their car (Figure 2). Only insects within the cut-out portions of the
splatometer were counted to ensure all counts were made from within a standardized area on each
number plate. In 2021, data was collected on journeys undertaken between 1st June and 31st August,
15/12/2021

and in 2004 data was collected in June. In 2004, the start and end times and locations of the journeys
were recorded, along with the journey distance using vehicle odometer readings. In 2021 the precise
route of the journey was recorded in real-time using the Bugs Matter mobile app.

Figure 2. Photograph showing the splatometer positioned over a number plate.

Bugs Matter mobile app
Data were submitted by citizen scientists via the Bugs Matter mobile app (Figure 3). The app provided a
platform to record counts of insects on number plates, track the journey route using GPS, and collect
information on the length, duration, and average speed of each journey undertaken as part of the survey.
It also used an Application Programming Interface (API) number plate look-up service to collect
information about vehicles involved in the survey. This data was used in the analysis to determine
whether and how vehicle specifications influence insect sampling.
15/12/2021

Figure 3. Screenshots of the Bugs Matter mobile app.

Collating explanatory variables
Time of day was calculated for each journey as the intermediate time between the start and end times.
As 98.3% of journeys occurred during daytime hours (05:00-21:00), we treated time as a continuous
variable in the statistical modelling, rather than converting to a factor variable or sin/cos time. The ‘sf’
package (Pebesma, 2018) in R was used to calculate journey length. The average speed of the journey
was calculated by dividing the journey distance by the journey duration. The vehicle type, acquired via the
API, was classified to align with the analysis conducted by the RSPB in 2004. These categories were car,
heavy goods vehicle (HGV), multi-purpose vehicle (MPV), sports car, sports utility vehicle (SUV) and van.
Data collected prior to 2021 contained only start and end postcodes, and so journey routes were
obtained from the Google Directions API, through the R ‘mapsapi’ package (Dorman, 2022). Mean
temperature was calculated for each journey by averaging the intersecting raster cell values from 0.1
degree E-OBS gridded daily mean temperature (Cornes et al., 2018). A maximum greenest pixel
composite of normalized difference vegetation index (NDVI) values was generated in Google Earth Engine
(Gorelick et al., 2017) from MODIS Terra Vegetation Indices 16-Day Global 250 m data (Didan, 2015)
acquired between 1st January 2017 and 30th December 2021. We assumed the spatial variation in NDVI
values in this composite to be representative of broad vegetation patterns across all years. NDVI
describes the difference between visible and near-infrared reflectance of vegetation cover based on
chlorophyll content, and can be used to estimate vegetation productivity. Artificially-surfaced areas such
as roads and buildings show as low values, whilst vegetated areas show as high values. The NDVI values
were averaged within a 500 m buffer of each journey route to approximate the suitability of the habitat
for insects surrounding each journey route. The NDVI values were rescaled to a -10-10 range to aid
interpretation of the model coefficients.
15/12/2021

Statistical analysis

Data cleaning and preparation
To make the data comparable between journeys, insect counts were converted to a splat rate, using the
ratio count/distance, expressed in a unit of splats per mile. Differences in insect splat rates (splats per
mile) between years were visualized in a boxplot. In addition, relationships between other variables, such
as how journey distance or the types of vehicles used in the surveys varied between years, were
examined visually in boxplots and correlation plots, and tested using Kruskal-Wallis tests or Spearman
correlation tests.

Prior to the analysis, some steps were taken to clean the data and remove outliers. Journeys with GPS
errors were removed from the 2021 data. These errors were caused by a drop-out of background tracking
due to GPS signal being lost by the device, and they appeared as long straight lines between distant
locations. All journeys with a 1 km or greater gap between route vertices were omitted. Some journeys
were very short with extremely high splat rates. Therefore, very short journeys of less than 0.3 miles were
removed, as they are highly likely to be the result of GPS errors or incorrect use of the app, for example
by the user forgetting to press the start journey button at the appropriate time. Similarly, all journeys that
lasted less than one minute and journeys with an average speed of less than 1 mph or over 80 mph were
omitted. In addition, all journeys during which rainfall occurred were omitted from the dataset due to the
risk that rainfall could dislodge insects from numberplates, leading to bias in the data.

Modelling
A negative binomial generalised linear model (NBGLM) was used to examine the relative effects of survey
year, time of day of each journey, average journey temperature, average journey speed, journey distance,
vehicle type, local NDVI, and road type, on the number of insects sampled by vehicles. The response
variable in our analysis was the insect count which showed a right-skewed distribution due to the high
number of zero and low values, as is typical for count-derived data (Appendix 1). A NBGLM was chosen
because it is appropriate for over-dispersed count data. Overdispersion was confirmed using a test for
overdispersion on a Poisson model (Cameron and Trivedi, 1990), which resulted in a test statistic of c =
3.778, indicating overdispersion (c = 0 for equidispersion). The analysis was performed using the MASS
package (Venables and Ripley, 2002) in RStudio (R Core Team, 2021) following established techniques
(Sokal & Rolf, 1995; Crawley, 2007).

Journey distance was included in the models as an offset term. Offset terms are included in models of
count-derived data to deal with counts made over different observation periods. This is preferable to
using the splat rate (distance-normalizing the count using the ratio count/distance) because by adding the
denominator of the ratio (distance) as an offset term, it makes use of the correct probability distributions.
It can be thought of as explicitly modelling the expected rate of sampling an insect as distance driven
increases. The model with offset does model the ratio (splats per mile), but in a way that is likely to be
much more compatible with the data (Coelho et al., 2020).

After running the model, variance inflation factor (VIF) scores were calculated to check for
multicollinearity between independent variables. A VIF score greater than 10 indicates high collinearity,
which means two or more independent variables are correlated with one another. This can cause
unreliable predictions and weaken the statistical power of the model. The goodness of fit of the model
was assessed using McFadden’s pseudo-R2 value, 1- (residual deviance)/(null deviance), which indexes
the improvement of the fitted model over a model with no explanatory variables (the null model)
(Hensher and Stopher, 2021). McFadden’s pseudo-R2 values were compared between a model with only
15/12/2021

survey year included as an independent variable, and the full model, to evaluate the contribution of the
other independent variables to the model fit. The results of the NBGLM show the quantity of change (a
multiplier) in the response variable given a one-unit change in the independent variable, while holding
other variables in the model constant. These values are called incidence rate ratios and they are
presented in a forest plot.

3 Results
Insect abundance
In Kent in 2004, 7802 insects were sampled over 638 journeys comprising 34555 miles. In Kent in 2021,
579 insects were sampled over 389 journeys comprising 9130 miles. The average splat rate in 2004 was
0.228 splats per mile and in 2021 it was 0.113 splats per mile. The spread of the insect splat rate data is
shown in Figure 4. The proportion of journeys in which zero insects were sampled was 10.5% in 2004 and
50.6% in 2021. The majority of journeys (75%) were undertaken in a conventional car with the remainder
being undertaken in HGV, MPV, Sports car, SUV, Van (Appendix 2). The average time of day of journeys in
2004 was 12:84 whilst in 2021 it was 13:2 (Appendix 3). The mean average journey speed in 2004 was
37.4 mph, whilst in 2021 it was 27.9 mph (Appendix 4). The average journey temperature in 2004 was
16°C, whilst in 2021 it was 17.4°C (Appendix 5). The average journey distance in 2004 was 54.2 miles and
in 2021 the average journey distance was 23.5 miles (Appendix 6). The average NDVI surrounding
journeys in 2004 was 6.645 and in 2021 it was 6.537 (Appendix 7). A positive correlation was observed
between journey distance and count of splats (Appendix 8). A positive correlation was also observed
between journey distance and splat rate (splats per mile) (Appendix 9). The VIF scores showed very low
collinearity between independent variables.

The results of the NBGLM show that in and around Kent there were 71.5% (95% CI [65.4%, 76.5%]) fewer
insects sampled on vehicle number plates in 2021 than in 2004, and this difference was statistically
significant (p = < 0.001) (Figure 5). McFadden’s pseudo-R2 value was 0.16, and in a model with only year
as a predictor it was 0.098. This shows that the amount of deviance accounted for increased from 9.8% to
16% by including the other variables.

Regarding the other explanatory variables, the results showed that in comparison to conventional cars,
HGVs splatted 333% more, vans splatted 259% more, and SUVs splatted 50% more insects. Splat rate
increased by 8% with each 1 °C increase in temperature and by 5% with each hour in the day. There was
no significant relationship between splat rate and the journey distance, local NDVI or average speed of
the journey.
15/12/2021

Figure 4. Box and whisker plot with jittered data points showing the spread of insect splat rate data
(splats per mile) from the Bugs Matter survey of insects on car number plates in Kent in each of the
survey years. Red points are high-leverage observations that were omitted from the NBGLM. The boxes
indicate the interquartile range (central 50% of the data), either side of the median splat rate which is
shown by the horizontal line inside the box. The vertical lines extend out by 1.5 times the interquartile
range, and the data points themselves are added with a ‘horizontal jitter’ so they do not overlap to
improve visualization of the data distribution. If splat rate on every journey was identical, we would only
see the line across the middle of the box, with the data points on top of it.
15/12/2021

Figure 5. Forest plot of incidence rate ratios from the NBGLM of Bugs Matter survey data of insects on car
number plates in Kent, showing the quantity of change (a multiplier) in splat rate (splats per mile) given a
one-unit change in the independent variable, while holding other variables in the model constant.
Significant relationships between splat rate and independent variables are shown by asterisks (* p < 0.05,
** p < 0.01, *** p < 0.001). Vehicle types are compared to the reference category of ‘conventional cars’.
The reference year is 2004.

Figure 6. Heat map of splat rate from the Bugs Matter survey of insects on car number plates in Kent in
each of the survey years, 2004 - 2021.

Participation
A total of 337 citizen scientists signed-up to the Bugs Matter survey in Kent in 2021, which was
substantially fewer than the other three participating counties. The majority signed-up in the initial
launch period between mid-May and mid-June, although there were considerable spikes in signups
15/12/2021

around key dates. For example, the slight increase in early June coincides with Bugs Matter featuring on
BBC Springwatch (Figure 7).

Of the 337 individuals who signed up to the Bugs Matter app, 66 participated in the survey, the criteria
for which was submitting data for at least one journey. We can calculate a conversion rate, as the number
of participants that submitted one or more journeys (66) divided by the number of sign-ups (337). This
gives a conversion rate of 19.6%. In comparison to the other participating Trusts, Kent had the second-
highest number of signups (337) but the most journeys (389) submitted via the app. The average number
of journeys recorded by each surveyor was 5.9. The number of journeys submitted via the app increased
consistently throughout the survey season and did not drop-off into August (Figure 8).

Figure 7. Number of signups to the Bugs Matter app in Kent compared to other participating counties
during the 2021 survey season.
15/12/2021

Figure 8. Number of journeys submitted via the Bugs Matter app in Kent compared to other participating
counties during the 2021 survey season.

4 Discussion
Insect abundance
The results of this study suggest a pattern of reduction in numbers of insects sampled on vehicle
numberplates in Kent, consistent with those reported elsewhere by others (Fox et al., 2013; Goulson, D.,
2019; Hallmann et al., 2017). The estimate of change in splat rate between 2004 and 2021 (a decrease of
71.5%) has a lower confidence interval of 65.4% and an upper confidence interval of 76.5%, at a 95%
confidence level. This means that if we repeated the study, 95% of the time we would expect the
estimate of change in splat rate to fall between these values. However, it should be noted that the
observations reported here are based on data from only three points in time and with a skewed temporal
distribution, and consequently do not constitute a trend and we do not interpret this as a decline. With
such a low temporal resolution, there is a risk of uncharacteristically high or low insect abundances during
these sampling years showing a trend that is unrepresentative of actual insect abundance patterns. To
accurately estimate change in insect abundance over time, the population needs to be monitored
comprehensively at regular intervals over an extended timeframe to reveal the direction and scale of
genuine trends. However, the pattern observed in this study is consistent with examples of insect decline
reported elsewhere and and informs a growing requirement for conservation research, policy and
practice targeted at invertebrates in the UK. Similar declines were noted in a study that sampled insects
splatted on vehicle windscreens between 1997 and 2017 in the Netherlands (Møller, 2019).

Insect population dynamics are influenced by a range of natural factors that vary inter-annually and
across various spatial and temporal scales (Figure 9). These factors add noise to longer-term trends in
15/12/2021

insect abundance but can be partly controlled for in our modelling. For instance, the inclusion of mean
temperature and NDVI in our models controls for inter-annual differences in temperature and spatial
variation in vegetation cover, both of which may naturally influence insect abundance. Whilst insect
populations vary spatially and temporally, so did our insect sampling approach. The time of day and date
of the journey, the vehicle type, the vehicle speed and the journey distance all create sampling bias,
which we have attempted to control for in our methods, by measuring these variables and including them
in our models (Figure 9). By controlling for these effects we obtain more accurate estimates of change in
insect splat rate between survey years. However, there are other important variables that are not yet
included in the models. For example, environmental variables with demonstrated lethal and sub-lethal
influence on insect population ecology such as pesticide use, pollution, land-use change and climate
change could explain a further proportion of the unexplained variation in the data. Our model also lacks
data on a number of other influential factors such as variation in habitat type and management, disease
and predation of insects, other weather conditions including humidity or wind, and natural variation in
insect lifecycles or flight periods. Finally, there may be subtle differences in survey methods and/or
approaches between journeys and/or years which were not recorded or communicated to subsequent
survey managers.

By including a range of variables in the statistical model, it was possible to examine how specific variables
affected insect splat rate while controlling for the effects of the other variables in the model. This was
important for a more robust estimation of change in splat rate between years, but also allowed us to
examine the effects of other factors on insect splat rate. Whilst the amount of deviance explained by the
model increased with the addition of other variables (9.8% to 16%), no significant relationship was found
between splat rate and the type of vehicle, the time of day, mean temperature, journey distance, local
NDVI, or average speed of the journey.

Splat rate showed no correlation with journey distance, as shown by a significant but non-directional
result. This is somewhat expected as the splat rate is normalized over journey distance, however we
might have expected to see more insects sampled over longer journeys due to the increased chances of
encountering areas with higher densities of flying insects. Conversely, longer journeys tend to follow
motorways where insect abundance may be lower and it is possible that sampled insects could be blown
off the number plate on long journeys, especially if the average journey speed is high. The correlation
plots showing the relationship between journey distance and splat count and rate (Appendix 8) show
some long journeys with very few insect splats or low overall splat rates, which could be partially
explained by this phenomenon.

Insect sampling was restricted to transects along the road network, and therefore the spatial coverage of
the surveys is inherently limited. Whilst this design serves to provide a robust measure of change in insect
abundance, by comparing one year to the next, we caution against the use of this data for estimating true
insect abundance. Another limitation of the survey was that citizen scientists may have forgotten to clean
their numberplate prior to conducting a survey, although the risk of this is very low for the 2021 Bugs
Mater survey, where the app required a checkbox confirmation that the number plate had been cleaned.
We are currently investigating how we could use AI algorithms to automatically count the number of
insects on number plates. This would use a virtual template in the app, similar to those used to
automatically read credit card details, and return the count in real-time to the user. This would negate
the requirement for a splatometer making it easier for citizen scientists to count and record data.
15/12/2021

Participation
Sign-ups in Kent were lower than the other participating Wildlife Trusts, but the reasons for this are not
fully known. One possibility, is that the delay in communicating the launch of the survey in Welsh may
have meant that national and local press were out of sync. No sign-ups occurred after mid-August,
whereas for other counties this was not the case, and so it may be worthwhile reviewing the
communication strategy for August.

The number of journeys submitted via the app occurred at a fairly constant rate over the survey season,
suggesting that participants remained motivated throughout the summer. Moreover, the number of
journeys recorded by each participant was high, with an average of 9 journeys per surveyor. However, a
large number of participants in Kent signed up but did not complete a single journey (271/337), hence a
low conversion rate of 19.6%. To determine the cause of this, a post-survey questionnaire was circulated
to participants, which showed that the delay in receiving the splatometer was a key reason.
Consequently, priorities for the app going forward are to include automatic application of the
splatometer through the smartphone, as well as other improvements to the communications and
implementation strategy for the 2022 survey.

Synthesis and Application
The Bugs Matter survey successfully quantified a difference in the number of insects sampled on vehicle
numberplates over time from baseline data established in 2004. The approach has the potential to
provide an efficient, standardised and scalable approach to monitor insect population trends across local,
regional and global scales, to add to the growing body of evidence for trends in insect populations and to
provide a coarse metric of the functional provision by insects within ecosystems.

An increasing number of studies are accumulating evidence of insect declines, and associated
consequence for ecosystem functions. It is important to recognise that these patterns and trends are
often nuanced, and that local conditions and choice of analytical approach may mean that results
reported locally or regionally may not reflect patterns everywhere. The media uptake of negative trends
from short time series data such as those presented here for example, may be acting to exaggerate the
perception of an ‘insect Armageddon’, with potential consequences for public confidence in research. We
recognise and stress that the results we have reported here do not constitute a trend, and advocate
strongly for data collection over extended timeframes to enable conclusions about trends in insect
populations to be drawn. We believe that the widespread adoption of the Bugs Matter survey facilitated
by the Bugs Matter app can provide a replicable and scalable approach for the generation of an enhanced
evidence-base that can be used to assess trends and drive positive action for insects and other
invertebrates.

Increasing sample size both by increasing the number of citizen scientist participants and the number of
journeys undertaken would provide greater confidence in the reliability of our data as a robust indicator
of patterns in insect abundance. Similarly, cross-validating our results with other monitoring schemes for
insect abundance, such as the Rothamsted Insect Survey (RIS) (Fox et al., 2013) or the results of long-term
Malaise trapping studies (Hallmann et al., 2017), would provide another means to calibrate and critique
the patterns in our data. There is potential for the survey method to have global application and
relevance, and deployed at a national scale, it can provide data at resolutions appropriate to the scale at
which the ecosystem services provided by insects operate. By continuing to promote participation in the
survey in subsequent years, insect conservationists can capitalise on the opportunity to gather long-term
data and build the evidence base for insect abundance at UK county and national scale.
15/12/2021

Acknowledgements
Bugs Matter is a partnership between Kent Wildlife Trust and Buglife, with Gwent, Essex and Somerset
Wildlife Trusts, and is supported by the RSPB. PTM, LB and RS are employed by Kent Wildlife Trust. We
sincerely thank all of the citizen scientists who took part in the survey and made this analysis possible,
and the wider project team: Chloe Sadler and Ashton Dreyer of Kent Wildlife Trust, Andrew Whitehouse
and Paul Heatherington of Buglife. We also thank Richard Bradbury, Richard Bashford and Guy Anderson
of the RSPB for facilitating our use of the ‘splatometer’ method, providing the data from 2004 and for
helpful discussion. Mick Crawley and Simon Leather provided helpful feedback on an earlier iteration of
the analysis presented in this report. XXX of Buglife provide helpful comments on the manuscript . The
Bugs Matter app was developed by Natural Apptitude, and was funded by two anonymous donors.

Author contributions
This project was led and managed by PTM, who contributed much of the text for this report along with
guidance for the statistical analyses. LB led on the collation of variables, statistical analysis and report
writing, whilst RS performed initial data cleaning and formatting and the analysis of the participation data.
AR and AS were part of the project team in 2019, AR leading on GIS and data assimilation, and AR on
citizen scientist participation.

References
Brereton, T.M., Botham, M.S., Middlebrook, I., Randle, Z., Noble D., Harris, S., Dennis, E.B., Robinson A.,
Peck. K. & Roy, D.B. 2020. United Kingdom Butterfly Monitoring Scheme report for 2019. UK Centre for
Ecology & Hydrology, Butterfly Conservation, British Trust for Ornithology and Joint Nature Conservation
Committee.

Breiman, L., Friedman J.H., Olshen R.A., and Stone C.J. (1984) Classification and regression trees. Taylor &
Francis, Monterey.

Cameron S.A., Lozier J.D., Strange J.P., Koch J.B., Cordes N., Solter L.F. and Griswold, T.L. (2011) Patterns
of widespread decline in North American bumble bees. Proceedings of the National Academy of Sciences.
108, 662-667. doi: 10.1073/pnas.1014743108

Chapman, R. F., Simpson, S. J., & Douglas, A. E. (2013). The Insects: Structure and Function. Cambridge
University Press.

Coelho R., Infante P. and Santos M.N. (2020) Comparing GLM, GLMM, and GEE modeling approaches for
catch rates of bycatch species: A case study of blue shark fisheries in the South Atlantic. Fish
Oceanography. 29, 169–184. doi: 10.1111/fog.12462

Cornes R., G. van der Schrier, E.J.M. van den Besselaar, and Jones P.D. (2018) An Ensemble Version of the
E-OBS Temperature and Precipitation Datasets, Journal of Geophysical Research: Atmospheres, 123,
9391-9409. doi: 10.1029/2017JD028200

Crawley M.J. (2007) The R Book. John Wiley and Sons Ltd, Chichester.

Didan K. (2015). MOD13Q1 MODIS/Terra Vegetation Indices 16-Day L3 Global 250m SIN Grid V006. NASA
EOSDIS Land Processes DAAC. Accessed 2022-02-08 from https://doi.org/10.5067/MODIS/MOD13Q1.006
15/12/2021

Dorman M. (2022). mapsapi: ‘sf’-Compatible Interface to ‘Google Maps’ APIs. R package version 0.5.3.
https://CRAN.R-project.org/package=mapsapi

Fox R, Dennis EB, Harrower CA, Blumgart D, Bell JR, Cook P, Davis AM, Evans-Hill LJ, Haynes F, Hill D, Isaac
NJB, Parsons MS, Pocock MJO, Prescott T, Randle Z, Shortall CR, Tordoff GM, Tuson D & Bourn NAD
(2021) The State of Britain’s Larger Moths 2021. Butterfly Conservation, Rothamsted Research and UK
Centre for Ecology & Hydrology, Wareham, Dorset, UK.

Fox R., Parsons M.S., Chapman J.W., Woiwood I.P. Warren M.S. and Brooks D.R. (2013) The state of
Britain’s larger moths 2013. Butterfly Conservation & Rothamsted Research Wareham, Dorset

Gorelick N., Hancher M., Dixon M., Ilyushchenko S., Thau D., and Moore R. (2017) Google Earth Engine:
Planetary-scale geospatial analysis for everyone. Remote Sensing of Environment. doi:
10.1016/j.rse.2017.06.031

Goulson D. (2019) Insect declines and why they matter. A report commissioned by the South West
Wildlife Trusts. https://www.kentwildlifetrust.org.uk/sites/default/files/2020-
01/Actions%20for%20Insects%20-%20Insect%20declines%20and%20why%20they%20matter.pdf

Hallmann C.A., Sorg M., Jongejans E., Siepel H., Hofland N., Schwan H., Stenmans W., Müller A., Sumser
H., Hörren T., Goulson D. and de Kroon H. (2017) More than 75% decline over 27 years in total flying
insect biomass in protected areas. PLoS ONE 12(10), e0185809. doi: 10.1371/journal.pone.0185809

Lovelace R. and Ellison R. (2018) “stplanr: A Package for Transport Planning.” The R Journal, 10(2). doi:
10.32614/RJ-2018-053.

Mellanby K. (1939) Low temperature and insect activity. Proceedings of the Royal Society of London.
Series B-Biological Sciences, 127(849), 473-487.

Miska L., and H. Jan. (2004) Evaluation of current statistical approaches for predictive geomorphological
mapping. Geomorphology. 67, 299–315.

Møller A.P. (2019) Parallel declines in abundance of insects and insectivorous birds in Denmark over 22
years. Ecology and Evolution, 9(11), 6581–6587. https://doi.org/10.1002/ece3.5236

Pebesma E. (2018) “Simple Features for R: Standardized Support for Spatial Vector Data.” The R Journal,
10(1), 439–446. doi: 10.32614/RJ-2018-009,

Pocock M.J.O., Newson S.E., Henderson I.G., Peyton J., Sutherland W.J., Noble D.G., Ball S.G., Beckmann
B.C., Biggs J., Brereton T., Bullock D.J., Buckland S.T., Edwards M., Eaton M.A., Harvey M.C., Hill M.O.,
Horlock M., Hubble D.S., Julian A.M., … Roy, D. B. (2015) Developing and enhancing biodiversity
monitoring programmes: A collaborative assessment of priorities. Journal of Applied Ecology, 52(3), 686–
695. doi: 10.1111/1365-2664.12423

R Development Core Team (2021) R: A Language and Environment for Statistical Computing. Vienna,
Austria.

Sánchez-Bayo F., and Wyckhuys, K.A.G. (2019) Worldwide decline of the entomofauna: A review of its
drivers. Biological Conservation, 232(January), 8–27. doi: 10.1016/j.biocon.2019.01.020

Sokal R.R. and Rohlf F.J. (1995) Biometry: the principles and practice of statistics in Biological Research.
W. H. Freeman; 3rd Edition Taylor, L. R. (1986). Synoptic Dynamics, Migration and the Rothamsted Insect
15/12/2021

Survey: Presidential Address to the British Ecological Society, December 1984. Journal of Animal Ecology,
55(1), 1–38. https://doi.org/10.2307/4690

Thomas, C.D., Jones, T.H., and Hartley, S.E. (2019) “Insectageddon”: A call for more robust data and
rigorous analyses. Global Change Biology, 25(6), 1891–1892. doi: 10.1111/gcb.14608

Tinsley-Marshall P., Skilbeck A. and Riggs A. (2021a) Bugs Matter citizen science survey demonstrates
temporal difference in invertebrate abundance in Kent and South East England. Kent Wildlife Trust,
Maidstone doi: 10.13140/RG.2.2.15903.89768

Tinsley-Marshall P.J., Riggs A., Skilbeck A., Ball L. and Still R. (2021b) Nature’s Sure Connected: A practical
framework and guidance for evidencing landscape-scale outcomes of landscape-scale conservation. Kent
Wildlife Trust. doi: 10.13140/RG.2.2.10556.77447

van der Sluijs, J.P. (2020) Insect decline, an emerging global environmental risk. Current Opinion in
Environmental Sustainability, 46, 39–42. doi: 10.1016/j.cosust.2020.08.012

Venables W.N. and Ripley B.D. (2002) Modern Applied Statistics with S. Fourth Edition. Springer, New
York. ISBN 0-387-95457-0

Vuong Q.H. (1989) Likelihood Ratio Tests for Model Selection and non-nested Hypotheses. Econometrica.
57(2), 307–333. doi:10.2307/1912557.

Wikipedia (2021) Windshield phenomenon [Online]. [Accessed 11th November 2021]. Available from:
https://en.wikipedia.org/wiki/Windshield_phenomenon

Yau K.K., Wang K., & Lee A.H. (2003) Zero‐inflated negative binomial mixed regression modeling of over‐
dispersed count data with extra zeros. Biometrical Journal: journal of mathematical methods in
biosciences, 45(4), 437-452.

Zeileis A., Kleiber C., and Jackman S. (2008) Regression Models for Count Data in R. Journal of Statistical
Software 27(8). URL http://www.jstatsoft.org/v27/i08/.

Appendices
Appendix 1. A histogram of the splat rate (splats per mile) data.
15/12/2021

Appendix 2. The number of journeys conducted by each vehicle type in each survey year.

              2004 2019     2021
 Car          568     307    340
 HGV           12      89     13
 MPV           13      13     20
 Sports car    25      41       5
 SUV             0    148       4
 Van           20       0       1

Appendix 3. Box and whisker plot showing the spread of the time of day of journey data from the Bugs
Matter survey of insects on car number plates in Kent in each of the survey years. A Kruskal-Wallis test
showed a significant difference in the time of day at which journeys were undertaken between the survey
years (H(1) = 10.246, p = 0.0059582).
15/12/2021 Appendix 4. Box and whisker plot showing the spread of the average journey speed data from the Bugs Matter survey of insects on car number plates in Kent in each of the survey years. A Kruskal-Wallis test showed a significant difference in the average journey speed between the survey years (H(1) = 419.889, p = < 0.001).
15/12/2021

Appendix 5. Box and whisker plot showing the spread of the mean journey temperature data from the
Bugs Matter survey of insects on car number plates in Kent in each of the survey years. A Kruskal-Wallis
test showed a significant difference in the mean journey temperature between the survey years (H(1) =
98.803, p = < 0.001).
15/12/2021

Appendix 6. Box and whisker plot showing the spread of the journey distance data from the Bugs Matter
survey of insects on car number plates in Kent in each of the survey years. A Kruskal-Wallis test showed a
significant difference in the journey distances between the survey years (H(1) = 608.048, p = < 0.001).
15/12/2021

Appendix 7. Box and whisker plot showing the spread of the NDVI data from the Bugs Matter survey of
insects on car number plates in Kent in each of the survey years. A Kruskal-Wallis test showed a significant
difference in the journey NDVI between the survey years (H(1) = 144.134, p = < 0.001).

Appendix 8. Correlation plot showing the relationship between journey distance (x-axis) and count of
splats (y-axis). A Spearman correlation test showed a significant positive correlation between journey
15/12/2021

distance and count of splats (rho = 0.681, p = < 0.001).

Appendix 9. Correlation plot showing the relationship between journey distance (x-axis) and splat rate (y-
axis). A Spearman correlation test showed a weak but significant positive correlation between journey
distance and count of splats (rho = 0.423, p = < 0.001).
15/12/2021
You can also read