BUDGET GUIDELINES 2022 BUDGET COUNTY OF MONROE MICHIGAN - Monroe County, Michigan
←
→
Page content transcription
If your browser does not render page correctly, please read the page content below

BUDGET GUIDELINES

              2022 BUDGET

      COUNTY OF MONROE
          MICHIGAN

          MONROE COUNTY BOARD OF COMMISSIONERS

                                 MARK BRANT, CHAIRMAN
                           RANDY RICHARDVILLE, VICE-CHAIRMAN

                          Transmitted to Board of Commissioners July 13, 2021

DOCUMENT PREPARED BY:
MICHAEL BOSANAC, ADMINISTRATOR/CHIEF FINANCIAL OFFICER
SUE MAIER, DIRECTOR OF FISCAL SERVICES
TABLE OF CONTENTS
1.    PURPOSES OF BUDGET GUIDELINES                                          1
2.    OBJECT STATEMENT                                                       2
3.    ANNUAL BUDGET WITH 2ND YEAR PROJECTION                                 4
4.    OVERVIEW OF THE 2022 COUNTY BUDGET                                     4
      A.   Budget Outcomes                                                   7
      B.   Key Drivers of County Finances                                   11
      C.   Budget Summary                                                   15

5.    REVENUES                                                              16
      A.   Equalized Valuation & Property Taxes                             16
      B.   Sources of County Property Tax Revenue                           18
      C.   Court Case Filings/Trends & Data                                 20
      D.   Court Equity Revenue                                             21
      E.   Friend of the Court                                              22
      F.   State Revenue Sharing                                            22
      G.   Inmate Dormitory Revenue                                         23
      H.   Interest Earnings/Cash Management                                25
      I.   Delinquent Tax Revolving Fund                                    26
      J.   Other Revenues & History of General Fund Revenues/Expenditures   27
      K.   Budget Stabilization Fund & General Fund’s Fund Balance          28

6.    EXPENDITURES                                                          31
      A.   Retiree Health Care                                              31
      B.   Employee Health Care                                             35
      C.   Retirement                                                       38
      D.   Employee Total Compensation Plan                                 41
      E.   General Fund Transfers-Out                                       41
      F.   Operating Expenses                                               42
      G.   Debt Schedule                                                    42
      H.   Capital Outlay                                                   43
      I.   Capital Improvement Projects                                     43
      J.   Enterprise-Wide Computer Capital Outlay & Network Operations     44

7.    BUDGET GOALS                                                          46
8.    BUDGET POLICY GUIDELINES                                              46
9.    DEPARTMENTAL GOALS & OBJECTIVES                                       46
10.   BUDGET COMPLIANCE                                                     47
11.   BASIS OF ACCOUNTING                                                   47
12.   PRIOR YEAR BALANCES                                                   47
13.   CONTINGENCIES                                                         48
14.   PROGRAMS FUNDED BY OUTSIDE FUNDING SOURCES                            48
15.   INDIRECT COST CONCEPT                                                 48
16.   FEES                                                                  48
17.   FINANCIAL INDICATORS-PER CAPITA DATA CHARTS                           49
18.   2022 PRELIMINARY BUDGET OUTLINE                                       53
1. PURPOSES OF 2022 BUDGET GUIDELINES
These guidelines are prepared to facilitate the preparation of, and to establish the parameters for revenue
and expenditure estimates for the 2022 budget. They outline the general direction for the preliminary and
recommended budgets. This document also serves to assist the County in complying with PA 2, the
Uniform Budgeting and Accounting Act by supplying requisite information on County finances to
policymakers prior to adopting the budget. It is one of several key reports presented on County financial
management.
Budgeting guidelines are defined as the Board of Commissioner’s principle budget policies to be reflected
in the annual appropriation process. In order to present these guidelines, it is necessary to review the
financial position of the organization and projections of the finances for the next budget year and beyond.
Below is an outline of financial information on the core operations selected for analysis. In summary, in
spite of a pandemic, the organization has remained in a state of financial stability from when this document
was drafted last year preparing the 2021 budget. Small incremental positive trends can be found in selected
areas of the budget and related financial position. Conversely, we can identify areas of negative trends or
regression of revenues based on lower levels of economic activity. The use of reserves has not been
required to cover budget shortfalls over the past three (3) years, and points to a positive trend in budgeting.
The 2021 budget projected a small surplus of $139,000 when adopted November 4, 2020. Since that time,
no budget amendments have been adopted.
As this document and the information contained herein were developed, the corona virus pandemic
continued to impact our county, state, nation and globe. Unprecedented actions and measures were taken in
2020 to combat the virus and they have continued through the 1st quarter of 2021. In addition, funding from
the federal government has been appropriated to support County efforts and cover costs expended in the
local response to the virus. Any funding in 2020 was recorded as activity in that year and reported as part
of 2020 operating results. Looking forward, the American Rescue Plan Act 2021 appropriates significant
funding to the County over the next several years with all expenditures to be expensed by December 31,
2024. The funds will have to be allocated to eligible categories under guidance provided by the U.S.
Treasury with reporting on the use of funds.
While supplemental one-time appropriations from the federal government will provide the County with an
infusion of financial resources, our focus should be on expending these funds in a way to leverage the
highest and best use of opportunities for citizens and businesses with long-term benefits for sustainability.
Avoid creating new programs and services and staff positions that will not be sustainable following
the use of the ARPA funds. No legacy cost roll ups after program funds are expended.
Consider using the funds to invest in underlying support for existing programs and services to
strengthen the existing service delivery models to enhance public services.
Enhance automation, customer experience through self-serve applications, and accelerated capital
programming to build reliability of operations.
The assumptions used in this document to develop a preliminary 2022 budget outline will be subject to
modifications and updated until a budget is adopted. This will be driven by more information and clarity
are known from the effects of the pandemic and the usual timing of information required for budget
development.
Financial review includes the following core areas of fiscal management of the County:
i. Current revenues and preliminary estimates of revenues for the upcoming budget year. Economic
forecast of the taxable value of real property is of primary focus and consideration used in
conjunction with the final Boards of Review and tax settlement figures.
Page 1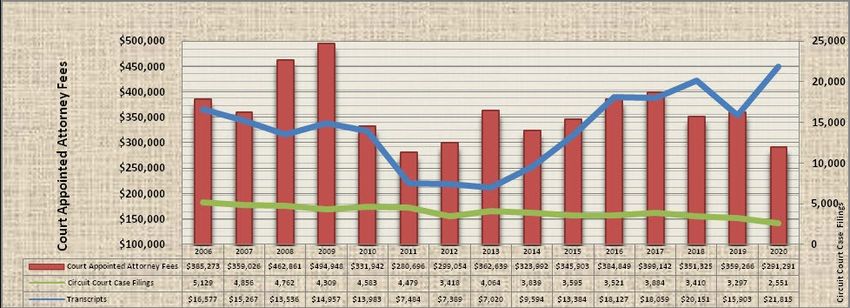
ii.   Evaluating past budget year operating surpluses or deficits and understanding the primary factors
        that led to the financial outcome are provided. This encompasses all funds, including major special
        revenue funds, the General Fund and cost centers within the General Fund.

 iii.   Inflation trends and local economic conditions that impact supplies and contracted services.

 iv.    Prospects for new taxes and fees, changes in current tax and fee rates along with collection rates
        and best estimates for MTT adjustments. This includes what we know at this time for the tax appeal
        settlement with DTE on the Fermi II nuclear power plant and our best estimate of results from the
        tax appeal.

  v.    Multiple categories of revenues and expenditures reviewed in trend analysis to demonstrate the
        financial impact, changes over time and projections going forward.

 vi.    Major non-recurring expenditures that fall due in the current budget year or the upcoming year and
        understanding the impact on overall expenditures.

vii.    Major non-recurring revenue that will be realized or end during the budget year including reserve
        funds.

viii.   Requests for public and internal support services from the organization and resources available to
        provide these services. This includes requests for new employee positions above any replacements
        or back filled positions.

 ix.    External constraints on revenue, demands on the County due to external authorities, new
        obligations, regulations and compliance. Until court funding is solved, this will remain a concern.
        Related is PA 151 of 2020 as it will sunset in October 2022 until extended or the state acts to fill the
        revenue loss from any changes in court costs and fees. Beyond PA 151, we will monitor efforts to
        begin implementing recommendations of the Trial Court Funding Commission and allocating
        funding based on case weighting driving available resources.

  x.    Continued state funding for implementation of the requirements of indigent defense counsel
        services for standards 1-5 and funding for the additional standards to be introduced and
        implemented. From what was originally enacted in PA 93 of 2013 with the state responsible for the
        cost of implementing the new standards, the County has fully implemented the first set of standards
        with no negative financial impact to the General Fund and our compliance plan and cost analysis
        has been approved each year.

The objective of this analysis focusing on the above is to define the financial parameters for the 2022
budget. All offices and departments should expect to see the financial position of the County and our
forecast reflected in 2022 budget policy and appropriation recommendations from this office to the Board
of Commissioners. This will ultimately be incorporated into preliminary and recommended budgets and is
consistent with past practices related to budget development.

2. OBJECT STATEMENT

These guidelines are intended to present a framework with supporting data for preparation of the budget.
Additionally, other ongoing budget management reports and are all subject to updated information and

                                                                                                          Page 2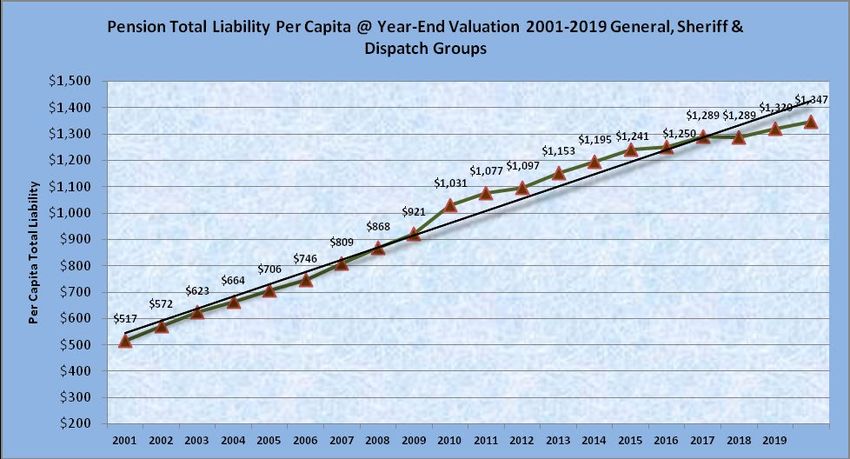
figures throughout the budget development phase. The preliminary outline for the 2022 budget reflects the
supporting figures and assumptions contained throughout this document.

All State funded programs must continually be monitored to insure that changes do not take place that can
negatively impact the County’s annual operating budget and leave the County to cover obligations intended
for the State. This is due to the State budget starting October 1 while the County budget is calendar year.
Changes at the start of the State budget can impact the County budget during the 4th quarter. The Board of
Commissioners will rely on those department’s receiving state funding to confirm the accuracy of projected
funding for 2022 and those department managers shall be prepared to modify budgets should funding
levels change even after the County budget is adopted. As a political sub-division, county government is
subject to the annual appropriation process of the Michigan legislature and strategies the state uses to lower
transfer-out expenditures to local units. With the COVID-19 response and other state budget changes, the
impact to the County budget has to be understood including one-time supplemental appropriations for
target programs and services.

Notes relative to State funding that could affect the County’s budget and corresponding level of services to
the community include:
a) Impact from Public Acts 397 through 408 covering personal property taxes. In 2016, the Michigan
    legislature provided the replacement funding intended to make local units whole from the loss of
    revenue from manufacturer’s personal property tax. Generally, we budget very conservatively as the
    figure has varied dramatically (2017-2019). Accordingly, we have kept the projections we had in prior
    budgets for this revenue source going forward. The five (5) years of budget vs. actual for PPT:
            2016 Budget $275,000                  Actual $814,210
            2017 Budget $275,000                  Actual $1,452,564
            2018 Budget $300,000                  Actual $647,072
            2019 Budget $450,000                  Actual $1,005,007
            2020 Budget $375,000                  Actual $1,061,453
            2021 Budget $375,000                  Actual TBD

Separately, funding reimbursement is provided to the Commission on Aging, Fairview Home and the
Museum’s budget. These amounts are reported in those special revenue funds.

b) Changes in childcare funding, reimbursement rates, cost allocation plan amounts and associated
   additional program administrative rules and requirements. We continue to measure the impact from the
   new rules, requirements and interpretations of eligible costs highlighting the challenge of this
   partnership with the state, courts and counties. Our observations are that this cost sharing outcome and
   impact to the County has been more favorable for reimbursement since changes were implemented 4
   years ago.

c) Solid Waste programs and changes to fund balance in the Solid Waste fund from revenue variations
   and continued demand for services will result in a reduction in fund balance. Sourcing for demand of
   recycled products has dropped and impacted the overall costs and services provided moving them
   higher.

d) Any changes in Maintenance of Effort terms in the funding formulas that would not be beneficial to the
   funding unit and allow the state to leverage County efficiencies and cost controls with unequal benefit
   under the funding formulas.

                                                                                                        Page 3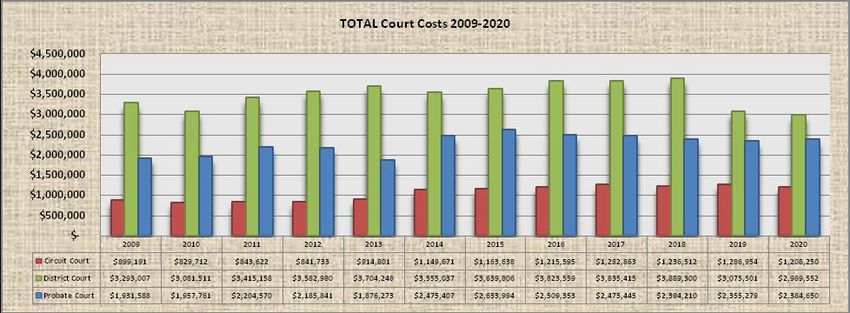
e) Continued criminal justice reforms that could impact housing of juveniles and a lack of adequate cost
   sharing from the state for any new mandated services. Our own local community based programs will
   also drive impacts in these areas.

f) The intermediate and longer-term impacts of the Michigan Joint Task Force on Jail and Pretrial
   Incarceration Report Recommendations including jail population and resulting staffing needs and other
   areas including courts and probation staffing.

g) County revenue sharing in aggregate is proposed by the Governor and Senate to be increased 2%. In the
   House, the preliminary increase is 1%. We will maintain the same amount of revenue sharing in our
   preliminary figures until the state adopts its budget.

3. ANNUAL BUDGET WITH 2nd YEAR PROJECTION

The Board of Commissioners will consider financial commitments beyond the upcoming budget and weigh
longer-term impacts from any budget or policy commitment. This process will require all departments to
submit estimates of revenues and expenditures for a two-year budgeting cycle for the fiscal years ending
2022 and 2023. This will take a more deliberate scan of risks of revenues and value of planned expenses.
Finance staff will use these projections to update the long-term budget forecast. These projections will not
require a detailed evaluation of every line item, but will consider major revenues and expenditures to
provide an assessment of what trends are forming. The trends will be used to establish a basis to
proactively adjust operations to balance against resources prior to the ensuing budget cycles. These
estimates are modified on an annual basis to adjust amounts for unanticipated events. There is high value in
projecting the future obligations and resources and is worth the effort. The County will continue to adopt a
single annual year budget in compliance with the Uniform Budgeting and Accounting Act and projections
for the second year as required by Public Act 200 of 2012 and as we have done since 2001.

4. OVERVIEW OF THE 2022 COUNTY BUDGET

County finances have continued to strengthen over time from 2014. There continues an easing of the most
difficult decisions involved in formulating a balanced budget without the need to use reserves except to
invest in targeted capital expenditures. Associated with this has been the governing board’s ability to adopt
a budget not less than 45 days prior to its effective date. Supplemental revenues when needed have been
and continue to be available from reserves. Elected officials and managers have operated within budgets
and consistently under spent appropriations to help deliver operating surplus in each of the last 11 years.
The chart below illustrates this budget expenditure trend for the past 10 years:

                                                                                                       Page 4
As a result of this performance, coupled with creating budgets where revenues meet or exceed estimates,
reserves have grown to the strongest levels in the past 30 years and illustrated later in this document.

Notwithstanding these developments, budgets continue to be about choices, and about the best use of
limited resources within the organization. Questions center on how best to deliver the full service menu of
public services to our community. In order to meet the goals of the governing board and present a balanced
budget, we continue to employ a formula of short funding the full annual actuarially determined
contribution to retiree health care. The Board has agreed with this approach as reasonable to meet current
year public service needs, fund current year retiree health care claims and fund long-term obligations. The
chart below illustrates the funding model has been adequate to balance the aforementioned obligations of
the County:

The County has continued making progress in getting closer to a structurally balanced budget to help with
the next economic downturn and simply to be fiscally responsible. This was evident during the 2020 year
as we managed through the pandemic and into 2021. The organization was able to maintain staffing levels
and adjusted expenditure line items to both reflect lower expenses from less operational activity and meet
revised lower revenues. The financial management practices that helped get the County through the 2008-
2010 recession are embedded in the organization as the leadership will continue to make future decisions
on financial commitments. Leaders will expect similar challenges as part of the budget process but also
throughout the year as various financial decisions are made. Each should be viewed against long-term
impacts and sustainability. Expected challenges include: 1) more requests for funding than what is
available from current year resources; 2) conflict over the prioritization and allocation of limited resources;
3) efforts at cost containment to match forecasts of future sustained revenue growth; 4) employee total
compensation and growth commensurate with the market and what the employer can fund over the long-
term; 5) capital investments in technology, facilities and fleet; and 5) continuing to meet funding
obligations of pension and post-employment benefit program expenditures.

Local governments, including the County, must meet a broad number of objectives, but none are more
impactful than maintaining a stable financial position. This results from the fact that any organization will
be severely constrained in its ability to function in a planned purposeful direction if its finances are not well
managed, maintained and strong. While capital investments, good management and service delivery are
critical issues in daily operations, these all contribute from a foundation supporting the financial standing
of any organization, and its ability to deliver services and chart a stable course forward. Financial position
                                                                                                           Page 5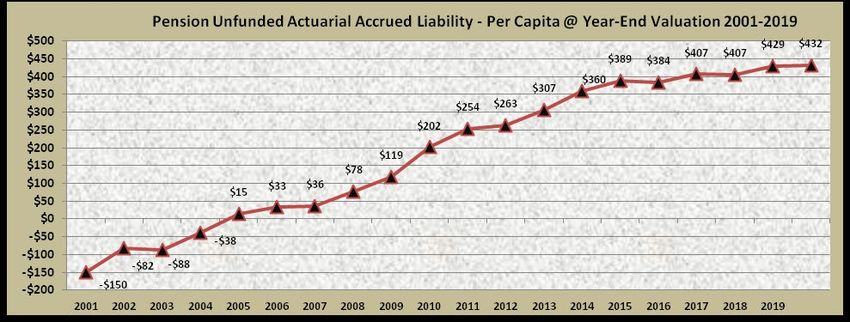
involves adequate margin in current year budgets, trends of delivering operating surplus rather than
operating deficits and maintaining sufficient reserve funds from which rating agencies in part base the
County’s financial credit rating. Much more can be accomplished when financial strength and stability is
certain as this allows the organization to plan and focus efforts on outcomes rather than managing under
financial strain either from factors within or outside leadership’s control. Looking forward, growth will
remain limited due to a number of revenue limits in place from prior legislative action.

Ongoing Initiatives:
The Board has focused on efforts to make purposeful and strategic investments to position the organization
for the next decade and beyond. Initiatives that drive new and more efficient ways of delivering outcomes
through important upgrades to mission critical systems have been made. The goal is to move the
organization internally to enhance public services to our community. Some of these major initiatives
include:
    1) Creating a new shared law enforcement records management system for all county police agencies
        along with new computer aided dispatching and jail records management. The jail management
        component is now operational with the RMS and CAD go live date later this year.
    2) Developing additional tools for our geographic information system and bringing local units of
        government into this shared platform. Next up to launch is a community event calendar.
    3) Finishing the complete overhaul of the County information systems hardware and software
        infrastructure to position the county to lead on the above initiatives while building a secure data
        network. In a global acceleration of cyber and ransom ware attacks, this initiative is essential.
    4) A workforce wage and total compensation analysis that determined both external competitiveness
        and internal equity. The implementation of the findings began in 2020 and continues through 2021
        as CBA’s expire. The design of a new total compensation plan for the workforce has been
        developed and is in transition as part of collective bargaining outcomes. These include voluntary
        choices for program packages incorporating post-employment and wage schedules that serve to
        incentivize retention and recruiting of the talent needed for organizational outcomes.
    5) Continuing to implement additional features of our payroll and human resources operating system
        providing a streamlined and integrated approach for efforts in managing our most important asset;
        human capital. Further progress is on replacement of the financial management software operating
        system in 2021-2022 along with District Court workflow applications, and;
    6) Overhauling the County-wide fire services alerting system including moving to a new wireless
        frequency and utilizing 9 tower sites from the current 5 and replacing 508 paging devices.

Qualification for Revenue Sharing:
The County has taken the steps required to be eligible to continue receiving State revenue sharing and to
qualify for the County Incentive Program (CIP) grants. This includes being able to demonstrate several
performance standards or be subject to reduced amounts of State revenue sharing.
           Standard                                           Compliance Date        County Action
       • Transparency or dashboard comparative                December 1, 2020       Compliant
           data on operations and finances

       •   Debt Service Report-All Funds                       December 1, 2020      Compliant

       •   Projected Budget Report                             December 1, 2020      Compliant
           See www.co.monroe.mi.us front page for dashboard

                                                                                                     Page 6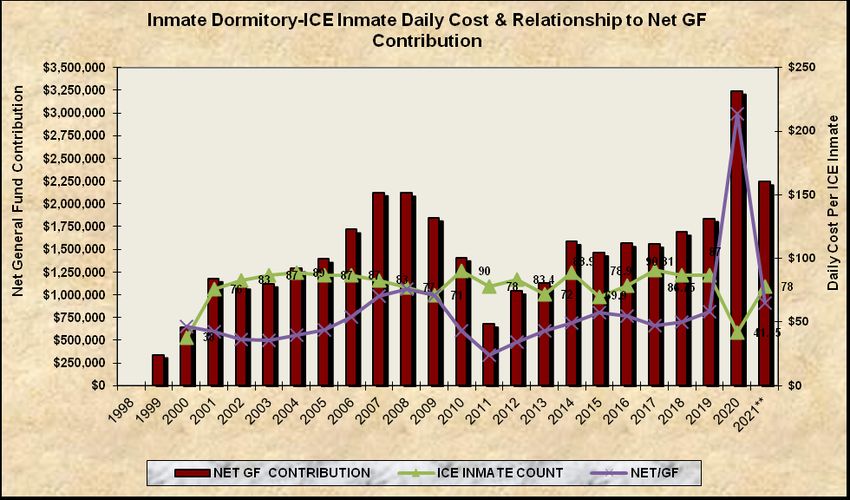
While sufficient revenue growth is necessary to fund the delivery of public services, we reinforce the need
   for a continued effort to achieve higher levels of efficiency and associated cost savings to maintain a broad
   menu of public services from a full service County government. The County’s efforts have been successful
   in leveraging technology investments, consolidating and restructuring internal services and lowering costs.
   Over the past several years, the Board has approved reorganizations to restructure departmental staffing,
   consolidate operations and improve internal efficiencies. These have all been pursued while the General
   Fund Budget is lower by $6.65 million or 14.1% from 2008 to 2021. When the 2020 budget was prepared,
   a summary of 10 key actions/initiatives the organization had taken resulted in over $8 million in
   cumulative savings. The Board continues to employ new strategies that will provide a solid financial
   footing to the organization.

   The County has made significant progress in balancing its operating costs to be closer in line with available
   revenues. We point to the multi-year budget trend to demonstrate this. While these budgets were not truly
   structurally balanced, they were improved over the budgets of 2009-2014. What structural imbalances
   remained, were resolved by: a). the County covering the budget shortfall using reserve funds, and; b).
   short-funding retiree health care. The 2019 and 2021 budgets were developed with small projected
   surpluses but recognizing less than full funding of the actuarially determined contribution (ADC) to RHC.

   i. Use of Reserve Funds:
                                      2013               2014               2015              2016             2017              2018              2019             2020            2021
Source/Use of Reserve
Funds                                Budget             Budget             Budget            Budget           Budget            Budget          Budget          Budget          Budget
Budget Stabilization             $ 873,343          $ 129,901          $ 152,429         $            -   $            -    $            -     $          -     $          -    $          -
Contingency Account
Shortfall                        $ 348,646          $            -     $             -   $            -   $            -    $            -     $          -     $          -    $          -
Fund Balance                     $            -     $            -     $ 369,000         $ 488,670        $ 618,731         $ 451,985          $          -     $          -    $          -
Total Use of Reserve
Funds                            $1,221,989         $ 129,901          $ 521,429         $ 488,670        $ 618,731         $ 451,985          $          -     $          -    $          -

   ii. Short Funding Retiree Health Care Annual Determined Contribution:
       Due to budget imbalances, the County has consistently underfunded the actuarial determined
       contributions (ADC) for retiree health care (RHC) benefits over the past ten (10) budgets in aggregate
       of $20.3 million and as shown by year below:
       Budget Year        2012               2013           2014              2015             2016           2017              2018           2019             2020                2021

       ADC Shortage     $1,999,234      $1,999,420        $2,008,724        $3,184,973       $1,388,219   $1,673,273       $2,387,756        $2,277,129       $2,049,319       $1,404,322

        These budget measures were by design as the choice was made to fund critical public service programs
        and employee positions. In each of these years, and projected in the current year the County was able to
        fund all current RHC claims and invest funds into the RHC trust even though the recommended ADC
        was not funded. The chart on page 5 illustrates this. The outcome was possible due to lower claim costs
        and cost control measures previously implemented. However, GASB Standard 75 requires the resulting
        net liability (UAL) to be recorded on the County’s balance sheet. This is of course a significant liability
        at $56.6 million as of the 12/31/2019 financial statements. But it is markedly lower from the prior year
        statements at $74.2 million reflecting a 37% reduction in the net liability and further improved from
        2013’s amount of $97.4 million.

        A. Budget Outcomes
           The following sections provide a summary of past budget results in major areas of the budget along
           with some relevant notes of what we know are major program areas of the budget. In addition,
           summaries comment on Board strategies developed and implemented to address financial planning
           in the County and our planned appropriations for the 2022 Recommended Budget. We outline notes
                                                                                                                                                                                      Page 7
regarding history of County budgets, trends in major budget categories and overall financial
management of the County.

1. General Fund-Operating Results
Prior year actual results over the past fifteen (15) years are as follows:

           Year            General Fund Operating Surplus/(Deficit)
           2006                   $134,059
           2007                   ($528,397)
           2008                   ($3,412,980)
           2009                   ($1,979,822)
           2010                   $1,991,171
           2011                   $1,887,966
           2012                   $146,879
           2013                   $507,171
           2014                   $360,275
           2015                   $269,821
           2016                   $894,080
           2017                   $772,422
           2018                   $2,687,511
           2019                   $2,763,631
           2020                   $5,414,108
The last eleven (11) consecutive years have delivered positive operating results vs. operating
deficits from 2007-2009. Since 2010, aggregate increases of Fund Balance are $17,695,035 or an
average of $1,608,640 a year. The most recent 5 year period produced average operating surpluses
of $2,506,350 per year. Note however, the 2020 results must be viewed in the context of separating
what are abnormalities in how additions to Fund Balance occurred:

1st, a total of $2,314,860 came from a transfer-in from the Delinquent Tax Revolving Fund to be
used or designated to pay the cost of the four (4) year phase-in of the wage and total compensation
plan. This is one-time supplemental funding that contributed to the result, but note also money is
already designated for the compensation plan but must be reported in fund balance in the General
Fund.

2nd, the County received a total of $3,163,188 in CARES funding as reimbursement of costs
expended primarily for public safety and public health operations in the months of April and May
2020. This is one-time supplemental revenue that contributed to the result.

The total of these two (2) funding amounts is $5,478,048 that contributed to the preliminary result.

3rd, in the General Fund, the organization under spent the governing board’s appropriation by
5.33% or a total of $2,664,860. This was due to a number of factors including position vacancies,
deferred expenditures and less operational activity with corresponding lower expenses.

In a global pandemic, we cannot expect future outcomes that result from a 100 year event. If the
one-time funding is separated out, the result would be a reduction of fund balance or operating
deficit.

                                                                                               Page 8
The most prudent use of our financial position is to invest resources into the organization for one-
time strategic funding in capital programs for facilities, technology and equipment to strengthen the
efficiencies of our operational capacities of the organization.
2. Retiree Health Care
Overall, the County is funding the obligation fairly consistently and in a manner that is
strengthening the plan’s financial position. In the current year, funding is at 82.8% of the ADC
when County Agency funding is included. As we see the funded ratio strengthening, we will move
the level the percentage funding of the ADC to 80% as a funding practice. In the current year, the
shortfall in funding the ADC is the second smallest in 10 years. The most recent funded ratio of the
plan increased over the prior year to 53.2%, the highest ever.
3. Pension
The Employee’s Retirement System funded ratio has fallen from 135.9% in the 12/31/2000
valuation to a low of 71.40% at 12/31/2019. Year over year it remained nearly unchanged but
declined a minuscule .01%. The trust fund’s overall financial trend has not shown any move toward
a positive trajectory. In the chart below, we best see the inverse relationship between funded ratio
and the ADC. As the funded ratio declines, the ADC increases. The unfunded actuarially accrued
liability (UAAL) (all employers) now stands at $86.03 million; an increase of $2.13 million over
the prior year and follows the preceding year’s increase of $6.8 million. Considering only the
County’s obligations, at 12/31/2019 the UAAL was $64.7 million.
4. Employee Health Care
Health care plans with a choice among three (3) plan options have been selected by employees as
outlined in the chart below. Annually, the plans are priced by the County’s TPA for the illustrated
premium cost. These plans all fall under the hard cap provision of SB7 and have consistently been
below the State’s hard cap amounts. The County continues to be fully compliant with the new
Michigan publicly funded health insurance contribution act opting for the hard cap cost
containment measure. The value of the plans was analyzed as part of the total wage and
compensation study and as a result no changes to the plans are being made. The County’s plans are
also compliant with the federal affordable care act. The below chart shows the plan selections the
past seven (7) years including the annual buyout option at $1,000 per contract:
Page 95. Employee Compensation Program
Most employee groups received a 1.5% base wage increase in 2021 along with transitioning to the
new total compensation plans. In the 2022 budget, most groups will receive a 2.0% base wage
increase along with the 2nd year phase-in adjustment to the new plans. In the current year, we will
be presenting a budget amendment once all CBA’s are negotiated to adjust all wage and effected
fringe costs resulting from implementing the wage analysis recommendations with funding
previously committed.
6. Capital Outlay
A history of the funding allocated to the Capital Improvement Program since 2008 is outlined
below:
Budgeted Budgeted Supplemental
Year Amount Year Amount Funding
2008 $ - 2016 $ 200,000
2009 $ - 2017 $ 200,000 $ 650,000
2010 $ - 2018 $ 190,000
2011 $ - 2019 $ 250,000 $ 829,454
2012 $ - 2020 $ 350,000 $ 1,190,000
2013 $ - 2021 $ 375,000 $ -
2014 $ - 2022* $ 375,000 $ -
2015 $ 175,000 2023* $ 700,000 $ -
*Projected
The Board appropriated an additional amount of $1,190,000 in 2020 for the exterior maintenance
project at the Inmate Dormitory facility. No supplemental funding has been appropriated in the
current year. As shown above, capital outlay amounts have been supplemented as needed both from
additional appropriations and from the property foreclosure fund. The foreclosure fund will no
longer be available for a source of funding following changes in the law on how excess proceeds
can be distributed.
Page 10B. Key Drivers of County Finances
1. Use of reserves, one-time funding sources and other budgeting techniques continue trending
positive in successive budgets. The major exceptions remain in how we are balancing all
expenditures for public services with a reasonable funding model for the RHC ADC. The pension
ADC is funded at 100% each year. What follows is a year by year summary of how budgets were
balanced in the prior five (5) years, along with a chart depicting the same but over 15 years showing
an improving trend:
2017 Budget: $1.67 million of RHC was underfunded vs. ADC, $618,731 used from Fund
Balance and used $80,000 from Foreclosure Fund.
2018 Budget: $2.38 million of RHC was underfunded vs. ADC, $451,985 used from Fund
Balance and $80,000 from Foreclosure Fund.
2019 Budget: $2.41 million of RHC was underfunded vs. ADC and $80,000 used from
Foreclosure Fund.
2020 Budget: $2.05 million of RHC was underfunded vs. ADC and $80,000 used from
Foreclosure Fund.
2021 Budget: $1.4 million of RHC was underfunded vs. ADC
The chart below shows the pattern of shortfall funding of RHC for budgeting and balancing from
reserves:
2. The 2021 contingency account is funded at $482,529 with $233,294 of the amount restricted.
To date, nothing has been transferred out of the contingency account but we expect to pull the full
amount for CBA adjustments prior to year-end 2021. We plan to include a similar amount in the
contingency account for the 2022 budget.
Prior year budgeting and associated cost containment efforts by the Board, department leaders and
employees have helped and will continue to help contain cost escalation in the budget. There have been
many successes in this area. Some of the financial impacts, outcomes and further consideration of
Board policies and appropriations are highlighted as follows:
3. In 2022, Property tax revenues will increase for the 8th consecutive year. We project this after
incorporating the DTE and Republic Waste reductions from their 2020 tax appeals. In the current
year, we estimate property tax revenues at $30,402,000. This includes a contingency of $350,000
for MTT adjustments with the majority for Fermi II tax litigation. With an expected gain of 1.92%
Page 11in 2021, we estimate a net increase of $596,084. In addition, we are adjusting our contingency for
MTT based on prior settlement figures with the Monroe Power Plant and with that revision we net
the property revenue increase year over year to be $997,225. That is higher than the prior year
estimate 1.57%. We have also revised the 2023 change in taxable value to be 1.89% versus our
previous figure of 1.52%. These are small adjustments but reflect our best estimates on up to date
information. Importantly, this source of funding to support the General Fund represents 65% of the
total revenues.
4. The Retiree Health Care benefit program continues on a path growing more financially
sound. Some of the factors include: 1) lower actual claims and projected expected claims; 2) lower
future cost increases based again on the County’s actual claims results; 3) Consistent and increased
rates of funding the ADC; and, 4) Consistent investment returns exceeding both the actuarially
discount and the trust fund benchmark comparison. The expected funding level in 2022 will follow
the prior year’s effort with a slight change to keep funding at 80% of the ADC. Below is a table
showing the nine (9) year summary of RHC revenues less total claims paid and expenses with the
resulting net working capital. Ultimately, this is transferred into the RHC Trust for investments to
pay future benefit claims and expenses:
9 Yr.
Category 2012 2013 2014 2015 2016 2017 2018 2019 2020 9 Yr. Total Average
Revenues $7,292,713 $6,665,147 $6,948,203 $7,816,345 $7,440,986 $6,998,433 $7,176,681 $7,158,816 $7,705,924 $ 65,203,248 $ 7,244,805
Expenses $5,178,250 $5,233,610 $5,889,859 $5,297,109 $5,182,362 $4,638,142 $5,478,479 $5,306,935 $4,975,249 $ 47,179,995 $ 5,242,222
Net
Working
Capital $2,114,463 $1,431,537 $1,058,344 $2,519,236 $2,258,624 $2,360,291 $1,698,202 $1,851,881 $2,730,675 $ 18,023,253 $ 2,002,584
Expenses include claims, investment management fees and cost associated with RHC.
5. New methods to improve efficiencies, deliver services, and focus on core priorities continue to
be identified by most of our managers and employees. Departments’ organizational structures have
been flattened from reorganizations that saved money, quickened decision making and added staff
hours. All of these efforts aid communication, information sharing and enhance teamwork. As this
strategy continues, more funding is being directed to technology resources to create more reliable
data for decision making and sharing the data across work teams or offices. Examples include HR
enterprise system, law enforcement records management system and geographic information
systems. These are all essential areas for continued investments to drive more effective services
both internally to the organization and in the community.
6. Numbers of Liability claims have moved back to expected vs. long-term average counts. The
litigation files increased from a single occurrence and with multiple claimants bringing frivolous
claims that are now being dismissed. The cost impact has been minimal with little discover
involved and efforts focused on motions being filed. In addition, we are managing the litigation
related to property tax foreclosure claims but will cover the resolution of those from the foreclosure
fund. Beyond those matters, overall we remain below our 30 year average of active litigation files.
The County has benefited from reduced pricing from property and liability rates/discounts through
the County’s group self-insurance program. Also, as members, we received risk avoidance grants
and net assets distributed back to the program’s internal service funds. Operating an internal service
fund, we adjust the illustrated rates to cover claims, along with IBNR and case reserves against
working capital. As a benchmark and without inflation considered, since 2007 the annual
contribution is the lowest amount, thereby saving $209,930 annually. When we include optional
contributions to our loss fund, the annual savings are $409,930. This is a very good outcome and we
continue with coverage limits unchanged at $15 million per occurrence.
Page 127. Operating expenses related to most energy and utility costs are expected to begin trending
above historical budget amounts, as federal and state regulatory actions drive marketplace change.
Michigan allows electric choice programs with a 10% cap of the available base load to choice
customers. The County has been a choice customer for 12 years with aggregate savings of
$925,000. In April, we added the Jail to the program as cap space allowed. A summary of prior
years of budget vs. actual total utility spend follows:
Year Budget Actual Savings over Budget
2014 $1,081,625 $1,047,345 $ 34,280
2015 $1,042,443 $ 923,424 $119,019
2016 $ 958,565 $ 896,294 $ 62,271
2017 $1,025,841 $ 912,685 $113,156
2018 $ 986,064 $ 979,337 $ 6,727
2019 $ 991,435 $ 949,026 $ 42,409
2020 $1,115,758 $ 933,227 $185,521
Totals $7,201,721 $6,641,338 $560,383
Average Margin of Budget vs. Actual -$80,055 savings over budget
The above illustrates savings from energy programs and purchases of energy supplies but without
controlling for weather impact on usage. Over this period we have been able to achieve savings by
under spending the amounts budgeted.
8. The employee safety program continues with no negative trends in claims. Due to employee
engagement and regular management focus on safety practices, the number of worker’s
compensation claims and expenditures remain low compared to past program results. Over a time,
the County’s claims remain lower than the comparable benchmark of other public organizations.
Summaries of semi-annual work site inspections highlight and demonstrate the collective efforts of
leaders and employees toward workplace safety. In 2020, claim frequency was 39% lower than the
prior year. However, the average cost per claim rose 33%. When the top 4 high cost claims are
excluded, the average cost per claim would have fallen by 810%. Overall, while the excess market
has tightened, the County has not seen commensurate increases. The program includes a $500,000
SIR limit per occurrence.
9. Full time staffing of County employee positions were reduced by 30.5% from 2000 to the 2021
budgeted figure. That is a net reduction of 141 employees. Since 2011, we have added 41 positions
into the organization. With our long-term forecast, we continue to project this chart to remain
relatively flat for the next 5 years except for public safety efforts where this would align with the
Board’s priorities.
Page 1310. Key economic and financial indicators including the unemployment rate, tax delinquencies,
home sales along with higher sale prices, etc., have all continued to show positive signs of
improving economic conditions over a 4-5 year period. Below are some specific notes from local
economic activity:
Single family residential housing starts: County-wide the total value of new single
family housing starts moved over the past 5 years as follows:
2020 $58.1 million
2019 $68.1 million
2018 $62.1 million
2017 $67.1 million
2016 $56.0 million
All Building Activity: The value of all new construction in the County is reported over
the past several years as follows:
2020 $136.9 million
2019 $114.4 million
2018 $74.8 million
2017 $136.0 million
2016 $78.10 million
Unemployment in 2020: Reached a high of 26.2% in April and a low of 3.2% in
February. Overall, 2020 had an annual adjusted rate of 8.9%.
Equity markets: After a rocky beginning, market returns continued solid growth again in
2020 following a good 2019. These returns helped the market values of both defined benefit
trusts. The RHC returned 14.43% and 19.95% in 2020 and 2019 respectively followed by
the pension trust at 13.73% and 17.47% for the same years.
11. The County’s credit rating remains unchanged and strong. At the time of drafting this
document, we describe the County’s finances as stable with a trend of strengthening reserves. In
February this year, Moody’s reaffirmed its Aa2 rating. Previously, in May 2019, Standard and
Poor’s published its rating analysis for the County’s credit rating of AA with a long-term outlook of
stable. The analysis of the County’s finances included adequate budget performance with expected
break-even or better general fund operations and strong management conditions with good financial
policies and practices. These upgrades and continued ratings reflect our own internal view of the
County’s financial position. A key component of the improvement in the County’s financial
position has been cost control measures that have been developed and remain in place. What
continues to remain as primary concerns are the unfunded accrued liabilities of the pension and
retiree health care trust funds.
12. Actual expenditures have consistently been under spent as compared to appropriations over
the last ten (10) budgets. This information was previously illustrated in a prior chart. This trend is
reflective of good financial management throughout the organization along with effective cost
controls. As we develop the budget, we continue to adjust various line items to be in line with
operating needs of the departments. In 2018, we began to capture cost savings when legacy
employees on Tier 1 total compensation plans left employment. Significant percentages of these
savings will continue to be redirected to legacy benefit programs to be able to support the financial
obligations for pension and OPEB through funding the annual ADC’s.
Page 14C. Budget Summary:
Our preliminary projection is that the County remains unable to develop a structurally balanced budget
when we include full amount of the RHC ADC. In addition, we are on a four (4) year phase-in to fund
the full cost of the new total compensation plans that moved wages to market benchmarks. Some
employee classifications were up to 20% below the midpoint of the comparable market positions and
adjustments for this deficiency along with base wage increases will exceed new revenues. So, reserve
funds will be deployed to cover the budget imbalance and included in the recommended budget.
However, we continue to see positives in the budget due to a culture of fiscal discipline within the
organization. Revenue limitations over time and the slow growth of revenues since the great recession
have required our continued focus on cost control. As noted earlier, we will see significant inflows of
one-time funding from the American Rescue Plan Act of 2021 and our prior strategies of fiscal
discipline and targeted use of funds must be part of the plan to utilize these funds.
In addition, the organization has to continue with its strategic investments in economic development
efforts to support creating an environment for investment in our communities and the opportunities for
our citizens that will flow from further private investment. Based on the foregoing, we do not forecast a
scenario where current revenues will meet planned expenditures with full funding RHC ADC. The
ADC shortfall of $1.4 million is not forecasted to be reduced and we recognize this is not a funding
priority given the overall results in the RHC benefit program financials. We will continue to leverage
lower costs and expenses while striving to provide a level of staffing necessary to meet our menu of
public services to the community.
We again note our focus on cost control and fiscal discipline to be a primary strategy for maintaining
financial stability even as we expect to emerge from the full impact of the global pandemic. While one
time funding sources and occurrences will skew financial statements and reserve balances, a thoughtful,
deliberate and measured approach for the best use of these funds over a 3-4 year period will be a good
plan in our view. This is because we do not yet fully understand the impact on commercial properties
and other economic activity that will result in changes in revenues. A key focal area will be filling in
some underfunded baseline expenditures in areas of the organization where investments continue to be
needed. This will include capital planning for some of the most significant investments to be made.
On the revenue projections, we will continue our conservative assumptions with property tax revenues
to err on the side of ensuring sufficient resources to meet budgeted expenditures. For 2022, our
preliminary outline of the budget is a shortfall of $1,349,625. This is preliminary and much more
information and effort will be part of the work to develop the recommended budget and this number
will change.
When we consider the projected increases of property taxes in the 7 year financial forecast we show
shortfalls against expenditures. In fact, the shortfalls accelerate in the out years. So, our plan to manage
through the shortfalls includes use of fund balance while we continue to outperform the budget in other
expenditure areas. Given the organization’s prior performance, we will develop this plan for the 2022
budget with confidence in its success. Understanding that budget approach, we will create the
underlying baseline budget structure and from this learn how long reserves may be appropriately used
to cover the projected budget shortfalls in the next 3-5 years.
Page 15A glance at the past 21 budget actual results and 2021 & 2022 year’s budgeted:
*Budgeted amounts
As work continues on the 2022 budget, a snapshot of key County financial data is provided below with
major revenue and expenditure categories on the pages that follow:
Key Indicator Financial Measure
General Fund current year budget: $47,034,756
2021 over 2020 budget increase -1.02% vs. inflation 1.4%
Full time GF employees: 464
Taxable value (2020): $6,462,080,873
Assessed Value (2020): $7,783,657,346
General Fund Debt obligation as of 1/1/2021: $0
Unfunded liability-Pension Fund @12/31/2019 $86,028,538
Funded Ratio @7.0% 71.4%
County Employer Portion $64,678,410
County Agency Portion $6,309,704
Pension Trust Market Value Year-end 2020 $233,956,963
Unfunded liability-RHC @12/31/2019 $56,608,720
Funded Ratio @ 5.5% 53.2%
RHC Trust Market Value Year-end 2020 $93,402,508
County Allocated Market Value $79,672,340
Unassigned Fund Balance @12/31/2020 $16,957,458* (36.05% of 2021 GF Budget)
Budget Stabilization Fund @12/31/2020 $2,726,500* (5.87% of 2021 GF Budget)
Credit Rating-Standard & Poor’s Rating Services AA Stable
Moody’s Investor Services Aa2
5. REVENUES
A. Equalized Valuation & Property Taxes
Property tax revenues consistently make up approximately 63-65%% of the General Fund’s revenues.
A mid-year budget amendment in 2020 incorporated the tax appeal settlements of the Monroe Power
Plant and Republic Waste. The taxable values and corresponding revenues were re-set accordingly and
going forward. In total, the effect was a decrease of $596,000 in General Fund revenue. What remains
from the utility property tax appeal is resolution of the nuclear power plant valuation. In prior budgets,
Page 16we reserved an average of $847,500 to account for expected property tax revenue losses and legal
defense cost related to both plants. We will be including additional reserves in ensuing budgets to fully
absorb and recognize the loss of the DTE Monroe Power plant revenue over the 8-year agreement and a
contingency for the nuclear plant until resolved.
The Taxable value trend illustrates increasing values. The unknowns of future personal property losses,
new construction gains, MTT appeals and future inflation rates still makes it difficult to fully project
what rate future taxable value will be in the out years. However, we can be more accurate the shorter
the horizon. In the 2022 budget we are projecting an increase of 1.92% and similar increase of 1.89% in
2023. These are up slightly from the prior year based on updated figures from Equalization. We
incorporate these estimates in the 2023 budget and forecast models. We also look within the region to
compare how the values change in our neighboring counties. The chart below illustrates the most recent
changes in values and shows Monroe having the smallest increase in taxable value among 7 counties.
Page 17B. Sources Of County Property Tax Revenue
The County’s top ten (10) taxpayers and their 2020 Taxable Values are outlined below:
TAXPAYER PRODUCT/SERVICE 2020TAXABLE VALUE
DTE Energy Power Plant/Utility $1,019,056,989
International Trans. Corp. Utility Transmission $ 66,720,350
Consumers Power Utility $ 29,455,125
Nexus Gas/Enbridge Pipe Line $ 28,600,883
Good Will Co. (Meijer) Retail/Warehouse $ 26,825,073
La-Z-Boy Inc. Furniture $ 22,815,984
Global Engine Asset Automotive Plant $ 22,659,050
Michigan Gas Utility $ 21.927,633
Gerdau MacSteel Steel Processing $ 16,331,670
Michigan Elec Trans Utility $ 12,598,634
TOTAL $1,266,991,391
Total 2020 Equivalent Taxable Value $6,462,080,872
Total Top 10 Taxpayers as a % of 2020 Total Taxable Value 19.61%
Compares to 22.85% in 2019 TV
2020 Taxable Value Breakdown by Property Class
Page 18Class Taxable Value Percentage
Agricultural 339,379,460 5.25%
Commercial 698,504,924 10.81%
Industrial 662,865,751 10.27%
Residential 3,865,120,937 59.82%
Developmental 1,787,855 0.00%
Personal 894,421,945 13.85%
Total 6,462,080,872 100.00%
2008-2023 Actual and Estimated Property Tax Revenues
YEAR EST/Actual Property Tax Revenue % Change $ Change
$461,084
2008 $29,580,781 1.58%
2009 $28,522,671 -5.14% ($1,548,640)
2010 $27,267,793 -4.76% ($1,364,207)
2011 $26,778,208 -1.80% ($489,585)
2012 $26,304,143 -1.77% ($474,065)
2013 $26,219,236 -0.32% ($84,907)
2014* $26,158,335 -0.23% ($60,901)
2015 $26,839,265 2.60% $680,930
2016 $26,969,035 0.48% $129,770
2017 $27,532,954 2.09% $563,919
2018 $28,383,616 3.11% $1,131,579
$29,520,450
2019 Budgeted $28,725,450 Net 1.29% $1,372,272
$30,277,165
2020 Budgeted $30,033,000 Net 4.50% $418,903
$30,752,751
2021 Budgeted $30,402,751 Net 1.24% $475,351
$31,700,000
2022 Budgeted $31,400,000 Net 3.20% $997,249
$32,300,000
2023 Budgeted $32,000,000 Net 1.98% $600,000
*Tax Revenues reflect payout of Consumers Energy MTT and revised receipt totals
2019-2023 Tax revenues are estimates based on assumptions; Budgeted amounts Net includes reserves for
DTE MTT Litigation/Adjustment/Refunds; % Change in these years is the net change
Page 19C. Court Case Filings/Trends & Data
The case filings of the District and Circuit Courts from 2006-2020 show that year 2020 totals are
29,634 cases below those from the highest volumes in 2006. The 14 year summary along with court
appointed attorney fees is as follows:
Year 2006 2007 2008 2009 2010 2011 2012 2013 2014 2015 2016 2017 2018 2019 2020
District 46,420 44,664 42,889 39,223 37,104 31,858 34,174 35,733 32,698 31,240 33,530 34,686 36,253 34,345 20,621
Circuit 5,129 4,856 4,762 4,309 4,583 4,479 3,418 4,064 3,839 3,595 3,521 3,884 3,410 3,297 2,551
Probate Case
Filings 711 735 742 678 737 785 767 758 746 725 719 748 761 701 674
Probate Minor
Cases 580 557 548 508 502 518 521 506 479 440 426 379 358 327 332
Friend of the
Court 1,280 1,223 1,254 1,240 1,234 1,197 1,167 1,189 1,085 1,074 1,023 1,147 1,022 959 308
Totals 54,120 52,035 50,195 45,958 44,160 38,837 40,047 42,250 38,847 37,074 39,219 40,844 41,804 39,629 24,486
Per Court Caseload Reports: http://courts.mi.gov/education/stats/caseload/pages/default.aspx
Friend of the Court Cases are included also in Circuit Court Counts
Circuit and District Courts:
Since 2006, there has been an overall trend of lower case filings. 2020 saw counts lower by 14,470 cases
over the prior year or 38.5%.
Circuit Court Case Filings, Court Appointed Attorney Fees and Transcrip Costs 2006-2020
Page 20Probate Court:
There had been general increase in court appointed attorney fees from 2011-2015 and costs have come
down and have been relatively steady in the last 3 years. The numbers of minor case filings have
continued to trend generally lower through 2019 and then were impacted from pandemic activity.
Probate Court Case Filings, Total Minors, Court Appointed Attorney Fees & Transcript Costs 2006-2020
Monroe County Court’s Expenditure Trends Over Time:
D. Court Equity Revenue
The Court equity Fund, enacted under PA 374 of 1996, created a new funding source for all county trial
courts. This legislation also established new responsibilities for local trial courts including the creation
of the family division in the circuit court, and expanded jurisdiction of the district court. Funding trial
courts remains a focus of counties who fund in aggregate 44 % of the trial courts. Past amounts
received by the County have moved lower by nearly $170,000 but have stabilized. Case volumes are
counts only and do not reflect case weighting or Court Operations Resources Report that would be used
in the level of funding for each court.
Page 21*2021 & 2022 are budgeted figures
E. Friend Of The Court
The Friend of the Court (F.O.C.) Fund had a total of 308 new filings in 2020. In 2020, the fund
recorded an operating deficit of $17,131, but as expected with some planned expenditures. In years
2007-2010 an aggregate of $830,156 in operating deficits occurred. Since then, we have been able to
report operating surpluses (addition to fund balance) totaling $642,647.
As the fund has been returning surpluses from operations, the county has been able to reduce, and then
flatten the transfer out from the General Fund due to lower costs and use of fund 215 fund balance
when needed, but intended as one-time funding. At year-end 2020, the fund balance of Fund 215 is
$642,649. The summary of budgeted transfers out to the Friend of the Court Fund, total budget and the
annual number of new case filings is illustrated below:
Per Court Caseload Reports: http://courts.mi.gov/education/stats/caseload/pages/default.aspx
2020 case count estimated at equal to 2019
F. State Revenue Sharing
The decline with this revenue source began when the State eliminated Revenue Sharing to all Counties
and established the Revenue Sharing Reserve Fund as a way to offset this source of revenue. Each year
Page 22beginning in 2005, the County was allowed to appropriate an amount equal to the annual revenue
sharing payment the County previously received from the State of Michigan (adjusted for inflation) to
replace this source of revenue. Each year thereafter this amount was adjusted for inflation and changed
accordingly with the Department of Treasury providing the amount to be withdrawn from the fund.
After the total amount of the additional tax levy was expended, the State was expected to begin
restoring Revenue Sharing to Counties. This restoration did not meet the amount promised from prior
agreements spelled out for the statutory provision. MAC has calculated that the state has cumulatively
shorted 60 counties more than $110 million between 2009 and 2014. In Monroe County, the total is
$1,528,514. Unfortunately, the amount that should have been provided has not been and if provided, a
number of capital investments could be made with the amount owed. Aside from this cumulative
shortfall, we will monitor the state appropriations process with an expectation of a 2% increase. We
will keep the revenue flat until the amount is confirmed.
G. Inmate Dormitory Revenue-(Immigration and Customs Enforcement Detainee Housing)
Since opening the Inmate Dormitory, reimbursement from housing federal detainees has been an
important source of revenue to help offset the total cost of operating and maintaining the facility. The
initial pro forma financial modeling to finance operation of the facility included this source of revenue.
The operations of the facility are recorded in special revenue fund. Revenues generated from inmate
housing operations and are a primary source of the fund’s revenue with fund generated revenue shown
below:
2020: 53.9% 2017: 54.4%
2019: 52% 2016: 52%
2018: 54.6%
2021** Amounts are budgeted
The following exhibits show the historical financial performance of the fund. The operating results are
monitored closely. Revenues generated from federal prisoner housing offset costs the County would
have to fund exclusively from the General Fund to house County inmates at the facility. Housing
counts for 2014-2019 met or exceeded budget targets. 2020 housing counts were severely impacted the
Page 23You can also read