Bimodal endocytic probe for three-dimensional correlative light and electron microscopy
←
→
Page content transcription
If your browser does not render page correctly, please read the page content below

Article

Bimodal endocytic probe for three-dimensional
correlative light and electron microscopy
Graphical abstract                                                   Authors
                                                                     Job Fermie, Leanne de Jager,
                                                                     Helen E. Foster, ..., Hans C. Gerritsen,
                                                                     Judith Klumperman, Nalan Liv

                                                                     Correspondence
                                                                     n.liv@umcutrecht.nl

                                                                     In brief
                                                                     Fermie et al. present a fiducial marker,
                                                                     fBSA-Au, for high-precision correlation of
                                                                     3D fluorescence microscopy (FM) and
                                                                     electron microscopy (EM) datasets.
                                                                     Endolysosomal uptake and trafficking of
                                                                     fBSA-Au generates a 3D pattern of
                                                                     intracellular landmarks for accurate FM-
                                                                     EM correlation (CLEM). fBSA-Au is
                                                                     demonstrated in a wide range of CLEM
                                                                     approaches.

Highlights
d   fBSA-Au is a bimodal fiducial for precise registration of
    microscopy datasets

d   Uptake of fBSA-Au into the endolysosomal system creates a
    3D correlation map

d   Suitable for key FM (live-cell, confocal, cryo) and EM (resin,
    immuno, cryo) methods

d   High-accuracy correlation with fBSA-Au is shown in an array
    of (3D) CLEM approaches

           Fermie et al., 2022, Cell Reports Methods 2, 100220
           May 23, 2022 ª 2022 The Author(s).
           https://doi.org/10.1016/j.crmeth.2022.100220                                               ll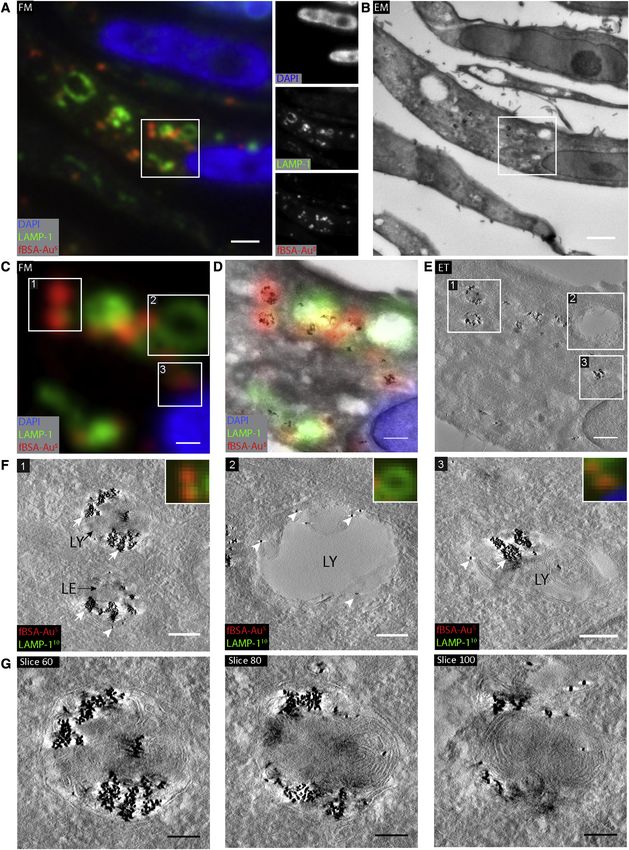
ll
                                                                                                                              OPEN ACCESS

Article
Bimodal endocytic probe for three-dimensional
correlative light and electron microscopy
Job Fermie,1,2 Leanne de Jager,3 Helen E. Foster,4 Tineke Veenendaal,1 Cecilia de Heus,1 Suzanne van Dijk,1
                                                                      € ller,6 Stuart Howes,3 Andrew P. Carter,4
Corlinda ten Brink,1 Viola Oorschot,1,7 Lin Yang,5 Wei Li,5 Wally H. Mu
Friedrich Förster,3 George Posthuma,1 Hans C. Gerritsen,2 Judith Klumperman,1 and Nalan Liv1,8,*
1Center  for Molecular Medicine, University Medical Center Utrecht, Utrecht University, Utrecht, the Netherlands
2Molecular   Biophysics, Debye Institute for Nanomaterials Science, Utrecht University, Utrecht, the Netherlands
3Structural Biochemistry, Bijvoet Centre for Biomolecular Research, Utrecht University, Utrecht, the Netherlands
4Medical Research Council Laboratory of Molecular Biology, Division of Structural Studies, Cambridge, UK
5Institute of Genetics & Developmental Biology, Chinese Academy of Sciences, Beijing, China
6Microbiology, Department of Biology, Utrecht University, Utrecht, the Netherlands
7Present address: Electron Microscopy Core Facility, EMBL Heidelberg, Heidelberg, Germany
8Lead contact

*Correspondence: n.liv@umcutrecht.nl
 https://doi.org/10.1016/j.crmeth.2022.100220

   MOTIVATION Correlative light and electron microscopy (CLEM) approaches are advancing our under-
   standing of intracellular processes by linking molecular dynamics to 3D high-resolution structure. Quanti-
   tative application of most techniques, especially 3D CLEM, is currently hampered by limitations regarding
   accurate registration of fluorescent signals to electron microscopy (EM). Directly addressing this limitation,
   we describe fluorescent BSA-gold (fBSA-Au), a bimodal endocytic tracer, as a fiducial marker for 2D and 3D
   CLEM applications. The fiducial exploits a cell’s own endolysosomal system to create a well-defined 3D
   pattern of landmarks and provides a high-precision (
ll
     OPEN ACCESS                                                                                                              Article

Stierhof and Schwarz, 1989). Correlative light and EM (CLEM),             Here we present an endocytic tracer consisting of 5- or 10-nm
which integrates the data from FM and EM on a single sample,           colloidal gold stabilized with fluorescently labeled BSA (fBSA-
overcomes these limitations. CLEM uses the large reporter di-          Au5 and fBSA-Au10, respectively). We demonstrate applicability
versity and sensitivity from FM to provide protein localization in-    of fBSA-Au as a fiducial marker in a variety of 3D CLEM ap-
formation and register this information to high-resolution             proaches using Tokuyasu on-section CLEM, resin embedding
morphological data without the limitations of EM labeling.             3DCLEM, and targeted lamella preparation for cryoelectron mi-
   One of the main challenges of CLEM is to accurately assign the      croscopy (cryo-EM). We show that the small size of the conju-
fluorescent label from FM to the corresponding feature in EM.          gate enables efficient endocytosis, whereas the high atomic
Retracing specific fluorescent cells or subcellular structures in      number of the gold colloids ensures good visibility in EM. Impor-
a large dataset requires reference points that must be easily          tantly, the bimodal nature of the tracer guarantees accurate
identifiable in both modalities. These can be naturally formed         registration of FM and EM data, by which endocytic compart-
landmarks, such as branching blood vessels and unique cell             ments containing multiple fluorescent gold colloids serve as fidu-
shapes (Karreman et al., 2016), artificial marks on the sample         cial landmarks. Finally, the uniform size of the gold particles en-
support (Polishchuk et al., 2000; Mu    €ller-Reichert et al., 2007;   sures excellent compatibility with immuno-EM (double) labeling
van Rijnsoever et al., 2008; Verkade, 2008), or the sample itself      strategies (Slot and Geuze, 1981). These benefits make fBSA-
(Vicidomini et al., 2008; Bishop et al., 2011; Bushby et al.,          Au a highly useful tool for 2D and 3D (cryo) CLEM applications.
2012; Karreman et al., 2016). These landmarks are simply too
big and do not provide the required registration accuracy to           RESULTS
correlate fluorescence signals to individual subcellular struc-
tures with nanometer precision. In addition, they may not always       fBSA-Au particles are stable and monodisperse
be present in quantities sufficient for accurate registration. For     As an electron-dense core of the bimodal probe, we chose
these applications, correlation is ideally achieved through artifi-    colloidal gold particles nominally sized at 5 or 10 nm because
cial fiducials (Roth et al., 1980; Powell et al., 1998; Kukulski       of their small size and high visibility in EM. The small size guaran-
et al., 2011; Watanabe et al., 2011; Kopek et al., 2012; Takizawa      tees efficient endocytosis, precise correlations, and compati-
et al., 2015; Fokkema et al., 2018). Fiducials are particles easily    bility with other immunoEM methods. Using the protocol devel-
visible in FM and EM that are small enough to not obscure              oped previously (Slot and Geuze, 1981, 1985), we synthesized
morphological details (12) months of storage at 4 C (Figure S1). These data
1984; Hanaki et al., 2003; Zhang and Hensel, 2013). BSA conju-         show that colloid gold particles can be functionalized with
gates to fluorophores or gold particles have been used in the          BSA-Alexa 555, after which the resulting conjugates remain
past for FM or EM approaches. These conjugates are highly              monodisperse, uniformly sized, and stable in solution.
visible and have no cytotoxicity, even after prolonged chase times
(Connor et al., 2005; Chithrani et al., 2006; Zhang and Hensel,        fBSA-Au is efficiently endocytosed and transported by
2013). We reasoned that fluorescently labeled BSA conjugated           the endosomal system
to electron-dense particles could function as an efficient fiducial    After characterization of the size and clustering behavior of the
for 3D CLEM, but no such probe is available to date.                   conjugates, we assessed the feasibility of fBSA-Au for cellular

2 Cell Reports Methods 2, 100220, May 23, 2022
ll
Article                                                                                                                                     OPEN ACCESS

Figure 1. Characterization of synthesized fBSA-Au conjugates
(A and B) Representative TEM micrographs of 5-nm colloidal gold, showing the monodisperse nature of the particles before (A) and after (B) BSA functionalization.
(C) DLS measurements showing the size distribution of 5-nm colloidal gold and BSA-Alexa555 functionalized particles. Functionalization causes a shift in size
distribution but does not induce larger aggregates.
(D and E) Representative TEM micrographs of 10-nm colloidal gold before (D) and after (E) BSA functionalization.
(F) DLS measurements showing the size distribution of 10-nm colloidal gold and BSA-Alexa555 functionalized particles. BSA functionalization causes a shifted
size distribution but does not induce larger aggregates.
(G) Representative schematic showing the relative sizes of BSA (7.1 nm), Alexa 555 (1.4 nm), and Au particles (5 nm).
(H) Sizing of Au5 and Au10 particles determined by TEM. Au5 and Au10 are homogeneously sized. Unlike in DLS measurements, the apparent size of the function-
alized particles does not increase after BSA functionalization, likely because of the poor visibility of the electron-lucent BSA.
Graphs depict mean ± SD Scale bars, 50 nm.

CLEM experiments. To be useful as an endocytic CLEM probe,                        does not colocalizing with these early or late endolysosomal
the probes should be non-toxic to cells, efficiently endocytosed,                 markers. The data show that fBSA-Au5 is efficiently taken up
and brightly fluorescent throughout the experiment.                               by cells and transported through the endolysosomal pathway,
   We first examined the uptake efficiency and localization of                    reaching early and late endocytic compartments.
internalized fBSA-Au5 using FM. After endocytosis, BSA conju-                        To examine whether fBSA-Au is compatible with application of
gates are predominantly targeted to the degradative path of                       commonly used endocytic markers, we incubated HeLa cells
the endosomal system, where they accumulate in late endo-                         with dextran 488 and fBSA-Au10 for 3 h (Makarow, 1985). After
somes and lysosomes (Pols et al., 2013; Jonker et al., 2018).                     incubation, cells were fixed and examined by FM. We performed
We incubated HeLa cells with fBSA-Au5 for 3 h to label the entire                 uptake experiments with 5- and 10-nm Au particles and
endosomal pathway, including lysosomes, the terminal com-                         observed no difference in their endocytosis and trafficking. We
partments of the endocytic route (Pols et al., 2013; Zhang and                    found that fBSA-Au10, like fBSA-Au5, is readily taken up, result-
Hensel, 2013). After uptake, cells were chemically fixed and im-                  ing in the appearance of brightly fluorescent spots (Figures 2E
munolabeled for EEA1 and LAMP-1 to mark early endosomal                           and 2F). Line profiling shows that the fluorescent signals of
and late endosomal/lysosomal compartments, respectively (Fig-                     dextran and fBSA-Au10 largely colocalized; on average, 80% of
ure 2A). The cells were imaged using FM, and colocalization                       dextran 488-positive spots also contained fBSA-Au10 (Fig-
between channels was analyzed using a spot detection-based                        ure 2G). This indicates that the fBSA-Au probe can be combined
colocalization plugin in Fiji (see STAR Methods for details). This                with generic endocytic markers and shows that both probes
showed that internalized fBSA-Au5 results in the appearance of                    follow the same endocytic route to lysosomes.
strongly fluorescent spots that colocalize with EEA1 and                             Finally, we examined whether the fBSA-Au probes can be
LAMP-1 (Figure 2B). Line profile (Figure 2C) and colocalization                   applied to live cell imaging, which requires bright and stable
analysis (Figure 2D) show that the majority of fBSA-Au5 colocal-                  probe fluorescence. After incubating cells for 3 h with fBSA-
izes with EEA1 and LAMP-1, and only a negligible part (3.8%)                      Au5, coverslips were imaged live with wide-field FM. This

                                                                                                      Cell Reports Methods 2, 100220, May 23, 2022 3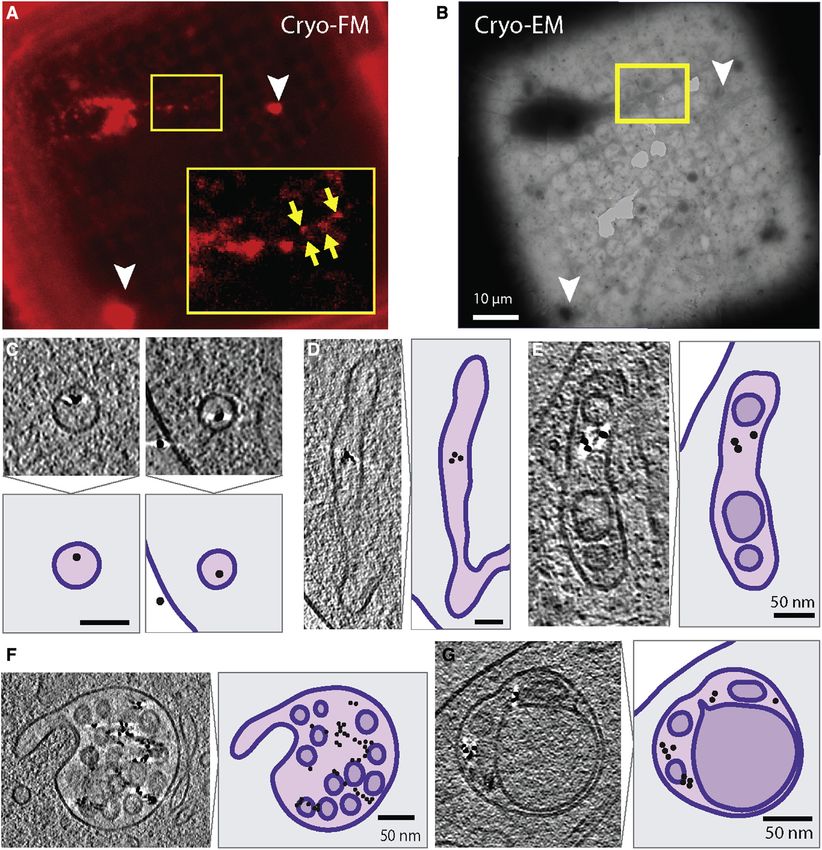
ll
      OPEN ACCESS                                                                                                                                   Article

Figure 2. fBSA-Au is a highly fluorescent, efficiently internalized endocytic tracer
(A) Fluorescence images of fixed HeLa cells incubated with fBSA-Au5 and immunolabeled for EEA1 and LAMP-1. fBSA-Au5 is visible in EEA1- and LAMP-1-pos-
itive compartments; i.e., throughout the endolysosomal system.
(B–D) Magnification of the white square in (A) (B), depicted line profile (C), and colocalization analysis (D) show that internalized fBSA-Au5 colocalizes with EEA1
and LAMP-1.
                                                                                                                                (legend continued on next page)

4 Cell Reports Methods 2, 100220, May 23, 2022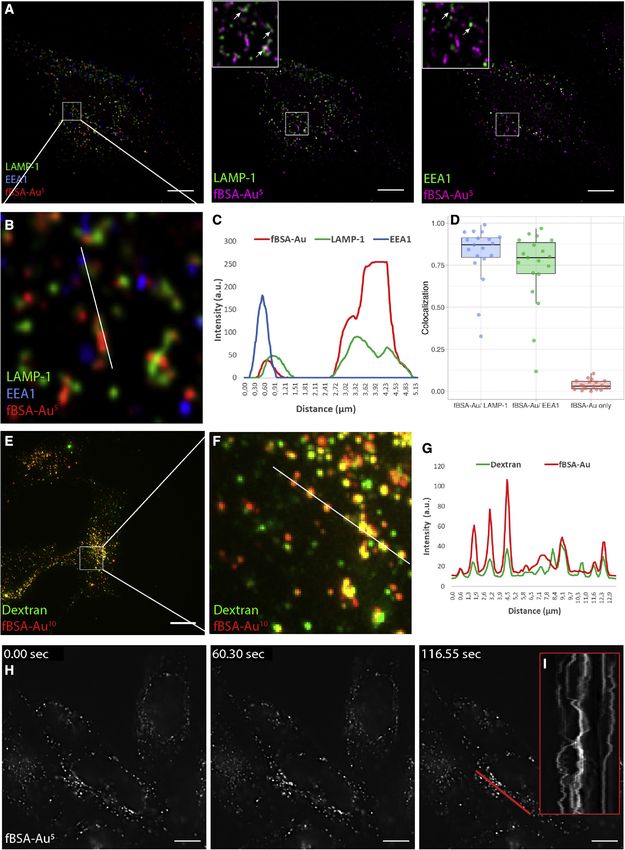
ll
Article                                                                                                                                  OPEN ACCESS

showed that fBSA-Au5-positive fluorescent spots actively                        and lysosomes identified in EM always contained Alexa 555 fluo-
moved in the cells (Figure 2I, kymograph along the red line)                    rescence when correlated back to the FM image (Figure 3D). This
and remained brightly fluorescent over 250 acquired frames dur-                 showed that fBSA-Au5 fluorescence precisely correlates with
ing live-cell imaging (Figure 2H; Video S1). We conclude that                   endosomal compartments containing Au5-positive compart-
fBSA-Au is an appropriate probe for FM studies, including live-                 ments visible by EM.
cell imaging. It is efficiently taken up by cells and distributed                  The intensity of the fBSA-Au5 fluorescent spots correlated well
throughout the endosomal pathway.                                               with the number of gold particles in a compartment; bright fluo-
                                                                                rescent spots correlated with compartments with large numbers
fBSA-Au is an efficient fiducial for 2D on-section CLEM                         of gold particles, whereas small but readily detectable fluores-
After validating endocytosis of fBSA-Au5 and fBSA-Au10, we                      cent spots correlated with individual particles or small clusters
tested the applicability of these conjugates for CLEM experi-                   of gold (Figure 3D). This fluorophore-gold correlation is possible
ments. First, we tested a 2D on-section CLEM setup using                        because the fluorescent and gold signals are from the same sec-
ultrathin Tokuyasu cryosections, the most sensitive method for                  tion, containing precisely the same number of fBSA-Au5 parti-
immuno-EM (van Rijnsoever et al., 2008; Vicidomini et al.,                      cles. To establish the resolution of the correlation approach,
2008, 2010; Mari et al., 2014). Because cryosections, in contrast               we selected the center of fBSA-Au5 fluorescence for a given
to resin sections, show no fluorescent background signal, and                   organelle on FM images and the center of the same organelle
epitopes are generally well preserved in this approach, they                    in EM images (Paul-Gilloteaux et al., 2017). By doing this, we
are uniquely suitable for imaging by FM and EM. CLEM applica-                   reached suborganelle accuracy registration. For example,
tions using cryosections often involve on-section labeling with a               manual picking of 15 pairs of FM and EM fBSA-Au5 signals fol-
fluorescently tagged antibody that is also marked by colloidal                  lowed by semi-automated correlation with a previously estab-
gold (Geuze et al., 1981; Oorschot et al., 2014). The fluorescence              lished correlation algorithm, ec-CLEM (Paul-Gilloteaux et al.,
signal obtained from ultrathin cryosections is limited by the thick-            2017; Figure S1), resulted in a registration accuracy between
ness of the sections, which is approximately 70 nm. Therefore,                  60 and 130 nm. This high accuracy of correlation also enabled
fBSA-Au5 fluorescence must be sufficiently intense to be used                   us to correlate organelles labeled for CD63 (arrows) but lacking
as fiducial in this approach.                                                   fBSA-Au5 (Figure 3D, panel 1). We also compared the correlation
   HeLa cells were incubated with fBSA-Au5 for 3 h, and then                    accuracy of FM and EM data of the GFP-LAMP-1 signal in high-
cells were prepared for cryosectioning and immunolabeling ac-                   pressure-frozen and HM20-embedded HeLa cells (Figure S3) in
cording to our well-established protocol (Geuze et al., 1981;                   ec-CLEM software, using fBSA-Au5 or the Hoechst signal and
Slot and Geuze, 2007). We chose to use fBSA-Au5 for these                       the edges of nuclei. We used 5 points each for registration with
and the following experiments because its small size enables                    the fBSA-Au and nucleus signal. Quantification of registration er-
easy distinction from commonly used 10- or 15-nm-sized immu-                    ror and comparing the accuracy of this limited set of points using
nogold labels. Ultrathin cryosections prepared from these HeLa                  ec-CLEM showed that accuracy ranged between 103 and
cells were immunolabeled with a primary monoclonal antibody                     226 nm for fBSA-Au particles and between 103 and 337 nm us-
against CD63, a marker for late endosomes and lysosomes,                        ing the nuclear signal.
followed by secondary Alexa 488-tagged antibody and 10-nm-                         These data show that the fBSA-Au5 probe correlates with
sized protein A-gold. By FM, we found that the Alexa 555                        100% efficiency between the FM and EM modalities and, by dis-
fluorophore of fBSA-Au5 withstood the preparation steps of                      tribution and intensity, can be reliably used as a fiducial marker to
cryosections, was preserved, and provided a detectable fluores-                 overlay FM onto EM images. Mapping the constellation of multi-
cent signal in the ultrathin cryosections after aldehyde fixation,              ple fBSA-Au-labeled compartments provides the resolution to
cryoprotection, and plunge freezing. The fBSA-Au5 signal was                    correlate fluorescently labeled structures that lack fBSA-Au,
clearly visible in 70-nm thin sections, where it frequently colocal-            which allows broad application of the probe to endolysosomal
ized with CD63 labeling (Figure 3A). We then selected regions of                as well as other structures.
interest (ROIs) for imaging in TEM and registered fBSA-Au5 fluo-
rescent spots to the EM ultrastructure (Figures 3B and 3C). We                  fBSA-Au is a suitable fiducial for 3D correlative FM-
performed an initial correlation based on recognizable features,                electron tomography
such as nuclei and cell shapes (Figures 3A and 3B), to find                     To extend application of fBSA-Au to 3D on-section CLEM, we
back our cells of interest. Then we used the fBSA-Au5 fiducials                 next made semi-thin (350-nm) cryosections and prepared
to zoom in and correlate subcellular structures in FM and EM.                   these for FM and electron tomography (ET). ET is a unique
We found that Alexa 555-labeled compartments in FM always                       tool to view 3D nanometer-scale details in the cellular
contained 5-nm gold (Figure 3D, arrowheads) upon EM inspec-                     context (Kremer et al., 1996). ET of semi-thin cryosections
tion. The reverse was also valid; gold-containing endosomes                     is a powerful approach for high-resolution 3D ultrastructural

(E) Fluorescence images of fixed HeLa cells incubated with fBSA-Au10 and dextran-Alexa 488.
(F and G) Magnification (F) and intensity profile (G) over the depicted lane show that fBSA-Au10 is readily endocytosed and largely colocalizes with dextran.
(H) Stills from Video S1 of live HeLa cells loaded with fBSA-Au5. fBSA-Au5 has sufficient fluorescence intensity to employ time-lapse experiments with high
temporal resolution.
(I) Kymograph over the indicated red line shows the x-t scan along the depicted red line.
Scale bars, 10 mm.

                                                                                                   Cell Reports Methods 2, 100220, May 23, 2022 5
ll
      OPEN ACCESS                                                                                                                              Article

Figure 3. CLEM of CD63-positive, fBSA-Au-containing compartments in HeLa cells
(A) FM image of an ultrathin cryosection. Shown is the region of interest (ROI) with CD63 immunolabeling (Alexa 488 and Au10) and Alexa 555 fluorescence of
internalized fBSA-Au5.
(B and C) EM of the ROI (B) and overlay of FM and EM images (C), showing high registration accuracy between modalities.
(D) High-magnification EM of fBSA-Au5 (arrowheads) containing organelles labeled for CD63 (10-nm gold, arrows). All selected compartments are positive for
CD63 (10-nm gold, arrows). Insets: magnification of CD63 and fBSA-Au5 fluorescence of the selected compartments; width of insets, 800 nm. The intensity of
fBSA-Au5 Alexa 555 fluorescence corresponds to the number of gold particles per compartment. (1) and (2) show late endosomes (LEs) containing many in-
traluminal vesicles and no (1) or little (2) fBSA-Au5 label. (3) shows a lysosome (LY) with clusters of fBSA-Au5 gold particles. (4) shows several LEs and LYs
containing varying levels of fBSA-Au5. (5) and (6) show LEs heavily loaded with fBSA-Au5 correlating with intense red fluorescence.
Scale bars, 2 mm (A–C) and 100 nm (D).

analysis of organelles (Zeuschner et al., 2006; Franke et al.,                  cles mostly remain at the section surface (Stierhof et al., 1986;
2019).                                                                          Stierhof and Schwarz, 1989). Hence, there is no direct correla-
   HeLa cells that were incubated for 3 h with fBSA-Au5 were                    tion between the intensities of FM and EM labeling of LAMP-
prepared as stated in the previous section, and then 350-nm                    1(Van E. et al., 2017).
cryosections were prepared. The sections were thawed and                           By FM, fBSA-Au5 was readily detected as distinct spots that
immunolabeled for the lysosomal marker LAMP-1, followed by                      partially colocalized with LAMP-1 (Figure 4A). The overall
secondary labeling with Alexa 488-tagged antibodies and                         fluorescence intensity of fBSA-Au5 was higher than in 70-nm cry-
10-nm-sized protein A-gold. In contrast to fBSA-Au5 added to                    osections (Figures 3 and 4), which corresponds to a higher num-
whole cells for internalization, antibody-based LAMP-1 labeling                 ber of fBSA-Au5 particles in the increased Z volume of 350 nm.
is applied to sections. The antibodies can penetrate cryosec-                   We then selected regions with fBSA-Au5 fluorescence for corre-
tions, as opposed to resin-embedded materials, but gold parti-                  lation with ET. ET image acquisition involves tilting of a sample

6 Cell Reports Methods 2, 100220, May 23, 2022
ll
Article                                                                                                                                     OPEN ACCESS

Figure 4. 3D CLEM of 350 nm cryosections using ET
HeLa cells were incubated with fBSA-Au5 fiducials (3 h) and immunogold labeled for LAMP-1 (10-nm gold).
(A) FM image of a 350-nm-thick cryosection with the selected ROI for ET highlighted by the white box. Insets show separate channels for the used fluorophores.
(B) EM of the same region shown in (A). At this magnification, clusters of endocytosed fBSA-Au5 gold particles are visible, allowing rapid correlation from FM to
EM. The ROI selected for ET is shown in the white box.
                                                                                                                             (legend continued on next page)

                                                                                                      Cell Reports Methods 2, 100220, May 23, 2022 7
ll
OPEN ACCESS Article
around 1 axis or 2 axes, and then a 3D reconstruction is gener- TEM or ET and correlated with the FM data. This type of correl-
ated based on back-projection algorithms (Kremer et al., ative approach is sensitive to distortions between FM and EM
1996). Because ET is generally only performed on a small ROI, datasets because staining, dehydration, and embedding steps
it is of particular importance to select the proper ROI for image are performed after FM imaging. 3D CLEM approaches (serial
acquisition. In semi-thin sections, the increased thickness sectioning and/or ET) introduce an additional level of challenge
causes more scattering of electrons and obscures visibility of in the z dimension because of the disparity in axial resolution be-
structures by 2D TEM, which hampers selection of ROIs. The tween FM and EM. We reasoned that fBSA-Au fiducials,
electron-dense gold particles of fBSA-Au5 were very well visible because of their unique 3D distribution, would significantly
by 2D TEM, which greatly facilitating selection of an ROI. After ease such 3D CLEM correlations and tested this by making
identifying the proper ROIs, tilt images were collected by ET ETs of serial semi-thick sections.
(Figures 4B–4D), in which individual organelles were registered HeLa cells grown on patterned glass coverslips were incu-
from FM to 3D EM. The correlation accuracy of this approach bated for 3 h with fBSA-Au5, fixed, and imaged using FM. Cells
ranged between 60 and 200 nm, as determined using ec- were recorded relative to the pattern on the coverslips to facili-
CLEM, which is at the same level as for 2D CLEM. These data tate successive X-Y correlation to EM (Polishchuk et al., 2000),
show that, in semi-thin sections, the fBSA-Au5 probe can be as commonly used in volume-CLEM applications (Russell
used at the mesoscale—to find back cells and ROIs—and at et al., 2016; Fermie et al., 2018). The volume-CLEM approach
the nanometer level—to correlate individual organelles. is outlined in Figure 5A. A fluorescent z stack of the cell with
After tomogram reconstruction, we examined the morphology 200-nm intervals was collected. The sample was contrasted
of the correlated structures. ROI 1 (Figures 4C–4F) showed a with heavy metals and embedded in epoxy resin, and then
collection of fBSA-Au5 particles present in a late endosome 250-nm serial sections were collected for EM. Using the fluores-
and a lysosome. Multiple virtual slices through the lysosome cent z stack, the 250-nm EM section bearing the organelles of
showed that fBSA-Au5 is evenly distributed throughout the interest was estimated, imaged, and correlated with the FM
organelle (Figure 4G). ROI 2 contained a large, LAMP-1-positive data. Figure 5 shows a differential interference contrast (DIC)
organelle negative for fBSA-Au5. The corresponding ET image image from a selected cell (Figure 5B) overlayed with the fluores-
shows only sparse LAMP-1 gold-labeling on the section surface. cence max intensity projection from endocytosed fBSA-Au5
Thus, despite the absence of fBSA-Au5 and sparse immunogold (Figures 5B and 5C) and a low-magnification overview of the cor-
labeling, these organelles could be marked as LAMP-1 positive, responding 250-nm EM section (Figure 5D). We selected perinu-
as detected by FM labeling registered to EM. These data show clear regions for FM-EM correlation because these are relatively
that the intensity of the FM signal and the accuracy of the corre- thick and best demonstrate the 3D cellular distribution of endo-
lation procedure overcomes the need to label fluorescently cytosed fBSA-Au5. We used the information from the FM z stack
tagged antibodies with an additional gold tag (van der Beek to assess the distance between an ROI and the bottom of the
et al., 2022). ROI 3 showed a typical lysosome containing ample coverslip. This guided us to select the correct section to acquire
fBSA-Au5 particles. The 5-nm gold particles are visible high-resolution tomograms of the fBSA-Au5 containing compart-
throughout the volume of the tomograms (Figures 4F and 4G) ments (the method is outlined in Figure 5A).
because of internalization of fBSA-Au5 prior to fixation. The intra- In the tomograms, we could easily distinguish the individual
cellular 3D distribution of fBSA-Au5 allowed correlation of struc- organelles selected in FM (Figures 5E and 5F). Similar to the
tures throughout the section (Figure 4G), which is an important previous examples, the correlation accuracy of this approach
improvement over fiducials that reside on the surface of ranged between 60 and 200 nm in 2D (determined using ec-
sections. CLEM) and was limited by the EM section thickness (250 nm)
in z. Most fluorescent spots correlated by ET were endolysoso-
fBSA-Au as an endocytic fiducial for correlative live-FM mal compartments containing clusters of gold particles
and ET of resin-embedded cells (Figures 5G and 5H). We also found faint fluorescent spots that
Many CLEM approaches use resin embedding for EM. In these correlated with endosomal organelles containing only a few
applications, the flow of experiments generally involves gold particles (Figure 5H, organelle 3). This highlights the strong
recording of fluorescence signals in live or fixed 3D samples signal of the fBSA-Au5 probe. We conclude that endocytosed
(i.e., not sections as above), after which the sample is infil- fBSA-Au is highly suitable for resin-based 3D CLEM approaches,
trated/stained with heavy metals for increased EM contrast first by providing the information required to select the correct Z
and embedded in epoxy or acrylic resin. Then (serial) ultrathin layer for ET imaging and second by using fBSA-Au as fiducial
or semi-thin sections are made, which are collected for (serial) marker to provide high correlation accuracy in 3D.
(C) Magnified crop from (A), showing the ROI selected for ET. Numbers refer to the same spots as shown in (E) and (F).
(D) Magnification of the ROI with the fluorescence information overlaid. fBSA-Au5 fluorescence strictly corresponds to fBSA-Au5 gold particles.
(E) Virtual slice from the tomogram, highlighting selected organelles.
(F) Magnification of selected organelles. (1) shows LEs and LYs with large amounts of fBSA-Au5 gold particles (white arrows) and minimal LAMP-1 labeling (white
arrowheads). (2) shows a LAMP-1-labeled LY devoid of endocytosed fBSA-Au5. This slice is from the surface of the section, showing LAMP-1 representing gold
particles that do not penetrate the section. (3) shows LAMP-1-labeled LY abundantly filled with endocytosed fBSA-Au5 gold.
(G) Virtual sections through the LY shown in (1) of (F), showing distribution of gold throughout the compartment.
Scale bars: 2 mm (A and B), 500 nm (C–E), 200 nm (F), and 100 nm (G).
8 Cell Reports Methods 2, 100220, May 23, 2022ll
Article OPEN ACCESS
Figure 5. fBSA-Au serves as a bimodal endocytic probe for CLEM using pre-embedding fluorescence and resin sections
HeLa cells were incubated for 3 h with fBSA-Au5.
(A) Schematic of the imaging strategy employed. A fluorescent z stack with 200-nm intervals is collected after fixation but prior to resin embedding. After resin
embedding, 250-nm-thick sections were cut for ET. The depth (z plane) bearing the organelles of interest was estimated based on the fluorescent z stack, and the
corresponding section was imaged in ET.
(legend continued on next page)
Cell Reports Methods 2, 100220, May 23, 2022 9ll
OPEN ACCESS Article
fBSA-Au as a fiducial marker to mark endolysosomes for pared to enable cryo-ET imaging (Rigort et al., 2012). For this
cryo-ET procedure, cryo-preserved cells are milled in a cryo-FIB-SEM
Cellular cryo-ET is an emerging technique for determining the 3D to create lamellae suitable for cryo-ET imaging. Cryo-FIB milling
structures of molecules with subnanometer resolution (Beck and is the most effective thinning method to date, but imaging of spe-
Baumeister, 2016). Vitrification of cells keeps molecules in their cific biomolecular processes requires localization of ROIs that
near native state, and cryo-ET provides high resolution in situ im- measure 1 mm laterally and 200–300 nm in z in larger cells.
ages of molecules in the context of the cell. However, the lack of Especially for rare cellular events or structures, there is no routine
efficient labels for cryo-ET and the low level of contrast makes it method assuring that the structure of interest is present in the
challenging to select subcellular ROIs for cryo-ET image acqui- prepared lamella. Cryo-FM is used to identify an ROI for cryo-
sition (Arnold et al., 2016; Schorb et al., 2017). Cryo-FM ET. In general, fluorescently labeled cells (e.g., expressing a
screening prior to cryo-ET is a promising way for identification GFP-tagged protein) are cultured on TEM grids, vitrified, imaged
of ROIs, which can then be re-located and targeted for imaging by cryo-FM, and transferred to a cryo-FIB-SEM, where the posi-
by cryo-ET (Sun et al., 2019). We postulated that fBSA-Au would tion for lamellae milling is selected in the x-y plane (laterally)
be a highly suitable tool to mark endolysosomal organelles by based on the cryo-FM data, and the z position (axially) is esti-
cryo-FM and serve as tool to pre-identify and select regions to mated to the best accuracy allowed by the FM data. When pro-
collect tomograms by cryo-ET. cessed, the lamellae are transferred for cryo-TEM imaging. This
For these experiments, we used cultured differentiated neu- approach maximizes targeting of the intended ROI and reduces
rons (dorsal root ganglion [DRG] neurons) because the less imaging of areas that do not contain structures of interest (Arnold
than 500-nm thin axonal projections (transparent for the electron et al., 2016; Gorelick et al., 2019), increasing the success rate of
beam) allow direct cryo-ET without the need to prepare lamella the method while reducing beamtime. Fiducial markers with a
(Foster et al., 2021) (Figure 6). We incubated DRGs for 2 h with homogeneous 3D distribution throughout the intracellular vol-
fBSA-Au5 and then performed the required washing and vitrifica- ume are a highly powerful tool to mark ROIs for cryo-ET. Hence,
tion steps (see STAR Methods for the detailed procedure). By as a final application, we here test the performance of fBSA-Au in
cryo-FM, the red fluorescence of fBSA-Au5 was visible in a thin a cryo-ET CLEM workflow, using the fBSA-Au fiducial particles
region of the axon as a collection of small fBSA-Au5 puncta to target lamella preparation and identify targets in the prepared
(Figures 6A and 6B, yellow insets and arrows). There were also lamellae.
some bright fluorescent patches on the empty grid surface (white Human bone osteosarcoma epithelial (U2OS) cells were
arrowheads in Figure 6A), which likely correspond to clusters of cultured on TEM grids treated with Dynabeads (1-mm-sized,
fBSA-Au5 adhering to the laminin coat required for neuronal traditionally used fiducials), incubated with fBSA-Au5 particles
growth because no such patches were observed on glass or un- for 3 h, and vitrified. A fluorescent z stack showing the position
coated or fibronectin-coated grids. We then used the presence of the Dynabeads (green channel) and fBSA-Au5 particles (red
of axonal fBSA-Au5 labeling to navigate to the axonal regions channel) was collected in a spinning-disk FM equipped with a
using TEM and collect cryo-ET data. The reconstructed tomo- cryo-module (see Video S5 for the z stack of the cell shown in
grams of similar ROIs showed various endolysosomal compart- Figure 7). A maximum-intensity projection of the fBSA-Au5 parti-
ments of which approximately half contained fBSA-Au5. The high cles present in the z stack is shown in Figure 7A. After 3D cryo-
contrast of the fBSA-Au particles allowed their unambiguous FM imaging, the grids were loaded into the cryo-FIB-SEM. First,
identification using cryo-ET. The gold appeared as single parti- the FM and SEM overview images were correlated by the distri-
cles in small vesicles (Figure 6C; Video S2), tubules, and early bution of the Dynabeads, providing the x-y-z alignment prior to
endosomes (Figures 6D and 6E) and was more clustered in later milling (Figure 7B). Then, using the fluorescent z stack from the
endolysosomal organelles (Figures 6F and 6G; Videos S3 and fBSA-Au5 particles (Figure 7D), a lamella (z) position was
S4). These data show that endocytosed fBSA-Au is visible in selected and prepared as described previously (Wagner et al.,
cryo-FM and cryo-ET and can be applied to mark ROIs for imag- 2020). The SEM image of the prepared lamella is shown in Fig-
ing by cryo-ET. ure 7C, overlaid with the fluorescence of the fBSA-Au5 particles.
The prepared lamella was then transferred and imaged using
fBSA-Au as a fiducial marker for lamella preparation for 200-kV cryo-EM. The lamella overview images from cryo-EM
cryo-ET were correlated with the cryo-FM data showing the localization
Unlike axons, most biological samples are too thick to perform of the fBSA-Au5 particles (overlay shown in Figure 7E). We
direct cryo-ET. Instead, 100- to 200-nm lamellae need to be pre- then recorded high-magnification images (Figures 7G and 7H)
(B) DIC image of a cell with fluorescence of fBSA-Au5 overlayed in red.
(C) Fluorescence signal of fBSA-Au5 shown in (A). The ROI for CLEM is highlighted with a white box.
(D) TEM micrograph of a 250-nm-thick section showing the ROIs from (B) and (C). The ROI for ET is indicated by the dashed white box.
(E) Fluorescence signal corresponding to the ET ROI with numbered spots of interest.
(F) Virtual slice from the tomogram, overlaid with fluorescence data.
(G) Virtual slice from the tomogram, showing the 3 selected organelles.
(H) Magnified virtual slices of the selected organelles containing fBSA-Au5, visible by the 5-nm gold particles (arrows). Organelles 1 and 2 are late endolysosomes,
and organelle 3 is an LE.
Scale bars: 10 mm (B and C), 2 mm (D), 500 nm (E–G), and 100 nm (H).
10 Cell Reports Methods 2, 100220, May 23, 2022ll
Article OPEN ACCESS
Figure 6. fBSA-Au as a bimodal endocytic probe for cryo-ET
(A and B) Cryo-FM (A) and cryo-EM (B) images of neurons grown on EM grids. The red signal in cryo-FM originates from the Alexa 555 groups of fBSA-Au5. Yellow
arrows point to less intense fluorescent spots corresponding to small endolysosomal organelles in the thin parts of axons. White arrowheads point to dense
clusters of fBSA-Au5 adhering to the laminin-coated grid.
(C) Small vesicles in cryo-ETs of DRG neurons containing fBSA-Au5 gold particles. A model for each example is shown below, with the lipid bilayer shown in
purple, the vesicle lumen in light pink, and fBSA-Au5 as a black circle. The neuron cytoplasm is shown in gray, and the region outside of the cell is white.
(D and E) As in (C) for tubular structures (D) and as in (C) and (D) for an early endosome (E). The lumen of the internal vesicle is shown in light purple.
(F) As in (C) and (E) for a multi-vesicular body.
(G) As in (F) and (C) for an LE/LY.
Scale bars, 10 mm (A and B) and 50 mm (C–G).
of the correlated organelles (indicated with green and blue the tomogram (Video S6, corresponding to the red arrow in
squares in Figures 7E and 7F), showing endocytosed fBSA-Au5 Figure 7).
particles in late endosomes and lysosomes. The correlation ac- These data show that endocytosed fBSA-Au can be used as a
curacy between cryo-FM and cryo-EM was approximately 3D fiducial marker in a cryo-CLEM workflow. The 3D distribution
100 nm (defined by the organelle size). We managed to follow of the particles in the endolysosomal system makes them very
a single fluorescent compartment (indicated by a red arrow) suitable to select regions for lamella preparation based on
throughout the complete cryo-CLEM procedure and recorded the cryo-FM signal. The strong contrast of the particles in
Cell Reports Methods 2, 100220, May 23, 2022 11ll
OPEN ACCESS Article
Figure 7. fBSA-Au as a fiducial marker for cryo-CLEM
(A) Red channel maximum intensity projection of the cryo-FM z stack of the selected U2OS cell. The red signal in cryo-FM originates from the Alexa 555 groups of
fBSA-Au5.
(B) Green channel cryo-FM image (Dynabeads) overlayed onto the SEM overview.
(C) Magnified cryo-FM image of the ROI, showing the organelles bearing fBSA-Au5 selected for lamella preparation. The ROI is also depicted with a white square
in (A).
(D) Post-milling SEM image of the prepared lamella overlayed with the corresponding individual z stack image of the FM data.
(E) Overlay of the cryo-FM signal of fBSA-Au5 in the corresponding organelles in the lamella and cryo-TEM images.
(F) Overview cryo-TEM image of the lamella. Organelles imaged with higher resolution are depicted with green and blue squares and are shown in (G) and (H),
respectively.
(G) A LY bearing fBSA-Au5 in its lumen.
(H) Another LY bearing fBSA-Au5. A model for each organelle is shown as an inset, with the lipid bilayer shown in purple, the lumen in light pink, and fBSA-Au5 as
black circles.
Scale bars: 15 mm (B and D), 500 nm (E and F), and 100 nm (G and H).
12 Cell Reports Methods 2, 100220, May 23, 2022ll
Article OPEN ACCESS
cryo-TEM makes their visualization easy and increases the accu- Previously, we and others introduced fluorescently labeled sil-
racy in tomogram reconstruction to visualize fine structural ele- ica nanoparticles as bimodal endocytic tracers and fiducials for
ments. For example, reconstructions of fBSA-Au5 endosomes FM and EM (Zhang and Hensel, 2013; Fokkema et al., 2018).
readily show contact sites between endosomes and the cyto- These particles provide easy correlation and perform well as
skeleton (Figure S4; Video S7). extracellular fiducials for CLEM. Their distinct shape with a
well-defined gold core also enables a Gaussian fitting step to
DISCUSSION obtain better precision between single particles and fluores-
cence. However, their relatively large size (100 nm) limits the ef-
Here, we introduce fBSA-Au, a conjugate of Alexa Fluor-labeled ficiency of endocytosis and may obscure morphological features
BSA and 5- or 10-nm sized colloidal gold particles and describe in endosomes, hampering their ultrastructural identification. The
its application as a bimodal endocytic probe and 3D fiducial fBSA-Au probe presented here is significantly smaller (5- to
marker. Endocytic markers are an attractive solution for correla- 15-nm diameter versus 60–100 nm for silica particles), which
tive fiducials because they efficiently distribute throughout cells, allows higher levels of endocytosis while the visibility of morpho-
resulting in a well-defined 3D pattern of landmarks usable for logical features in endosomes is retained. Quantum dots (Giep-
correlation. We demonstrate that fBSA-Au5 and fBSA-Au10 are mans et al., 2005; Peckys et al., 2014; Liv et al., 2015) and nano-
stable in solution, efficiently endocytosed, non-toxic, and diamonds (Han et al., 2019; Prabhakar et al., 2020) are another
brightly fluorescent and have good electron contrast for detec- type of bimodal nanoparticles used in cell biology and CLEM ap-
tion in TEM. The probe is versatile because it can be synthesized proaches. Like fBSA-Au, they can be functionalized with physio-
with differently sized gold particles and distinct fluorophores. We logically relevant molecules and are small in size (5–30 nm).
successfully generated fBSA-Au5 and fBSA-Au10 particles with However, their lower electron density makes them poorly visible
Alexa 488, Alexa 555, Alexa 647, Texas red, and tetramethylr- in electron micrographs, in contrast to the excellent EM visibility
hodamine (TRITC) fluorophores. We show that endocytosed of fBSA-Au. Quantum dots remain invisible in cryosections
fBSA-Au is taken up effectively by cells, colocalizes with markers because of the negative contrasting protocol.
of early and late endosomal compartments (EEA1, CD63, and A limitation in development of bimodal fiducials is that fluoro-
LAMP1), and reaches the same population of organelles as es- phores can be quenched when they are in close proximity to
tablished endocytic tracers, such as dextran or fluorescent BSA. colloidal heavy metal particles (Kandela et al., 2003; Kandela
The properties of fBSA-Au render it broadly applicable for 2D and Albrecht, 2007; Miles et al., 2017). Usually, spacers are
and 3D CLEM and compatible with resin EM, cryosectioning, incorporated to prevent this quenching, especially when larger-
and cryo-EM approaches. We show that fBSA-Au provides sized metal particles are used, but these probes still suffer
ample fluorescence signal for imaging in intact cells under live from a limited fluorescence signal. Because of the synthesis
and fixed conditions because of build-up of multiple fBSA-Au strategy of fBSA-Au, where Alexa-labeled BSA proteins are
particles in the confined space of endosomes and lysosomes. bound to colloidal gold particles, we achieved a high fluores-
In addition, fBSA-Au is readily detectable even in FM of ultrathin cence signal despite using relatively large gold particles. In our
(70 nm) Tokuyasu cryosections. The high electron contrast and case, the bulk of the BSA molecules provides enough space be-
uniformly sized gold particles make them easily visible in TEM tween the gold and the fluorophores to retain sufficient fluores-
and provide reliable reference points to correlate data from FM cence. Commercially available BSA-Alexa 555 is labeled with
and EM in 2D and 3D. Because the gold particles in fBSA-Au Alexa 555 at a 5:1 molar density (5 mol of dye per 1 mol protein).
are of well-defined size, their use is compatible with immunogold This high labeling density combined with the bulk of BSA should
labeling, which is especially valuable when using cryosection provide a sufficiently large fraction of unquenched fluorophores
CLEM. We demonstrated use of fBSA-Au in TEM-based visible in FM.
CLEM, but we envision that fBSA-Au is also compatible with One of the challenges with bimodal probes is to ensure coloc-
SEM-based CLEM approaches, using 3D EM techniques like alization of the fluorescence signal and the electron-dense par-
FIB-SEM, serial blockface (SBF) SEM, and array tomography. ticle (Van E. et al., 2017; Miles et al., 2017). For fBSA-Au5, the
SEM-based 3D methods enable examination of larger volumes challenge primarily lies in degradation of BSA as it is transported
than ET but with less resolution (Peddie and Collinson, 2014), to lysosomes, the enzymatically active endpoint of the endocytic
which likely necessitates use of fBSA-Au10. The excellent visibil- pathway. Degradation of BSA will lead to a dissociation of the
ity in EM ensures compatibility with current and future auto- Alexa label and gold particles, which may lead to labeling dis-
mated CLEM procedures and registration software (Sjollema crepancies in correlative approaches. In previous studies,
and Giepmans, 2016; Paul-Gilloteaux et al., 2017; Mohamma- degradation of BSA was seen by aggregation and clustering of
dian et al., 2019). Combining the uncompromised FM and EM gold particles in lysosomes (Bright et al., 1997; Pols et al.,
properties, we found that the probe enables easy registration 2013). Similar clustering was observed in lysosomes in the
of CLEM data in 2D and 3D applications. The applicability also experiments here, indicating degradation of BSA-Alexa 555 (Fig-
extends to live-cell CLEM approaches because the endocytosed ures 3 and 4). Our CLEM experiments show no labeling discrep-
fiducials are visible during every step of correlative imaging, all ancies between FM and EM; gold particles were seen in every
the way from live cells to the final tomograms (Figures 2 and fluorescently labeled compartment, and, vice versa, fluores-
7). Bimodal nanoparticles are a useful tool in cell biology, either cence was detected in all compartments containing gold col-
as bimodal fiducial for CLEM or as an endocytic probe to mark loids. This overlap confirms that, at least within a period of 3 h
endolysosomal organelles. of uptake, the localization and fluorescence of the Alexa dye is
Cell Reports Methods 2, 100220, May 23, 2022 13ll
OPEN ACCESS Article
retained in endocytic compartments, even after degradation of STAR+METHODS
BSA, and throughout the process of fixation, sectioning, and
labeling. Detailed methods are provided in the online version of this paper
In cryo-EM, accurate selection of ROIs for cryo-ET is of and include the following:
extreme importance because of the fragile nature of frozen hy-
drated material (Villa et al., 2013). Use of fluorescence to deter- d KEY RESOURCES TABLE
mine ROIs prior to imaging is rapidly gaining traction thanks to d RESOURCE AVAILABILITY
maturing cryo-FM setups (Schwartz et al., 2007; van Driel B Lead contact
et al., 2009; Schellenberger et al., 2013; Kaufmann et al., B Materials availability
B Data and code availability
2014b). Fluorophores generally retain their fluorescence and
exhibit reduced bleaching at cryogenic temperatures (Weisen- d EXPERIMENTAL MODEL AND SUBJECT DETAILS
burger et al., 2013; Kaufmann et al., 2014a, 2014b). We have B Cell lines and culture
shown that fBSA-Au is compatible with cryo-FM and cryo-EM d METHOD DETAILS
5 10
B fBSA-Au and fBSA-Au complex synthesis
of vitrified material. By using the 3D distribution of endocytosed
fBSA-Au, we can select ROIs by cryo-FM, use this fluorescence B Immunofluorescence labelling and imaging of endocy-
to identify where to make lamella in the cryo-FIB-SEM, and tosed fBSA-Au
B Correlative microscopy of resin-embedded samples
locate the targeted organelles within the lamella during subse-
quent imaging with cryo-ET. fBSA-Au can be a highly suitable B Sample preparation and light microscopic imaging of
fiducial marker, especially in integrated FM in FIB-SEM systems, Tokuyasu cryosections
B Electron microscopy of resin sections and Tokuyasu
where the ROI (e.g., lamella) identified by FM can be directly pre-
pared for cryo-ET (Smeets, 2020; Timmermans et al., 2016; Log- cryosections
inov et al., 2022). An additional benefit of endocytosed nanogold B Cryo-FM and Cryo-EM of DRG neurons
B Cryo-FM and Cryo-EM of U2OS cells
fiducials for cryo-ET is accurate tracking during tilt series acqui-
B Tomogram reconstruction
sition and improved tilt-series alignment for image reconstruc-
tion, as reported by others (Berger et al., 2021). B Correlation of light and electron microscopy images
We conclude that fBSA-Au is a powerful and easy-to-use 3D d QUANTIFICATION AND STATISTICAL ANALYSIS
5 10
B Size distribution analysis of fBSA-Au and fBSA-Au
fiducial marker that can be used in an array of CLEM applications
because it is stable, efficiently endocytosed, and compatible B Colocalization analysis
B Correlation accuracy of FM and EM images
with a variety of established FM and EM techniques. fBSA-Au
provides high correlation accuracy in 2D and 3D CLEM applica-
tions and is especially suited to address questions at the subcel- SUPPLEMENTAL INFORMATION
lular level requiring high correlation efficiency.
Supplemental information can be found online at https://doi.org/10.1016/j.
crmeth.2022.100220.
Limitations of the study
The examples provided here show CLEM of endolysosomal
organelles, but the bimodal visibility of fBSA-Au is also highly ACKNOWLEDGMENTS
usable for CLEM studies of other cellular structures. Endo-
We acknowledge funding from the Netherlands Organisation for Scientific
somes containing fBSA-Au can be used as 3D reference
Research (NWO), Stichting voor de Technische Wetenschappen (Technol-
points with a unique spatial distribution to register FM data ogy Foundation STW), grant 12715 (to H.G. and J.K.) and the Netherlands
from other structures of interest beyond the endolysosomal Organisation for Health Research and Development (ZonMW) grant
system to their corresponding ultrastructure with a correlation 40-00812-98-16006 (to J.K.). The microscopy infrastructure in this work
precision comparable with organelles bearing fBSA-Au parti- is partially subsidized by the Roadmap for Large-Scale Research Infra-
cles (Figures 3 and 4). Because nearly all cell types show a structure (NEMI) of Netherlands Organisation for Scientific Research (grant
number 184.034.014) (to J.K.). The Cell Microscopy Core of UMC Utrecht is
significant level of endocytosis, with the exception of
part of the Dutch Correlative Light Electron Microscopy node of
erythrocytes, use of endocytosed fBSA-Au is widely appli-
EuroBioImaging.
cable to a large variety of cellular and tissue models. In
cryo-ET applications, a possible limitation can arise from the
AUTHOR CONTRIBUTIONS
weak phase approximation expected from tomogram recon-
struction, where the averaging of structures close to the N.L., J.F., G.P., H.C.G., and J.K. designed the study. G.P. conceived the
dark Au particles can be perturbed. However, this is only rele- bimodal probes. T.V., V.O., and S.v.D. synthesized, optimized, and character-
vant for averaging structures in the endolysosomal lumen, ized the endocytic fiducials. J.F., T.V., L.Y., and C.d.H. optimized the cellular
where the Au particles are localized. Imaging closer to focus uptake and imaging of endocytic fiducials and analyzed the data with N.L.
and minimizing the non-suitable area with a dense Au particle J.F. performed 2D on-section CLEM and 3D correlative FM-ET studies.
H.E.F. performed cryo-ET experiments with neurons. L.d.J. and S.H. per-
presence would be a solution. Finally, in CLEM applications
formed cryo-CLEM experiments of U2OS cells. J.F., L.d.J., and H.E.F. per-
where EM does not provide enough resolution to visualize
formed image correlation and segmentation and prepared the corresponding
5-nm or 10-nm Au particles, bigger fiducial probes, like the figures with N.L. W.H.M., W.L., S.H., A.P.C., F.F., H.C.G., J.K., and N.L. super-
fluorescently labeled silica nanoparticles we have reported vised the study. J.F. and N.L. wrote the paper with input from all authors. All
previously (Fokkema et al., 2018), might be preferable. authors reviewed the manuscript.
14 Cell Reports Methods 2, 100220, May 23, 2022ll
Article OPEN ACCESS
DECLARATION OF INTERESTS Foster, H.E., Ventura Santos, C., and Carter, A.P. (2022). A cryo-ET survey of
microtubules and intracellular compartments in mammalian axons. J. Cell Biol.
The endocytic fBSA-Au5 and fBSA-Au10 fiducials reported here are available in 221. https://doi.org/10.1083/jcb.202103154.
the product listing of Cell Microscopy Core, UMC Utrecht. Franke, C., Repnik, U., Segeletz, S., Brouilly, N., Kalaidzidis, Y., Verbavatz, J.,
and Zerial, M. (2019). Correlative single-molecule localization microscopy and
Received: May 16, 2021 electron tomography reveals endosome nanoscale domains. Traffic 20,
Revised: February 4, 2022 601–617. https://doi.org/10.1111/tra.12671.
Accepted: April 26, 2022
Gaietta, G.M., Deerinck, T.J., and Ellisman, M.H. (2011). Labeling tetracys-
Published: May 16, 2022
teine-tagged proteins with biarsenical dyes for live cell imaging. Cold Spring
Harb. Protoc. 2011, pdb.prot5547–47. https://doi.org/10.1101/pdb.prot5547.
REFERENCES Geoffroy, J.S., and Becker, R.P. (1984). Endocytosis by endothelial phago-
cytes: uptake of bovine serum albumin-gold conjugates in bone marrow.
Arnold, J., Mahamid, J., Lucic, V., de Marco, A., Fernandez, J.J., Laugks, T., J. Ultrasruct. Res. 89, 223–239. https://doi.org/10.1016/S0022-5320(84)
Mayer, T., Hyman, A., Baumeister, W., and Plitzko, J. (2016). Site-specific 80039-8.
cryo-focused ion beam sample preparation guided by 3D correlative micro- Geuze, H.J., Slot, J.W., van der Ley, P.A., and Scheffer, R.C. (1981). Use of
scopy. Biophys. J. 110, 860–869. https://doi.org/10.1016/j.bpj.2015.10.053. colloidal gold particles in double-labeling immunoelectron microscopy of ul-
Beck, M., and Baumeister, W. (2016). Cryo-electron tomography: can it reveal trathin frozen tissue sections. J. Cell Biol. 89, 653–665. http://www.ncbi.nlm.
the molecular sociology of cells in atomic detail? Trends Cell Biol., 825–837. nih.gov/pubmed/6166621.
https://doi.org/10.1016/j.tcb.2016.08.006. Giepmans, B.N.G., Deerinck, T.J., Smarr, B.L., Jones, Y.Z., and Ellisman, M.H.
Berger, C., Ravelli, Raimond B.G., López-Iglesias, C., and Peters, P.J. (2021). (2005). Correlated light and electron microscopic imaging of multiple endoge-
Endocytosed nanogold fiducials for improved in-situ cryo–electron tomogra- nous proteins using Quantum dots. Nat. Methods 2, 743–749. https://doi.org/
phy tilt-series alignment. J. Struct. Biol. 213, 107698. https://doi.org/10. 10.1038/nmeth791.
1016/j.jsb.2021.107698. Gorelick, S., Buckley, G., Gervinskas, G., Johnson, T.K., Handley, A., Cag-
Bishop, D., Nikic, I., Brinkoetter, M., Knecht, S., Potz, S., Kerschensteiner, M., giano, M.P., Whisstock, J.C., Pocock, R., and de Marco, A. (2019). PIE-scope,
and Misgeld, T. (2011). Near-infrared branding efficiently correlates light and integrated cryo-correlative light and FIB/SEM microscopy. eLife 8. https://doi.
electron microscopy. Nat. Methods 8, 568–570. https://doi.org/10.1038/ org/10.7554/eLife.45919.
nmeth.1622. Hagen, W.J.H., Wan, W., and Briggs, J.A.G. (2017). Implementation of a cryo-
Bright, N.A., Reaves, B., Mullock, B., and Luzio, J. (1997). Dense core lyso- electron tomography tilt-scheme optimized for high resolution subtomogram
somes can fuse with late endosomes and are re-formed from the resultant averaging. J. Struct. Biol. 197, 191–198. https://doi.org/10.1016/j.jsb.2016.
hybrid organelles. J. Cell Sci. 110, 2027–2040. https://doi.org/10.1242/jcs. 06.007.
110.17.2027. Han, S., Raabe, M., Hodgson, L., Mantell, J., Verkade, P., Lasser, T., Land-
fester, K., Weil, T., and Lieberwirth, I. (2019). High-contrast imaging of nano-
Bushby, A.J., Mariggi, G., Armer, H.E., and Collinson, L.M. (2012). Correlative
diamonds in cells by energy filtered and correlative light-electron microscopy:
light and volume electron microscopy. Methods Cell Biol. 111, 357–382.
toward a quantitative nanoparticle-cell analysis. Nano Lett. 19, 2178–2185.
https://doi.org/10.1016/B978-0-12-416026-2.00018-2.
https://doi.org/10.1021/acs.nanolett.9b00752.
Chithrani, B.D., Ghazani, A.A., and Chan, W.C.W. (2006). Determining the size
Hanaki, K.I., Momo, A., Oku, T., Komoto, A., Maenosono, S., Yamaguchi, Y.,
and shape dependence of gold nanoparticle uptake into mammalian cells.
and Yamamoto, K. (2003). Semiconductor quantum dot/albumin complex is
Nano Lett. 6, 662–668. https://doi.org/10.1021/nl052396o.
a long-life and highly photostable endosome marker. Biochem. Biophys.
Connor, E.E., Mwamuka, J., Gole, A., Murphy, C., and Wyatt, M. (2005). Gold Res. Commun. 302, 496–501. https://doi.org/10.1016/S0006-291X(03)
nanoparticles are taken up by human cells but do not cause acute cytotoxicity. 00211-0.
Small 1, 325–327. https://doi.org/10.1002/smll.200400093.
Hoffman, D.P., Shtengel, G., Xu, C.S., Campbell, K.R., Freeman, M., Wang, L.,
De Chaumont, F., Dallongeville, S., Chenouard, N., Hervé, N., Pop, S., Pro- Milkie, D.E., Pasolli, H.A., Iyer, N., Bogovic, J.A., et al. (2020). Correlative three-
voost, T., Meas-Yedid, V., Pankajakshan, P., Lecomte, T., Le Montagner, Y., dimensional super-resolution and block-face electron microscopy of whole
et al. (2012). Icy: an open bioimage informatics platform for extended repro- vitreously frozen cells. Science 367, eaaz5357. https://doi.org/10.1126/sci-
ducible research. Nat. Methods, 690–696. https://doi.org/10.1038/nmeth. ence.aaz5357.
2075. Horisberger, M., and Rosset, J. (1977). Colloidal gold, a useful marker for
Deerinck, T.J., Martone, M.E., Lev-Ram, V., Green, D.P., Tsien, R.Y., Spector, transmission and scanning electron microscopy. J. Histochem. Cytochem.
D.L., Huang, S., Ellisman, M.H., et al. (1994). Fluorescence photooxidation 25, 295–305. https://doi.org/10.1177/25.4.323352.
with eosin: a method for high resolution immunolocalization and in situ hybrid- Jonker, C.T.H., Galmes, R., Veenendaal, T., ten Brink, C., van der Welle,
ization detection for light and electron microscopy. J. Cell Biol. 126, 901–910. R.E.N., Liv, N., de Rooij, J., Peden, A.A., van der Sluijs, P., Margadant, C.,
https://doi.org/10.1083/jcb.126.4.901. and Klumperman, J. (2018). Vps3 and Vps8 control integrin trafficking from
Fermie, J., Liv, N., ten Brink, C., van Donselaar, E.G., Muller, W.H., Schieber, early to recycling endosomes and regulate integrin-dependent functions.
N.L., Schwab, Y., Gerritsen, H.C., and Klumperman, J. (2018). Single organelle Nat. Commun. 9, 792. https://doi.org/10.1038/s41467-018-03226-8.
dynamics linked to 3D structure by correlative live-cell imaging and 3D elec- Kandela, I.K., and Albrecht, R.M. (2007). Fluorescence quenching by colloidal
tron microscopy. Traffic 19, 354–369. https://doi.org/10.1111/tra.12557. heavy metals nanoparticles: implications for correlative fluorescence and elec-
Fokkema, J., Fermie, J., Liv, N., van den, Heuvel, Konings, T.O.M., Dave, J., tron microscopy studies. Scanning 29, 152–161. https://doi.org/10.1002/sca.
Blab, G.A., Meijerink, A., Klumperman, J., and Gerritsen, H.C. (2018). Fluores- 20055.
cently labelled silica coated gold nanoparticles as fiducial markers for correl- Kandela, I., Meyer, D., Oshel, P., Rosa-Molinar, E., and Albrecht, R.M. (2003).
ative light and electron microscopy. Sci. Rep. 8, 13625. https://doi.org/10. Fluorescence quenching by colloidal heavy metals: implications for correlative
1038/s41598-018-31836-1. fluorescence and electron microscopy studies. Microsc. Microanal. 9, 1194–
Foster, H.E., Ventura Santos, C., and Carter, A.P. (2021). A cryo-ET survey of 1195. https://doi.org/10.1017/s1431927603445972.
intracellular compartments within mammalian axons. Preprint at bioRxiv. Karreman, M.A., Mercier, L., Schieber, N.L., Solecki, G., Allio, G., Winkler, F.,
https://doi.org/10.1101/2021.03.29.437454. Ruthensteiner, B., Goetz, J.G., and Schwab, Y. (2016). Fast and precise
Cell Reports Methods 2, 100220, May 23, 2022 15You can also read