Bangladesh Development Update - Powering the economy efficiently - World Bank Documents
←
→
Page content transcription
If your browser does not render page correctly, please read the page content below

Public Disclosure Authorized   Public Disclosure Authorized                      Public Disclosure Authorized                  Public Disclosure Authorized

                                                                                                                October 2018

                                                                              Update
                                                                              Bangladesh
                                                                              Development

                                           Powering the economy efficiently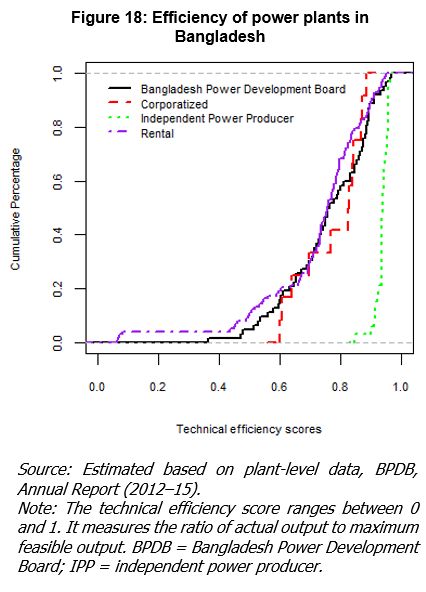
BANGLADESH DEVE LOPMENT
UPDATE

Powering the economy ef ficiently

October 2018
The World Bank Office, Dhaka
       Plot E-32, Agargaon
       Sher-e-Bangla Nagar
       Dhaka – 1207, Bangladesh
       Tel.: (880-2) 5566-7777
       Fax: (880-2) 5566-7778
       www.worldbank.org/bd

Standard Disclaimer:

       This volume is a product of the staff of the International Bank for Reconstruction and
       Development/ The World Bank. The findings, interpretations, and conclusions expressed in
       this paper do not necessarily reflect the views of the Executive Directors of The World Bank
       or the governments they represent. The World Bank does not guarantee the accuracy of the
       data included in this work. The boundaries, colors, denominations, and other information
       shown on any map in this work do not imply any judgment on the part of The World Bank
       concerning the legal status of any territory or the endorsement or acceptance of such
       boundaries.

Copyright Statement:

       The material in this publication is copyrighted. Copying and/or transmitting ions or all of this
       work without permission may be a violation of applicable law. The International Bank for
       Reconstruction and Development/The World Bank encourages dissemination of its work and
       will normally grant permission to reproduce portions of the work promptly.

       For permission to photocopy or reprint any part of this work, please send a request with
       complete information to the Copyright Clearance Center, Inc., 222 Rosewood Drive, Danvers,
       MA 01923, USA, telephone 978-750-8400, fax 978-750-4470, http://www.copyright.com/.

       All other queries on rights and licenses, including subsidiary rights, should be addressed to
       the Office of the Publisher, The World Bank, 1818 H Street NW, Washington, DC 20433, USA,
       fax 202-522-2422, e-mail pubrights@worldbank.org.

Photo Credits:

       Cover: ©The World Bank, 2018
       Printed in Bangladesh

                                                                                                       i
Table of Contents
Abstract .............................................................................................................................................................. vii
Executive Summary ........................................................................................................................................ viii
Recent Economic Developments ...................................................................................................................... 1
Resilient economy ........................................................................................................................................... 1
Stable headline inflation ................................................................................................................................. 5
Struggling financial sector ............................................................................................................................. 7
Sliding external balances .............................................................................................................................. 10
Usual fiscal trends ......................................................................................................................................... 14
Outlook ............................................................................................................................................................... 18
On the middle-income highway .................................................................................................................. 18
Risks and challenges ........................................................................................................................................ 22
Staying on track ............................................................................................................................................. 22
Energizing Electricity: building on success ................................................................................................. 26
Done well, can be better ............................................................................................................................... 27
Reforming gas pricing and allocation policy ............................................................................................. 28
Reducing inefficiency in electricity generation and distribution ............................................................ 30
Promoting cross-border electricity trade.................................................................................................... 31
Towards higher efficiency ............................................................................................................................ 32
References .......................................................................................................................................................... 35
Annex .................................................................................................................................................................. 36
List of Tables
Table 1: Top Five Garments Items .................................................................................................................. 2
Table 2: Accounting for Remittance (in million US$) .................................................................................. 4
Table 3: Monetary Program Performance ...................................................................................................... 7
Table 4: Selected Balance of Payments Indicators ..................................................................................... 11
Table 5: Merchandise Imports ....................................................................................................................... 13
Table 6: Fiscal Outcomes ................................................................................................................................ 14
Table 7: Bangladesh Macro Outlook Indicators ......................................................................................... 20
iiList of Boxes
Box 1: Capital flight or growth? ...................................................................................................................... 12
Box 2: The key fiscal challenges .................................................................................................................... 17
Box 3: Tariff escalation and Bangladesh - Opportunity or Risk?............................................................. 23
List of figures
Figure 1: Growth Trends in GDP and Per Capita Income (Annual %) ..................................................... 1
Figure 2: Recent Trends in Sectoral Growth (Annual % change) .............................................................. 1
Figure 3: Export Growth and Contribution of RMG and Non -RMG in Total Export (%) ................... 2
Figure 4: Remittance growth (%) ..................................................................................................................... 4
Figure 5: Inflation (%, y-o-y) ............................................................................................................................ 6
Figure 6: Monthly Average Price of Coarse Rice ........................................................................................... 6
Figure 7: Interest rate movement (%) .............................................................................................................. 8
Figure 8: DSE Index and Turnover ................................................................................................................. 9
Figure 9: Market Capitalization and Turnover to Capitalization ............................................................. 9
Figure 10: Trends in Gross Foreign Exchange Reserves and Current Account Balance ...................... 11
Figure 11: Exchange Rate Movement ............................................................................................................ 13
Figure 12: ADP Utilization (% of Allocation) ............................................................................................. 16
Figure 13: Budget implementation performance ........................................................................................ 17
Figure 14: Electricity supply and demand (GW) ........................................................................................ 28
Figure 15: The weighted-average gas tariff in Bangladesh is significantly below the international
price .................................................................................................................................................................... 28
Figure 16: Capacity loss due to gas shortages (percent) ............................................................................ 29
Figure 17: Gas-based electricity output would have increased after gas reallocation in Bangladesh
.............................................................................................................................................................................. 29
Figure 18: Efficiency of power plants in Bangladesh ................................................................................ 30
Figure 19: Improving generation efficiency reduces power shortages and the output of liquid fuel-
based plants in Bangladesh ........................................................................................................................... 30
iiiPreface
The objective of this report is to share perspectives with the Government of Bangladesh, think
tanks and researchers, and the public as well as the Bank’s senior management on the state of
the economy, outlook, risks, progress on structural policy reforms and key challenges the
economy is currently facing. The coverage includes developments in the real sector focusing on
poverty, growth, and inflation; external sector developments focusing on the balance of
payments, foreign exchange reserves and the exchange rate; fiscal developments focusing on
revenue mobilization, public expenditures, and deficit financing; financial sector developments
focusing on credit and interest rates; and monetary developments. This update also assesses the
progress in the electricity sector and concludes with an exposition of the policy challenges that
need to be addressed to enable electricity supply keep up with the fast-growing demand.
Acknowledgements
This report was prepared by a team comprising of Zahid Hussain (Lead Economist), Fan Zhang
(Senior Economist), Nazmus Sadat Khan (Economist), Afroza Alam (Research Analyst) and
Shegufta Shahriar (Team Associate). A. K. M. Abdullah (Senior Financial Sector Specialist) made
valuable contribution on developments in the capital market. Demetrios Papathanasiou
(Practice Manager), Jari Vayrynen (Senior Energy Specialist), Ilias Skamnelos (Lead Financial
Sector Specialist) Mona Prasad (Lead Economist), and Christian Eigen-Zucchi (Program
Leader) provided extremely useful comments. Manuela Francisco (Practice Manager) provided
overall guidance in the preparation of this report.
ivAbbreviations
ADP Annual Development Plan
ADR Advance-Deposit Ratio
BAB Bankers Association of Bangladesh
BB Bangladesh Bank
BBS Bangladesh Bureau of Statistics
BCIC Bangladesh Chemical Industries Corporation
BFIU Bangladesh Financial Intelligence Unit
BOGMC Bangladesh Oil, Gas and Mineral Corporation
BOP Balance of Payment
BPDB Bangladesh Power Development Board
BSEC Bangladesh Securities and Exchange Commission
CPD Centre for Policy Dialogue
CPI Consumer Price Index
CRR Cash Reserve Ratio
CY Calendar Year
DFIs Development Finance Institutions
DMRTDP Dhaka Mass Rapid Transit Development Project
DSE Dhaka Stock Exchange
DSEX Dhaka Stock Exchange Board Index
EBA Everything But Arms
EPB Export Promotion Bureau
EPZ Export Processing Zone
ESMAP Energy Sector Management Assistance Program
EU European Union
FCB Foreign Commercial Bank
FDI Foreign Direct Investment
FY Fiscal Year
GCC Gulf Cooperation Council
GDP Gross Domestic Product
GNI Gross National Income
GNFS Goods and Non-factor Services
GSP Generalized Scheme of Preferences
GW Gigawatts
HDI Human Development Index
HS Harmonized System
ICB Investment Corporation of Bangladesh
ICE Intercontinental Exchange
ILO International Labour Organization
IMED Implementation Monitoring and Evaluation Division
IMF International Monetary Fund
IPP Independent Power Producer
KSA Kingdom of Saudi Arabia
LC Letter of Credit
LDC Least Developed Country
LMICs Low- and Middle-Income Countries
LNG Liquefied Natural Gas
vMDAs Ministries, Divisions and Agencies
MENA Middle East and North Africa
MLT Medium and Long-Term
MoF Ministry of Finance
MoU Memorandum of Understanding
MSTPP Moitri Super Thermal Power Projec
MT Metric Ton
MUSCCFPP Matarbari Ultra-Super Critical Coal-Fired Power Project
MW Megawatt
NBR National Board of Revenue
NCBs Nationalized Commercial Banks
NPL Non-Performing Loan
NSC National Savings Certificate
NSW National Single Window
OPEC Organization of the Petroleum Exporting Countries
OSS One Stop Shop
PBRL Padma Bridge Rail Link
PCB Private Commercial Bank
PD Project Director
PM2.5 Particulate Matter
PMB Padma Multipurpose Bridge
POL Petroleum, Oil, and Lubricants
R&D Research and Development
RADP Revised Annual Development Plan
REER Real Effective Exchange Rate
RMG Ready-Made Garment
RNPP Ruppur Nuclear Power Plant
RoO Rules of Origin
SAFTA South Asian Free Trade Agreement
SANEM South Asian Network on Economic Modeling
SCBs State-owned Commercial Banks
SD Supplementary Duty
SDGs Sustainable Development Goals
SOCBs State Owned Commercial Banks
SOEs State-owned Enterprises
UAE United Arab Emirates
UK United Kingdom
UN The United Nation
UNESCAP United Nations Economic and Social Commission for Asia and the Pacific
US The United States
VAT Value Added Tax
Y-O-Y Year-on-Year
viAbstract
Strong growth, driven by consumption and public investment, has continued. Macroeconomic stability
is strained. Inflation has picked up, driven by food price increases initially and by non-food inflation
more recently. Notwithstanding rebound in garment exports and remittances, the current account
deficit has widened significantly because of a surge in imports. A large increase in the disbursement of
medium and long-term loans helped contain pressure on foreign exchange reserves and moderate the
depreciation of the exchange rate. Monetary growth has been subdued because of decline in public
sector borrowing from banks and reduced net international reserves, creating room for increased private
sector credit growth. However, weak deposit growth and the persistence of high levels of non-performing
loans have led to rise in lending rates. The fiscal deficit has increased despite underspending on public
investment as revenue growth fell well short of the budget target. Excessive reliance on expensive saving
instruments to finance the budget deficit has continued.
Over the near-term, growth is expected to remain resilient, underpinned by strong domestic demand.
Inflation is likely to accelerate with rising aggregate demand resulting in part from election related
increase in private spending, an expansionary fiscal policy and depreciating exchange rate. The current
account deficit and the fiscal deficits are projected to widen, but the risks of both external and public
debt distress are low. Downside risks include fiscal slippages aggravated by drying up of assistance for
supporting the Rohingyas, delays in banking reforms, loss of monetary policy predictability due to
diminished central bank independence and weakening reform momentum in the run-up to the elections.
Moving forward, creating more and better jobs by boosting private investments, diversifying exports
and building human capital remain the top most policy priorities. In addition to handling
macroeconomic imbalances through increased flexibility in the exchange rate and interest rates, this
would require ensuring a predictable and efficient system of business regulation, faster progress on the
implementation of the mega infrastructure projects, improving financial sector governance, and
ensuring an adequate and reliable supply of electricity.
viiExecutive Summary
GDP growth in FY18 remained strong, underpinned by private consumption, public
investment, and a recovery in ready-made garment (RMG) exports. Remittances posted 17
percent increase to reach $14.9 billion after declining for two consecutive years. Capital
machinery imports have been buoyant. Growth in Agriculture was limited in the beginning
of the year due to above-normal flooding, but harvests recovered subsequently. Real private
investment flows increased by 8.8 percent over its level the previous year, notwithstanding
cumbersome business regulations, substantial infrastructure deficits and mounting policy
uncertainties. Bangladesh’s competitiveness ranking improved marginally, but the Logistics
Performance Index rankings slipped 13 places in 2018 relative to 2016.
Supply shocks accelerated food price inflation from 6 percent in FY17 to 7.1 percent in FY18,
pushing headline inflation to 5.8 percent in FY18, from 5.4 percent in FY17. Monetary growth
has been below nominal GDP growth, contributing to decline in non-food inflation. However,
non-food inflation accelerated from its recent low of 3.5 percent in December to 4.7 percent (y-
o-y) in August due to spillovers from higher commodity prices, strong domestic demand and
exchange rate depreciation. Food inflation on the other hand slowed to 6 percent in August
because of good rice harvests and buildup of stocks.
Interest rates came under pressure as excess liquidity shrank due to credit growth exceeding
deposit growth, tightening of the Advance-Deposit Ratio by Bangladesh Bank (BB) and high
non-performing loans in the banking system. In March, ceding to pressures from the Bankers
Association of Bangladesh, BB reduced the Cash Reserve Ratio from 6.5 percent to 5.5 percent;
lowered the repo rate from 6.75 percent to 6 percent, and increased the cap on government
holding of deposits in private domestic banks from 25 percent to 50 percent. With the
administered rates on the National Savings Certificates (NSCs) unchanged at double digit
levels, both deposit and lending rates remained downwardly rigid. Subsequently, the
government directed commercial banks to cap the deposit rates at 6 percent and the lending
rates at 9 percent. The banks are yet to comply. These developments are an indication that
BB autonomy is substantially eroded.
The current account swung into the largest deficit in recent memory, driven by a surge in
consumer and capital machinery imports. Despite a recovery in exports, the current account
deficit jumped from 0.6 percent of GDP in FY17 to 3.7 percent in FY18, driven by 25.2 percent
growth in merchandize imports. BB managed the resulting pressure on the exchange rate
through a combination of direct sales of foreign exchange and advising foreign exchange
dealers to keep their buying and selling rates stable. The nominal taka-US dollar rate
depreciated by 1.8 percent in July-August 2018 following 4 percent depreciation in FY18.
Fiscal underperformance has continued. The fiscal outcomes in FY18 differed markedly from
what was envisaged in the original budget. Underperformance in development spending
relative to the original budget partially offset a revenue shortfall, thus containing the deficit
at around 4.5 percent of GDP. Public debt increased modestly to 32.1 percent of GDP and
continues at low risk of debt distress. Excessive reliance on more expensive nonbank sources
of domestic financing has continued. Consequently, interest expenditures remained high.
viiiOutput growth in FY19 is projected at 7 percent, driven by industry and services on the
supply side and private consumption and investment on the demand side. The pace of public
investment will remain strong as the implementation of mega projects gain further
momentum. Private investment growth will remain subdued due to structural constraints.
Continued strength in imports is projected to keep net exports negative despite healthy export
growth. Increased investment in manufacturing will re-energize job creation and contribute
further to poverty reduction.
Inflation is projected to accelerate as global commodity prices pick up and an expansionary
fiscal policy coupled with election-induced rise in private expenditures overheat the economy.
Adherence to a tight monetary policy, announced in July, will help contain excess demand.
The current account deficit is projected to narrow moderately due to sustained strong imports,
owing partly to large import payments associated with foreign debt financed mega projects.
Payment obligations will largely be funded by foreign debt accumulation. A large shortfall in
government revenue is expected due to reduced taxes on garments and banks and the absence
of revenue enhancing administrative measures. Also, additional pressures on expenditures
are likely due to expanded export subsidies after the budget was announced, as well as
inadequate provisions for bank recapitalizations and spending associated with the Rohingya
crisis. Together, these may widen the budget deficit.
With elections approaching, a major domestic risk is the weakening of ongoing efforts to
strengthen economic governance. Donor fatigue in providing resources to meet the needs of
the Rohingya could increase pressure on the budget, while the quasi-fiscal deficit could rise
with increasing international oil prices. Unfavorable weather could further slow poverty
reduction among households in agriculture. Rising food inflation may dampen gains made
through increased investment in industry, while exacerbating the situation for food-deficit
households in agriculture. However, export demand and remittances could surprise on the
upside.
External imbalances and tight liquidity need to be handled prudently. Exchange rate
flexibility can help BB manage pressures and maintain sufficient foreign exchange reserves.
Timely resolution of external imbalances will also contribute to expanding liquidity in the
banking system. However, efforts to reduce interest rates without reducing the NSC rates
may be futile. Allowing the BB to function independently, avoiding regulatory forbearance,
and strengthening banking supervision are high priorities.
Downside risks can be managed by accelerating reforms. The potential for export-led
manufacturing growth remains significant as Bangladesh’s productivity levels lag the global
technological frontier. Slowdown in global trade due to the ongoing tariff escalation between
US and China could have adverse effects on Bangladesh’s export prospects. Apart from
structural reforms to foster diversification of the economy and boosting investments, this
requires putting ever-increasing emphasis on education, skills, nutrition and adaptability to
rapidly changing technology and global demand. One area where structural reforms could
build on success achieved in recent years is in the generation, transmission and distribution
of electricity.
ixMeeting rapidly increasing electricity demand could yield high growth dividends.
Implementing comprehensive energy sector reform that targets inefficiencies at different
stages of power supply and distribution could boost supply while also limiting reliance on
imported fossil fuel. This would not only minimize the direct cost of electricity generation,
but also help avoid harmful emissions from fossil fuel-based generation. While the direct cost
of coal may appear cheap, coal-fired power generation comes with staggering hidden
environmental and health costs borne by the wider society. In addition to contributing to
global climate change, burning coal releases numerous toxic pollutants.
The following actions are recommended as part of a comprehensive approach to improve
electricity supply in Bangladesh:
Better pricing of domestic gas. Rationalizing the gas price would provide better incentive for
upstream gas exploration and production and avoid wasteful consumption downstream.
Correcting gas prices would save Bangladesh an estimated $4.5 billion (2 percent of GDP) a
year, which could also be spent promoting more sustainable long-term growth of the
economy.
More efficient allocation of gas. Allocating gas based on transparent market rules rather than ad
hoc administrative orders would promote more productive use of gas. In the power sector,
prioritizing gas allocation for more efficient plants could increase gas-based electricity
generation, reduce unserved energy demand, and minimize the need for more expensive
diesel and furnace oil-based plants.
Incentive-based regulation of power plants. Tariffs paid to plants could be linked with their
performance, as measured by fuel efficiency or operating costs. Plants would be penalized
for falling below some reasonable performance levels and rewarded for exceeding them.
Without fundamental changes in incentive structures, corporatizing utilities alone may not
guarantee improved operating efficiency.
Merit-order based power dispatch. Dispatching generation in merit order could save the economy
an estimated $1.65 billion a year in fuel costs. Merit-based power dispatch could also serve as
a powerful tool for monitoring plants’ performance and encourage competition among plants.
Better pricing of electricity. A cost-based pricing mechanism is essential for encouraging more
efficient consumption, attracting private investment, and strengthening the financial position
of distribution utilities so they have the resources needed to invest in and maintain the grid.
International experience shows that replacing ad hoc notification of tariff changes with
automatic pass-through of fuel costs to electricity prices helps depoliticize the process of tariff
rationalization.
Accompany reforms with compensation. Although price reform delivers large economic
benefits in the long term, hikes in gas and electricity prices can cause immediate economic
distress, especially for the poor and vulnerable. Raising prices gradually while providing
targeted social assistance can mitigate the impact. It is therefore important to assess potential
poverty and social impacts before tariff reform and provide targeted social assistance to the
vulnerable by scaling up existing social programs or implementing new ones. Offsetting price
increases requires rapid improvements in efficiency on both the supply and demand side.
xRecent Economic Developments
Bangladesh is moving ahead on the development path at a rapid pace. GDP growth in recent years has
benefitted from robust domestic demand, underpinned by strong private consumption growth and a
mild recovery in private investment and exports. Ready-made garment exports have grown following
a flat year. Remittances have turned around significantly after declining for two years in a row.
Agriculture suffered from normal flooding in early FY18, but output recovered subsequently.
Momentum in industrial and services growth have been sustained. Supply shock accelerated food price
inflation in FY18 while non-food inflation eased. The exchange rate and reserves are under pressure
due to a large spike in the current account deficit. The fiscal deficit has increased as well, but the risk
of debt distress continues to be low.
Resilient economy
Bangladesh has achieved outstanding success in both poverty eradication and human
development. Defying many odds, Bangladesh has continued to make progress in improving
the lives and livelihood of its people. The recently published Human Development Report
2018 put Bangladesh in the medium human development category—positioning it at 136 out
of 189 countries and territories with a HDI value for 2017 of 0.608. Between 1990 and 2017,
Bangladesh’s HDI value increased 57.1 percent. During the same period, Bangladesh’s life
expectancy at birth increased by 14.4 years, mean years of schooling increased by 3 years and
expected years of schooling increased by 5.8 years. Bangladesh’s GNI per capita increased by
about 178.6 percent between 1990 and 2017.
Economic growth remains strong. The economy is estimated to have grown by 7.86 percent
in FY18 by the Bangladesh Bureau of Statistics (BBS), the highest rate in Bangladesh’s history
and the third consecutive year of at least 7 percent plus growth (Figure 1). Growth is reported
to have been led by manufacturing and construction, benefiting from robust domestic demand
(Figure 2). The contribution of industry was 3.75 percentage points, of which manufacturing
contributed 2.8 percentage points to total growth (Annex Table 1) in FY18. Garment exports,
which accounted for 83.4 percent of exports, grew by 8.8 percent (in nominal dollar terms) in
FY18, a notable recovery from the 0.2 percent growth posted in FY17. Construction, fueled by
Figure 1: Growth Trends in GDP and Per Capita Figure 2: Recent Trends in Sectoral Growth
9.0 Income (Annual %) 16.0 (Annual % change)
8.0 14.0
7.0
12.0
6.0
10.0
5.0
8.0
4.0
6.0
3.0
4.0
2.0
2.0
1.0
0.0
0.0
FY10
FY11
FY12
FY13
FY14
FY15
FY16
FY17
FY18
FY10
FY11
FY12
FY13
FY14
FY15
FY16
FY17
FY18
Agriculture Manufacture
GDP Growth GDP Growth Per Capita Services Construction
Source: Bangladesh Bureau of Statistics (BBS) Source: Bangladesh Bureau of Statistics (BBS)
1strong manufacturing growth as well as large amounts of remittance inflows, grew by an
estimated 9.9 percent, maintaining its 8-plus percent growth record for nearly a decade.
Remittances through formal channels reached $14.9 billion in FY18, which is equivalent to
about 5.4 percent of GDP and 40.5 percent of merchandize exports.
Export diversification remains elusive. Export earnings regained resilience, although the 5.3
percent growth remained below the FY18
Figure 3: Export Growth and Contribution of
target of 8.2 percent. Still, the growth 90.0 RMG and Non -RMG in Total Export
(%)
performance of the ready-made garment 75.0
(RMG) exceeded the annual target of 7.1 60.0
percent set for the sector. The 9.5 percent 45.0
decline in export of non-RMG products 30.0
dragged down the total exports (Figure 3). 15.0
Exports remain highly concentrated even 0.0
FY18
FY09
FY10
FY11
FY12
FY13
FY14
FY15
FY16
FY17
within garments. A few items, most notably
shirts, trousers, jackets, t-shirts, and sweaters RMG Contribution Non RMG Contribution
account for more than 80 percent of RMG Total Export Growth
exports. As Table-1 shows, at the HS-8-digit Source: Export Promotion Bureau (EPB)
level, the top 4 knitwear products together accounted for 68.9 percent of total exports and the
top 4 woven products accounted for 70 percent of total woven exports in FY18.1 The
comparable figures for China, India, Malaysia and Vietnam range from 20 to 50 percent. There
thus exists massive opportunities for generating exports in new products (and thus
diversification) within the RMG sector, given the expected growth of global apparel demand
in the future. Diversification within RMG has the potential to drive rapid export expansion.
Available projections suggest that the annual global apparel consumption could exceed $2.5
trillion by 2025 (from currently USD 1.8 trillion), boosting exports of clothing from various
suppliers.
Table 1: Top Five Garments Items
FY18
US$ million % of total
Knitwear
Men's
Over/Car Coats (Cotton, Knitted or Crocheted) 5866.9 38.6
Over/Car Coats (Man-Made Fibers, Knitted or Crocheted) 1926.7 12.7
Over/Car Coats (Other Textiles, Knitted or Crocheted) 1070.1 7.0
Woman's
Over/Car Coats (Wool, Knitted or Crocheted) 819.9 5.4
Over/Car Coats (Cotton, Knitted or Crocheted) 788.3 5.2
Total 10471.9 68.9
Woven
Men's
Overcoats, Capes, Cloaks (Wool or Fine Animal Hair) 5209.0 33.8
Overcoats, Capes Cloaks (Cotton) 2877.5 18.7
Overcoats, Capes, Cloaks (Man-Made Fibers) 1668.0 10.8
Overcoats, Capes, Cloaks (Other Textiles) 645.9 4.2
Anoraks, Wind Jackets/Cheaters (Wool/Fine Anima Hair) 403.0 2.6
Total 10803.4 70.0
Source: Export Promotion Bureau
Note: All products are based on 8 digit Harmonized System (HS) code
1
Note that there are 105 8-digit HS codes in knitwear and 111 in woven products.
2Growth of exports to the traditional markets have out-performed that in the non-traditional
markets in FY18 as well. Exports to the EU grew by 10.3 percent. The phase-out of the initial
shock emanating from Brexit and improvements in the global economic outlook contributed.
Bangladesh is on course to graduate from the LDC status in 2024. It will enjoy the Everything
But Arms (EBA) benefits in EU markets till 2027 after which benefits accruing from the Duty
Free-Quota Free market access and the relaxed rules of origin (RoO) in place for LDCs are
most likely be phased out. Accessing GSP plus will require compliance with the 27 UN/ILO
Conventions. Also, Brexit will call for renegotiation of trading relations with the UK. Growth
in exports to the US was only 2.3 percent. This is attributable to loss of price competitiveness
and lack of product diversification. Other prime competitors of Bangladesh experienced
significant growth in the US market.2 Apparel imports in the US market have been
experiencing a decelerating growth trend in recent years. Average duties on import of
apparels and clothing accessories in the US were highest in 2017, when they reached 14.2
percent. Bangladesh exports faced the highest tariff of 15.2 percent in the US market amongst
232 exporting countries, territories or jurisdictions, while the global average tariff of all
imports to the US was only 1.4 percent.3 In a buyer-driven market, Bangladesh’s exporters are
subject to continuing pressure from major buying companies and retail chains.
Product and market diversification are critical for building resilience. External shocks in the
form of reduced demand, higher price of cotton imports, or higher tariff in Europe, can have
a major impact on the garments industry. Many of the Bangladesh’s current strengths are
thinly based. Cheap labor cost and lax enforcement of fire, safety, and regulations allowed
outbidding competitors such as Vietnam, Sri Lanka, Pakistan, and India. However, as evident
from recent history, headwinds can emerge unexpectedly and in no time. Bangladesh may
soon find itself losing market share as trade alliances and tariff preferences shift. The cost of
labor is increasing and will increase further as the living wage movement gains ground.
Improved compliance with fire and safety codes has also raised the cost of production.
Initiatives towards export and market diversification have failed to yield visible results.
Exports of a promising non-RMG item (leather and leather products) is facing a major setback
due to relocation to Savar Tannery Estate. This prolonged process caused disruption in
production. To stimulate exports of high value-added items, the government banned export
of crust leather. As experienced earlier in the case of ban on export of raw jute, these policies
have not worked to stimulate growth of value added products in leather. Both these sectors
are facing significant deficits in skills and technology. Going forward, sector-specific targeted
programs and more emphasis on research and development (R&D) will be needed.
2
Vietnam registered over 7 percent growth in the US apparel market, followed by Mexico at 5.33 percent, India at 1.19 percent
and Pakistan at 1 percent in 2017. Vietnam is taking advantage of China’s displacement much better than her close competitors
such as Bangladesh. China, the largest exporter of apparel products, also had a decline in export earnings as well as market
share in the US. In general, however, RMG imports by the US has been on the decline in recent years.
3
Centre for Policy Dialogue, Integrated Review of Bangladesh Economy, June 2018.
3Officially recorded remittance flow Figure 4: Remittance growth (%)
25.0
recovered impressively, growing 17.1
20.0
percent in FY18, following successive 15.0
declines in two previous years (Figure 4). 10.0
The recovery has been spread over several 5.0
countries, including GCC, US, UK and 0.0
others (Table 2). The rise in crude oil price, -5.0
increase in the number of Bangladeshis -10.0
working abroad, change in policies in -15.0
Saudi Arabia (a rise in the minimum wage -20.0
and a change in the akama system),
depreciation of the taka, and effective
Source: Bangladesh Bank
action against illegal money transfers are
likely to have contributed to the recovery.4 Note however that the level of remittance was still
2.4 percent lower than the $15.3 billion level achieved in FY15, the highest ever in Bangladesh.
The composition of remittance inflows is broadly unchanged with about 56 percent of
remittance earnings coming from the Gulf countries, reflecting the concentration of migrants
in the Middle East.5 The number of migrants from Bangladesh has risen significantly in recent
years. Between 2013 and 2017, about 2.32 million people joined the migrant labor force. The
growth was significant because of Saudi Arabia opening its market in 2015 for Bangladeshi
migrants. Average monthly out-migration increased from about 35,520 in 2014 to 84,000 in
2017. The Saudi government recently stopped recruitment of foreign workers in 12 jobs
categories and majority of Bangladeshi low skilled migrant workers fall into these categories.
As a result, growth of out-migration to Saudi Arabia slowed considerably to just 1.2 percent
in FY18. This notwithstanding, about 0.9 million additional Bangladeshi workers joined the
migrant labor force in FY18.
Table 2: Accounting for Remittance (in million US$)
% of total % of total
Change in FY17 Change in FY18
Change Change
GCC -1237.6 57.2 1238.2 56.6
o/w KSA -692.9 32.1 324.3 14.8
Qatar 144.5 -6.7 266.6 12.2
Others -924.2 42.8 949.1 43.4
o/w UK -54.0 2.5 297.0 13.6
USA -725.0 33.5 307.5 14.1
Gross Decline -2479.9 0.0
Gross Increase 318.2 2187.3
Net decline/increase -2161.7 2187.3
Source: WB staff estimation based on Bangladesh Bank data
4
Globally, after two consecutive years of decline, remittance flows to low- and middle-income countries (LMICs) in 2017 has
rebounded, increasing by 8.5 percent to reach USD 466 billion (World Bank, 2018).
5
In keeping with the trends over the last two fiscal years, during the first seven months (July-January) of FY18, out-migration
to GCC countries grew by 26.8 percent, accounting for 49 percent of total outflow in FY18 through January.
4Real investments increased by 10.5 percent over its level in FY17. While the private
investment to GDP ratio increased marginally from 23.1 to 23.3 percent, public investment
increased from 7.4 percent of GDP in FY17 to nearly 8 percent in FY18. Public investments
expanded by about 16 percent, accounting for 33.8 percent of total investment. Private real
investment growth increased from 8.1 percent in FY17 to 8.8 percent in FY18. Construction
continued to dominate, constituting over two-third of total gross capital formation followed
by investment in plant and machinery which account for about one-fifth. Based on data on
capital machinery imports, the bulk of investments outside construction appears to be in
textiles, garments, motor vehicles, and infrastructure. Foreign Direct Investment (FDI),
however, declined from $1.65 billion in FY17 to $1.58 billion in FY18. Note also that the share
of FDI in form of equity capital is only around one-fourth of total inflows. Bangladesh
improved it’s score on all three components—institutions, infrastructure and macroeconomic
environment--of the Global Competitiveness Index in 2017, leading to an improvement in the
overall ranking from 106 in 2016 to 99 in 2017. Notwithstanding the improvement,
Bangladesh’s ranking in 2017 remained below all countries in East Asia, except Cambodia,
and all countries in South Asia, except Pakistan.6 Also, Bangladesh slipped one place—from
176 to 177—on the Ease of Doing Business Ranking 2018 and was well behind all countries in
East and South Asia.7 Bangladesh’s ranking on the Logistics Performance Index slipped 13
places in 2018 relative to 2016.8
Stable headline inflation
Headline inflation accelerated in FY18 due to supply shock induced increase in food price inflation while
non-food inflation slowed. The relaxation of barriers to importing rice combined with good boro harvests
led to a deceleration of food inflation, but non-food inflation has begun to rise in recent months because
of domestic demand growth fueled by a rise in remittances and private credit as well as exchange rate
depreciation.
Supply shocks accelerated food price inflation. Headline inflation picked up to 5.8 percent
in FY18, compared with 5.4 percent in FY17 (which was the lowest inflation rate in last five
years). Production shortfall due to floods led to sharp increases in food inflation to 7.1 percent
in FY18, compared with 6 percent in FY17. The acceleration in headline inflation was
contained by decline in non-food inflation from 4.6 percent in FY17 to 3.7 percent in FY18
(Figure 5). Supply shocks and delayed policy response explain the surge in food prices. FY18
started with low stocks of food in both public and private sector as production of rice and
wheat declined by 2.6 percent in FY17 after stagnating at the same level in the preceding two
years. Production of rice declined by 9.4 lac MT and wheat production by 0.4 lac MT. In
addition to production losses, weak management of public food stock exacerbated the food
deficit in FY17. Public food stock replenishment through import and domestic procurement
of rice was inadequate to stabilize the market price. The decision on duty reduction on rice
import came with a lag and unsuccessful attempts to import rice through public channels
6
World Economic Forum, Global Competitiveness Index 2017.
7
The World Bank, Ease of Doing Business Indicators 2018.
8
The World Bank, Connecting to Compete 2018.
5eventually transmitted confusing signals to the market. Consequently, the price of rice and
hence, food inflation, rose sharply.
The inflation trends have reversed more recently. After peaking at 7.9 percent in September
2017, food inflation slowed steadily to 6 percent in August 2018 while non-food inflation
picked up to 4.7 percent after bottoming out at 3.1 percent in January-February. Headline
inflation has continued to ease to 5.5 percent, driven entirely by slower food inflation. It
appears that lower rice prices (Figure 6) resulting from good boro harvests and the surge in
rice and wheat imports played a major role in reducing food price inflation. Sustained high
domestic demand, resulting from increased remittances and private credit growth, as well as
exchange rate depreciation and seasonal factors such as Eid in June and August helped non-
food inflation.
Figure 5: Inflation (%, y-o-y) Figure 6: Monthly Average Price of Coarse
15.0 Rice
54.0
13.0 Aug-18,
49.0
42.56
11.0 44.0
9.0 39.0
Sep-17,
7.0 34.0 48.16
Jun-18,
5.0 29.0 40.09
3.0 24.0
Jun-18
Jun-15
Jun-16
Jun-17
Feb-15
Dec-17
Apr-15
Aug-15
Oct-15
Dec-15
Apr-16
Aug-16
Oct-16
Dec-16
Apr-17
Aug-17
Oct-17
Apr-18
Aug-18
Feb-16
Feb-17
Feb-18
General Index Food Non-food
Source: Bangladesh Bureau of Statistics Source: Trading Corporations of Bangladesh
Monetary outcomes were below target. Broad money growth remained subdued at 9.2
percent in FY18 despite 17 percent growth in credit to the private sector. Monetary growth
was well below the 13.9 percent growth in nominal GDP. Reserve money growth slowed
sharply from 16.3 percent in FY17 to 4 percent in FY18 reflecting, on the asset side, largely a
weaker balance of payments that led to an easing in the growth of net foreign assets (from
15.1 percent in FY17 to 0.48 percent in FY18) of BB. On the liability side of reserve money,
there was a sharp deceleration in the growth of the stock of currency outside banks from 14.3
percent in FY17 to 2.4 percent in FY18 while growth of deposits held with BB slowed from
20.5 percent to 7.4 percent respectively. The 14.7 percent total domestic credit growth was
short of BB’s 15.8 percent target for the year because of 2.5 percent decline in credit to the
central government. Private sector credit grew nearly 17 percent, exceeding the BB target
marginally (Table 3). BB has taken a passive approach to domestic liquidity management. It
has been reinjecting only part of the liquidity losses from the market due to its foreign
exchange market intervention on the supply side.
After tightening monetary conditions early in 2018, subsequent easing of key elements of
the macroprudential framework raises concerns about the autonomous conduct of
monetary policy. In January, Bangladesh Bank (BB) announced a tightening of monetary
policy by lowering the Advance-Deposit Ratio (ADR) from 85 percent to 83.5 percent. This
combined with a much slower growth in deposit (10.3 percent) relative to growth in domestic
6Table 3: Monetary Program Performance
(Annual percentage change)
FY 15 FY 16 FY 17 FY 18 FY19
Target Actual Target Actual Target Actual Target Actual Target
Net Foreign Assets 3.6 18.2 11.1 23.2 10.1 14.4 0.1 -0.8 -1.6
Net Domestic Assets 20.2 10.7 16.2 14.2 17.3 9.7 17.9 12.8 16.2
Domestic credit 17.4 10.0 15.5 14.2 16.4 11.2 15.8 14.7 15.9
Public Sector credit 25.3 -2.6 18.7 2.6 16.1 -12.0 8.3 -0.5 8.5
Private Sector credit 15.5 13.2 14.8 16.8 16.5 15.7 16.8 16.9 16.8
Broad Money 16.5 12.4 15.0 16.3 15.5 10.9 13.3 9.2 12.0
Reserve Money 15.9 14.3 14.3 30.1 14.0 16.3 12.0 4.0 7.0
Inflation (end of period
6.5 6.4 6.1 5.9 5.3-5.6 5.4 5.5 5.8 5.6
average)
Growth 6.5-6.8 6.6 6.8-6.9 7.1 7.2 7.2 7.4 7.9 7.8
Source: Bangladesh Bank and Bangladesh Bureau of Statistics
credit as well as elevated non-performing loans led to a liquidity crunch in parts of the
banking system, thus putting upward pressure on deposit and lending rates. Ceding to
pressures from the Bankers Association of Bangladesh (BAB) through the Ministry of Finance,
BB eased monetary policy in March by reducing the Cash Reserve Ratio from 6.5 percent to
5.5 percent and the repo rate from 6.75 percent to 6 percent. It also increased the cap on
government ministries and agencies holding of deposits in private domestic banks from 25
percent to 50 percent. With the administered rates on the National Savings Certificates
unchanged at double digit levels, financial sector distortions remain, and deposit and lending
rates continue at high levels. The government instructed the commercial banks (through BAB)
to cap average deposit rates at 6 percent and lending rates at 9 percent, but banks are yet to
comply. There are growing concerns about regulatory capture in the face of strong lobbyists
influencing monetary policy through the Ministry of Finance (MoF).
Struggling financial sector
The performance of the banking sector and solvency of some financial intermediaries has remained a
concern because of limited action to address defaults, improve risk management and strengthen
corporate governance. Persistent weaknesses owe largely to the legacy of loans to larger borrowers, who
lack incentives to repay, given legal limitations on recoveries.
The performance of the banking sector remained off-track in FY18. Many key targets were
missed, while high-profile irregularities remain unresolved. High levels of non-performing
loans (NPLs) have persisted in recent years.9 State-owned Commercial Banks SCB) account
for most NPLs in the banking sector. The volume of NPL increased to Tk. 893.4 billion at end-
June 2018, constituting 10.4 percent of total loans, from Tk. 743 billion at end-December 2017,
or 9.3 percent of total loans. The six SCBs accounted for 48 percent of total NPLs while the 40
9
High NPLs appear to be a South Asian phenomenon. A cross-country comparison of NPLs shows that five South Asian countries,
Bangladesh, Bhutan, India, Maldives, and Pakistan, had NPLs exceeding 8 percent of total loans in 2017. On the other hand,
eight South-East Asian countries, Brunei, Cambodia, Indonesia, Malaysia, Philippines, Singapore, Thailand, and Vietnam, all had
NPLs below 4 percent of total loans in 2017. CPD June 2018.
7Private Commercial Banks (PCBs) accounted for 43.6 percent of total NPLs.10 If rescheduled
and restructured advances were considered, then the gross stressed advance would have been
even higher for each category of banks.11 Commercial loans and the RMG sector had the
highest share of NPLs (23.9 percent and 14.5 percent respectively) against their 23.1 percent
and 11.7 percent of total outstanding loans in the banking industry in 2017.12 More than four-
fifths of gross NPLs (87 percent) were bad loans. Sub-standard and doubtful categories
constituted 7.5 percent and 5.5 percent respectively. Financial fraud, lack of proper due
diligence in loan sanctions, political influence on loan disbursement, lax efforts to recover
loans, and the failure to undertake effective measures against loan defaulters have sustained
high NPLs in the banks. The legal framework for dealing with non-performing loans,
consisting of the Money Loan Court Act 2003 and Bankruptcy Act 1997, needs to be
strengthened. The number of judges handling NPLs is inadequate, and the backlog of cases,
already heavy, is accumulating.
Supervision and remediation of problem banks needs to be strengthened. The government
has injected large amounts of capital into the troubled state-owned banks and indirectly to
private banks, but in the absence of firm remedial action, performance has not improved. The
role and mandate of state-owned banks need to be eventually addressed as well, not just their
financial performance.
Excess liquidity shrank. Elevated NPLs, high dependency on National Savings Certificates
and BB intervention in foreign exchange market contributed to recent drying of excess
liquidity in the banking system. Total
Figure 7: Interest rate movement (%)
liquid assets of banks decreased by nearly 16.0
7 percent through May 2018 relative to 14.0
end-June 2017. The reduction in the cash 12.0
10.0
reserve ratio (CRR) has not been reflected
8.0
in lower interest rates; both lending and
6.0
deposit rates in fact increased since the 4.0
decrease in CRR (Figure 7). However, the 2.0
call money rate has decreased from 4.3 0.0
percent in April to 1.67 percent in August
2018 before rising back to over 4 percent in
September. While the BB directed banks to Lending Rate Deposit Rate
reduce the interest rate spread from 5 Source: Bangladesh Bank
percent to 4 percent, the weighted average
interest rate spread of scheduled banks stood at 4.45 percent in June 2018. Indeed, due to the
high cost of funds, inefficiencies in the financial system and the perceived high risks of lending
10
An emerging concern is the presence of significant insider lending in private banks. According to BB data, bank directors
borrowed Tk. 1076.95 billion from each other’s privately-owned banks as of March 2018. This constituted 13.3 percent of total
outstanding loans in the banking sector. Per banking regulations, a bank can provide up to 25 percent of its capital to a single
borrower, including a bank’s director. Bangladesh appears to be an exception in allowing shareholders to be bank directors when
compared with the best practices in the rest of the world, including India. India’s Banking Regulation Act 1949 does not allow
industrialists or business persons to become a director of any bank.
11
A total of Tk. 48.2 billion adversely classified loans were written-off from the banks’ balance sheet till December 2017, which
was Tk. 44.7 billion at the end of CY16. However, out of the total written off loans, banks were able to recover Tk. 10.5 billion
in 2017.
12
Bangladesh Bank, Financial Stability Report 2017.
8in Bangladesh, commercial banks tend to keep lending rates elevated. The response to the
directed 9 percent cap on lending rates has largely taken the form of reduced lending as
evidenced by the Tk. 60.6 billion decline in the stock of private sector credit in July relative to
June 2018.
New banks continue to gain regulatory approval. A new bank was granted license recently
and approval of two more is under consideration. According to the Bank Company
(Amendment) Act 2013, the BB grants licenses to new commercial banks after evaluating the
need for more banks and the overall state of the economy. This principle is not being followed
in approving new licenses and the number of banks is already high. As of May 2018,
Bangladesh had 57 commercial banks comprised of 6 SCBs, 2 DFIs, 40 Private Commercial
Banks (PCB), and 9 Foreign Commercial Banks (FCB). Cross-country comparison indicates
that the total number of banks in Bangladesh is high by global standards.13 Bangladesh also
has a high geographic density of commercial bank branches. Globally, Bangladesh has the 8th
highest geographic concentration of commercial bank branches, excluding the microstates
having a land area of less than 1000 square kilometer. This puts Bangladesh in the same class
of countries that include financial hubs such as Japan and tax havens like Luxembourg.
Capital markets remained volatile. After rising strongly in 2017, equities have been on
downward trend since January 2018, with significant volatility (Figure 8). The DSEX, the
benchmark index of the main bourse Dhaka Stock Exchange, increased from 5323 in February
to 6337 in November 2017, rising 1,014 points (19 percent). The DSEX subsequently retreated
from this high, dipping as low as 5263 on July 30, 2018, a decline of about 17 percent in the
first seven months of 2018, before recovering to 5619 at the end of August.
Figure 8: DSE Index and Turnover Figure 9: Market Capitalization and Turnover
6400 7000 to Capitalization
6200 52 0.06
6000
6000 50 0.05
5000
5800 0.04
5600 4000 48
0.03
5400 3000 46
5200 0.02
2000
5000 44 0.01
4800 1000
42 0
4600 0
Jul-17
Jun-17
Jan-18
Jun-18
Aug-17
Sep-17
Oct-17
Nov-17
Dec-17
Apr-18
May-17
Feb-18
Mar-18
May-18
Mkt Capitalization
DSEX Turnover-Right Axis Turnover to Mkt Cap Ratio-Right Axis
Source: Dhaka Stock Exchange Source: Dhaka Stock Exchange
These trends are strongly influenced by the policy environment and the institutional
investors. The BB’s contractionary monetary policy stance in early 2018 to curb both inflation
and private sector credit growth had negative impacts on banking sector liquidity, which, in
the absence of big ticket institutional investments from foreign or domestic sources, had a
major impact on trading volumes. With conditions easing in July, turnover jumped, and the
general price level of stocks has risen (Figure 9). Institutional investors appear to have played
13
See CPD, State of the Bangladesh economy in 2017-18, June 2018.
9a significant role in recent market volatility. Investors such as PCBs, Investment Corporation
of Bangladesh (ICB), mutual funds and brokerage houses have been important market players
in the stock market, taking investment-related decisions based on the prospects of the
companies listed in the market. High excess liquidity in the banking system in 2017, induced
banks to make large investments in the stock market, contributing to the bullish trend during
the year. The government advice for mandatory 10-year extension of maturity of about 30
closed end mutual funds has raised new concerns. The directive involves around $1 billion
in Assets Under Management that were to be made open-end funds or wound up by 2023 and
enable investors to get their investments back. A section of fund managers successfully
lobbied to get the maturity period of the mutual funds extended across the board for another
10 years to maintain their access to funds. Extending the mutual funds’ term without the
consent of the investors sends a negative signal, damages confidence, and impedes the
development of the institutional investor base, a much-desired objective.
The impediments to making capital markets play a significant role in the provision of long-
term finance need to be addressed. A well-functioning government debt market is the
foundation for capital market development, as it sets the risk-free rate and benchmark for
pricing other instruments. While the basic architecture is working well, the market making
function is currently not being fulfilled as the government is not issuing sufficient market-
based instruments, such as treasury bonds, leading to the absence of a benchmark government
bond yield curve that would trigger the development of other key markets. The corporate
debt market is limited, with currently only one issue listed on the Dhaka Stock Exchange.
Issues by non-financial corporations have been few, with the stronger companies largely
relying on retained earnings and/or bank financing. Key impediments relate to the trading
structure, tax incentives, regulatory disincentives, limited confidence in related professional
services (audit, credit rating), lack of diversity in debt products, and underdeveloped
institutional investors. Signing agreements with the consortium of Shanghai Stock Exchange
and Shenzen Stock Exchange is one good step forward in developing the capital markets. The
consortium of strategic investors was selected through competitive bidding process, helping
the main bourse of the country make tangible progress in demutualizing the exchange.
Sliding external balances
Exchange rate and the foreign exchange reserves came under pressure with the emergence of deficit in
the overall balance of payments for the first time since FY11. This resulted from large increases in trade,
services and income account deficits. A surge in financial account surplus coupled with shedding of
reserves by BB moderated the extent of depreciation of the exchange rate.
External deficit widened significantly. The overall balance of payments, for the first time
since FY11, turned into a $885 million deficit in FY18, compared with $3.25 billion surplus the
previous year. This resulted from an increase in the current account deficit from $1.3 billion
in FY17 to $9.8 billion in FY18 (Figure 10). All parts of the current account saw palpable
increases: (i) the trade deficit doubled from $9.5 billion to $18.3 billion, driven primarily by
25.2 percent growth in merchandize imports; (i) the services account deficit increased from
$3.3 billion to $4.8 billion, driven by 21 percent growth in payments for transportation and 78
percent growth in “other” payments; and (iii) income account deficit increased from $1.9
billion to $2.4 billion, driven by 28.3 percent growth in income payments. Rice import
10You can also read