Atmospheric gas-phase composition over the Indian Ocean
←
→
Page content transcription
If your browser does not render page correctly, please read the page content below

Review article
Atmos. Chem. Phys., 22, 6625–6676, 2022
https://doi.org/10.5194/acp-22-6625-2022
© Author(s) 2022. This work is distributed under
the Creative Commons Attribution 4.0 License.

                      Atmospheric gas-phase composition over
                                 the Indian Ocean
             Susann Tegtmeier1 , Christa Marandino2 , Yue Jia1,a , Birgit Quack2 , and Anoop S. Mahajan3
               1 Institute
                         of Space and Atmospheric Studies, University of Saskatchewan, Saskatoon, Canada
               2 Biogeochemistry   Research Division, GEOMAR Helmholtz Centre for Ocean Research Kiel,
                                                    24105 Kiel, Germany
           3 Center for Climate Change Research, Indian Institute of Tropical Meteorology, Pune, 411016, India
                           a now at: Cooperative Institute for Research in Environmental Sciences,

                                     University of Colorado Boulder, Boulder, CO, USA
                               Correspondence: Susann Tegtmeier (susann.tegtmeier@usask.ca)

                                    Received: 16 July 2020 – Discussion started: 18 December 2020
                             Revised: 12 March 2022 – Accepted: 16 March 2022 – Published: 23 May 2022

      Abstract. The Indian Ocean is coupled to atmospheric dynamics and chemical composition via several unique
      mechanisms, such as the seasonally varying monsoon circulation. During the winter monsoon season, high pol-
      lution levels are regularly observed over the entire northern Indian Ocean, while during the summer monsoon,
      clean air dominates the atmospheric composition, leading to distinct chemical regimes. The changing atmo-
      spheric composition over the Indian Ocean can interact with oceanic biogeochemical cycles and impact marine
      ecosystems, resulting in potential climate feedbacks.
         Here, we review current progress in detecting and understanding atmospheric gas-phase composition over
      the Indian Ocean and its local and global impacts. The review considers results from recent Indian Ocean ship
      campaigns, satellite measurements, station data, and information on continental and oceanic trace gas emissions.
      The distribution of all major pollutants and greenhouse gases shows pronounced differences between the land-
      mass source regions and the Indian Ocean, with strong gradients over the coastal areas. Surface pollution and
      ozone are highest during the winter monsoon over the Bay of Bengal and the Arabian Sea coastal waters due
      to air mass advection from the Indo-Gangetic Plain and continental outflow from Southeast Asia. We observe,
      however, that unusual types of wind patterns can lead to pronounced deviations of the typical trace gas distri-
      butions. For example, the ozone distribution maxima shift to different regions under wind scenarios that differ
      from the regular seasonal transport patterns. The distribution of greenhouse gases over the Indian Ocean shows
      many similarities when compared to the pollution fields, but also some differences of the latitudinal and seasonal
      variations resulting from their long lifetimes and biogenic sources. Mixing ratios of greenhouse gases such as
      methane show positive trends over the Indian Ocean, but long-term changes in pollution and ozone due to chang-
      ing emissions and transport patterns require further investigation. Although we know that changing atmospheric
      composition and perturbations within the Indian Ocean affect each other, the impacts of atmospheric pollution
      on oceanic biogeochemistry and trace gas cycling are severely understudied. We highlight potential mechanisms,
      future research topics, and observational requirements that need to be explored in order to fully understand such
      interactions and feedbacks in the Indian Ocean region.

Published by Copernicus Publications on behalf of the European Geosciences Union.
6626                                       S. Tegtmeier et al.: Atmospheric gas-phase composition over the Indian Ocean

1     Introduction                                              gether with burning of coal and other fossil fuels for en-
                                                                ergy production, this leads to large emissions of manmade
Over the Indian Ocean, intense anthropogenic pollution from     trace species including greenhouse gases and ozone precur-
Southeast Asia mixes with pristine oceanic air. The inter-      sors (e.g., Lawrence, 2004). In addition, primary aerosols,
play of the polluted continental and clean oceanic air masses   such as soot and dust, and precursors of secondary aerosols
as well as the resulting atmospheric composition, are deter-    are released in relatively large amounts. As a result, air pollu-
mined by distinct seasonal circulation patterns. The large-     tion is a serious health issue in many Indian Ocean countries,
scale monsoon circulations, in combination with anthro-         leading to increases in respiratory and cardiovascular prob-
pogenic emissions from southern Asia, lead to seasonally        lems (Rajak and Chattopadhyay, 2020). The intense pollu-
contrasting chemical regimes over the Indian Ocean. As the      tion has also been linked to regional weather impacts, such
anthropogenic emissions include relatively large contribu-      as changes in rainfall patterns and decreasing crop harvests
tions from biofuel–biomass combustion and incomplete in-        (e.g., Bollasina et al., 2011; Li et al., 2016).
dustrial burning, the atmospheric composition during pol-
luted periods shows unique characteristics when compared to     1.2   Seasons
other regimes. The complex mixture of chemical constituents
and large-scale transport patterns can have a profound influ-   Seasonal changes in atmospheric transport patterns are the
ence on oceanic processes, stratospheric composition, and       main driver of Indian Ocean chemical regimes and lead to
neighboring regions such as the Mediterranean and Africa.       periods of intense anthropogenic pollution alternating with
Here we provide a review of the recent progress in our un-      periods of clean oceanic air. The South Asian monsoon cir-
derstanding of the atmospheric gas-phase composition over       culation, the strongest monsoon system in the world, dom-
the Indian Ocean and how it impacts the ocean and upper         inates the regional meteorology of the Indian subcontinent.
atmosphere. This article is part of the special issue “Under-   The seasonal reversal of the winds is coupled to a strong an-
standing the Indian Ocean system: past, present and future”.    nual cycle of precipitation with very wet summer and dry
                                                                winter conditions (Chang, 1967). Being the dominant driver
                                                                of the annual cycle of rainfall, the South Asian monsoon con-
1.1    Region                                                   trols the water and food security of the region and thus the
The Indian Ocean is the world’s third-largest ocean, cover-     well-being and prosperity of large populations.
ing 19.8 % of the water on the Earth’s surface. In contrast        The monsoon system also has a strong impact on the at-
to the Pacific and Atlantic oceans, it does not stretch from    mospheric composition over the Indian Ocean. During the
pole to pole but is enclosed on three sides by major land-      winter monsoon from December to February, continental
masses and an archipelago. The Indian Ocean is centered on      aerosols as well as man-made trace species and their reac-
the Indian Peninsula, which also forms the northern border      tion products dominate the chemical regime (Lelieveld et
together with Iran, Pakistan, and Bangladesh. In the west,      al., 2001). A layer of air pollution is visible on satellite pic-
the Indian Ocean is bounded by East Africa and the Arabian      tures as a brown haze hanging over much of South Asia and
Peninsula, while the eastern and southern boundaries are set    the Indian Ocean. This so-called Indian Ocean brown cloud
by Southeast Asia, Australia, and the Southern Ocean.           has been suggested to impact regional climate by mask-
    The countries bordering the Indian Ocean are home to        ing greenhouse-gas-induced surface warming (Ramanathan
one-third of the world’s population, accounting for approxi-    et al., 2005) and to affect monsoon rainfall.
mately 2.5 billion people (Roser et al., 2013). The economies      In contrast, clean air dominates the atmospheric composi-
of many Indian Ocean countries are expanding rapidly, with      tion over the Indian Ocean during the summer monsoon from
India being the fastest growing major economy in the world.     June to September, leading to a completely different chem-
Similarly, many Indian Ocean countries show rapid popula-       ical regime. Atmospheric pollutant levels over the Indian
tion growth, which is expected to further increase in the fu-   Ocean are low, and typical open-ocean background condi-
ture. Given the quickly growing populations and industries,     tions can be observed (Lawrence and Lelieveld, 2010). While
the Indian Ocean is becoming a pivotal zone of strategic po-    boreal summer conditions prevent the anthropogenic pollu-
litical competition. At the same time, the Indian Ocean hosts   tion from spreading across the Indian Ocean, an anticyclonic
a large variety of marine ecosystems including coral reefs,     circulation, centered at 200 to 100 hPa, offers an efficient
seagrass beds, and mangrove forests. Anthropogenic activ-       pathway for continental pollution into the global upper tro-
ities along the coastlines and climate change threaten bio-     posphere and lower stratosphere (UTLS) (e.g., Randel et al.,
diversity in the Indian Ocean, which contains 25 % of the       2010; Lelieveld et al., 2018).
Earth’s biodiversity hotspots (Mittermeier et al., 2011).          Finally, during the monsoon transition periods from April
    Growing populations also lead to rapidly increasing an-     to May and September to October, the offshore pollution is
thropogenic emissions. Burning conditions are often poorly      less strong due to weaker air mass transport from Southeast
controlled, for instance during biofuel burning in cookstoves   Asia and Africa over the Indian Ocean (Sahu et al., 2006).
and fossil fuel burning in vehicles (Li et al., 2017). To-

Atmos. Chem. Phys., 22, 6625–6676, 2022                                           https://doi.org/10.5194/acp-22-6625-2022
S. Tegtmeier et al.: Atmospheric gas-phase composition over the Indian Ocean                                                 6627

1.3   Early work                                                   the Arabian Peninsula, South Asia, Southeast Asia, and Aus-
                                                                   tralia as depicted in Fig. 1. This review focuses on three
The largest international scientific study exploring the impact    groups of atmospheric gases: (1) ozone and pollutants – car-
of South Asian emissions on the composition of the atmo-           bon monoxide (CO), nitrogen oxides (NOx ), sulfur dioxide
sphere over the Indian Ocean, the Indian Ocean Experiment          (SO2 ), ammonia (NH3 ), and mercury; (2) greenhouse gases –
(INDOEX), took place during the winter monsoon in 1999,            methane (CH4 ), nitrous oxide (N2 O), carbon dioxide (CO2 ),
with some pilot campaigns conducted during 1996–1997.              and carbonyl sulfide (COS); and (3) volatile organic com-
During the multi-platform field campaign, surprisingly high        pounds (VOCs) and short-lived biogenic gases – dimethyl-
pollution was detected over the entire northern Indian Ocean       sulfide (DMS), isoprene, and halogen compounds.
all the way to the Intertropical Convergence Zone (ITCZ).             Section 2 provides an overview of the physical processes
Scientific studies revealed that the nature of the pollution was   in the atmosphere and ocean that are relevant for the atmo-
considerably different from that in Europe or North America,       spheric composition. Section 3 will introduce all campaigns
with strongly enhanced carbon monoxide concentrations re-          and measurements that are the basis for scientific studies
lated to widespread biofuel use and agricultural burning (e.g.,    published after 2010 and discussed here. Regional sources
Lelieveld et al., 2001). Other large pollution sources based       and sinks of greenhouse gases, pollution, and biogenic trace
on fossil fuel combustion and biomass burning were linked          gases will be given in Sect. 4. Short introductions to all gases
to high loads of sunlight-absorbing aerosols with potential        listed above, including their role in the atmosphere, can also
consequences for the regional atmospheric energy balance           be found in Sect. 4. The focus of Sect. 5 is on our current
(Ramanathan et al., 2002). A few years before INDOEX, the          knowledge of the atmospheric composition over the Indian
Joint Global Ocean Flux Study (JGOFS) India investigated           Ocean and how it is driven by physical processes and re-
the factors controlling carbon fluxes in the Arabian Sea and       gional sources. We will present a synthesis of the scientific
led to estimates of CO2 emissions to the atmosphere for this       progress made after 2010 in Sect. 6, where we will also dis-
region (Sarma et al., 2003).                                       cuss the global and local impacts of the Indian Ocean atmo-
   The INDOEX findings, presented in many scientific pub-          spheric composition. An outlook and a summary of current
lications, drew attention to this region and several projects      knowledge gaps are given in Sect. 7. A key for all abbrevia-
and campaigns followed over the next decade. The Bay of            tions used in this paper is provided in Appendix A.
Bengal Experiment (BOBEX) research cruise during Febru-
ary to March 2001 detected high ozone and pollution levels
over the Bay of Bengal and linked them to transport from           2     Physical processes
the continent (Naja et al., 2004; Lal et al., 2006). The south-
ern Indian Ocean was explored during the Pilot Expedition          2.1     Atmospheric processes
to the Southern Ocean (PESO) research cruise from January          The South Asian monsoon circulation dominates the trans-
to April 2004, which revealed much cleaner air masses with         port patterns and regional meteorology over the Indian
smaller aerosol loadings in the region south of the ITCZ           Ocean. Strong seasonal circulation changes give rise to three
(Pant et al., 2009). Other research cruises, such as the Bay of    main meteorological regimes: the summer monsoon from
Bengal Processes Studies (BOBPS) during September to Oc-           June to September, the winter monsoon from November to
tober 2002, investigated oceanic productivity and nutrients in     March, and the transition periods from April to May and
relation to air–sea exchange of climate-active gases (Sardes-      from the end of September to October. Surface flow patterns
sai et al., 2007). A detailed overview of research cruises, is-    as well as seasonal transport regimes are described in the fol-
land measurements, and aircraft campaigns investigating the        lowing subsections, while a discussion of intraseasonal and
atmosphere over the Indian Ocean is given in Lawrence and          interannual variability can be found in Sect. S1 in the Sup-
Lelieveld (2010). The authors provide a comprehensive re-          plement.
view of the state of the art at this time by bringing together
observational and modeling studies.
                                                                   2.1.1    Near-surface flow patterns

1.4   Scope and organization of this study                         A detailed picture of the near-surface flow patterns is pro-
                                                                   vided in Fig. 1 in the form of seasonal mean surface wind
Here we will focus on recent progress in the field by giving       fields and sea level pressure derived from 2018–2019 ERA-
an overview of results published after 2010. We will synthe-       Interim reanalysis data. Seasonal mean plots here and in
size the current understanding of Indian Ocean gas-phase at-       the rest of the paper are shown for core monsoon and tran-
mospheric composition and explore how it is driven by emis-        sition periods, i.e., June to August (JJA) for the summer
sion sources, transport, and chemistry. Our region of interest     monsoon, December to February (DJF) for the winter mon-
encloses the Indian Ocean from 30◦ S to its northern conti-        soon, April to May (April–May) for the boreal spring tran-
nental borders and across its whole longitudinal range. It also    sition period, and October (October) for the boreal autumn
includes neighboring landmass such as parts of East Africa,        transition period. The equatorial and northern Indian Ocean

https://doi.org/10.5194/acp-22-6625-2022                                           Atmos. Chem. Phys., 22, 6625–6676, 2022
6628                                         S. Tegtmeier et al.: Atmospheric gas-phase composition over the Indian Ocean

Figure 1. Mean surface-level pressure (MSLP) and surface wind for (a) summer monsoon 2018 (June–August), (b) winter monsoon 2018–
2019 (December–February), (c) spring transition 2018 (April–May), and (d) autumn transition 2018 (October) from ERA-Interim.

(north of 10◦ S) is dominated by seasonally reversing mon-           ing a high-pressure system. The associated anticyclone cir-
soon winds (Schott and McCreary, 2001; Schott et al., 2009).         culation is tied to the outflow of the deep convection and
Southwest winds occur during the summer monsoon with                 is situated directly over highly polluted southern Asia. As
the low-pressure system of the ITCZ shifted north of 15◦ N           a result, distinct tracer anomalies have been observed in the
(Fig. 1a), while northeast winds occur during the winter mon-        anticyclone, indicating strong upward transport of pollution
soon with the low-pressure belt situated south of the Equator        from the surface (e.g., Randel et al., 2010). Given the dy-
(Fig. 1b). Over the southern Indian Ocean (south of 10◦ S),          namical confinement of tropospheric tracers and aerosols in
steady southeast trades prevail during all seasons but reach         the anticyclone, the Asian monsoon system provides a po-
further northward during the northern summer.                        tentially efficient pathway from the surface to the tropical
   The seasonally reversing monsoon winds and inter-                 UTLS. However, a significant fraction of the pollution can be
hemispheric pressure gradients over the equatorial Indian            removed from the air mass before entering the stratosphere
Ocean are a striking feature different from the other tropical       due to lightning-driven OH reactions in monsoonal convec-
oceans, where sustained easterly winds are found along the           tion (Lelieveld et al., 2018).
Equator. In contrast, equatorial winds over the Indian Ocean            During the winter monsoon, the prevailing northeasterly
are westerlies during the monsoon transition periods (Fig. 1c        winds reverse the meteorological situation. There is little rain
and d) and show a weak westerly annual mean component                over southern Asia, marking this as the “dry season”, and the
(Lamb and Hastenrath, 1979). These equatorial westerlies             missing convection chemically disconnects the surface layer
are driven by an interplay of an eastward pressure gradient          from the upper troposphere (Kunhikrishnan et al., 2004). In-
along the Equator, the latitudinal position of the flow recur-       stead, pollution outflow occurs in the marine boundary layer
vature, and the strength of the trade winds (Hastenrath and          (MBL) via offshore winds towards the northern Indian Ocean
Polzin, 2004).                                                       down to the Equator. Primary MBL flow channels have been
                                                                     identified in the western Arabian Sea, the eastern Arabian
2.1.2   Summer and winter monsoon                                    Sea just off the Indian west coast, the western Bay of Ben-
                                                                     gal, and Southeast Asia (Krishnamurti et al., 1997a, b; Verver
During the summer monsoon, steady onshore winds trans-               et al., 2001).
port air from the ocean over to the continent, where it results         Winter monsoon flow patterns are further complicated by
in deep convection and the well-known Indian summer mon-             effects of the land–sea breeze, which lofts coastal air masses
soon rains. Air masses experiencing fast upward transport in         above the MBL (Simpson and Raman, 2004). The associ-
convective updrafts converge in the upper troposphere, form-

Atmos. Chem. Phys., 22, 6625–6676, 2022                                               https://doi.org/10.5194/acp-22-6625-2022
S. Tegtmeier et al.: Atmospheric gas-phase composition over the Indian Ocean                                                6629

ated offshore flow above the MBL transports air masses over        nent leads to strong wintertime cooling in the northern Ara-
the coastal oceans, where they constitute the so-called “ele-      bian Sea. The strong summertime cooling in parts of the
vated layer”. Due to the relatively rapid outflow, the elevated    Arabian Sea instead is a combined result of latent heat loss
layer provides an additional effective mechanism for pollu-        caused by the strong southwesterly winds as well as up-
tion transport from the continents towards the Indian Ocean        welling and offshore advection from the Somali and Omani
(Lawrence and Lelieveld, 2010). As a result, outflow during        coasts. During boreal summer, upwelling-induced cooling
the winter monsoon occurs in two distinct layers, namely           off Somalia prevents atmospheric convection from the west-
the pollutant plume within the MBL (up to 800–1000 m)              ern Arabian Sea. From the eastern Arabian Sea to the South
and the elevated layer (1–3 km). Once over the northern In-        China Sea, north of the Equator, high SSTs promote atmo-
dian Ocean, the northeasterly trade winds transport the air        spheric deep convection (Schott et al., 2009).
masses towards the ITCZ, typical within 7–10 d (Ethé et al.,          The oceanic upwelling caused by strong monsoonal winds
2002). Similarly, over the southern Indian Ocean, southeast-       supplies nutrients to the surface layer, where they support el-
erly winds transport pristine boundary layer air masses north-     evated rates of primary productivity. This occurs mainly in
wards. At the ITCZ, these trade wind flows converge, and as-       the Arabian Sea, the Somali Basin, along the Indian coast,
sociated convection transports the air upwards into the upper      and in the northern Bay of Bengal, especially during summer
troposphere (Iyengar et al., 1999).                                months. The seasonal reversals in the boundary currents of
   Over the western part of the tropical Indian Ocean, the         the northern Indian Ocean, including the seasonal switching
ITCZ has been observed to occur simultaneously in two              from upwelling to downwelling circulations, have important
bands on either side of the Equator, forming the so-called         biogeochemical and ecological impacts that modify primary
double ITCZ (Meenu et al., 2007), throughout the year.             productivity, nutrient stoichiometry, oxygen concentrations,
Based on cloud characteristics and outgoing longwave radia-        and phytoplankton species composition (Hood et al., 2017).
tion, the most preferred latitudes for the northern and south-     In addition, transient upwelling due to seasonal variations of
ern bands of the ITZC were found to be around 5◦ N and 7.5         currents and mesoscale variability can give rise to episodi-
to 10◦ S.                                                          cally high levels of primary production throughout the Indian
                                                                   Ocean coastal waters.
2.2   Oceanic processes
                                                                   2.3     Long-term changes
The physical oceanography of the northern Indian Ocean re-
flects the seasonal changes in the monsoon cycle, including        2.3.1    Indian Ocean warming
impacts on currents, thermohaline circulation, sea surface         The Indian Ocean has warmed steadily over the past cen-
temperature (SST), salinity, and upwelling events, while the       tury, with an SST increase of 1 ◦ C during 1951–2015, which
equatorial and southern Indian Ocean does not experience           is markedly higher than the global average SST warming of
this influence. For more details about general Indian Ocean        0.7 ◦ C over the same period (Du and Xie, 2008; Han et al.,
physical processes, please see Schott et al. (2009) and ref-       2014; Krishnan et al., 2020). Overall, this Indian Ocean aver-
erences therein, Phillips et al. (2021) from this issue, and       aged warming rate is broadly consistent across observational
Sect. S2. In the following sections, we concentrate on how         products (Dong et al., 2014; Yao et al., 2016) and histor-
physical oceanography affects salinity, SST, and biological        ical simulations from the Coupled Model Intercomparison
productivity, which in turn play a major role in controlling       Project – Phase 5 (CMIP5). It can be largely attributed to an-
air–sea exchange and atmospheric composition, in particular        thropogenic forcing rather than natural external forcing, such
for biogenic trace gases such as bromoform (CHBr3 ), DMS,          as volcanic and solar variations (e.g., Dong et al., 2014). It
and isoprene                                                       has been shown that the basin-wide warming due to increas-
                                                                   ing greenhouse gases is slowed down by the indirect effects
Salinity, SSTs, and productivity                                   of anthropogenic aerosol (Dong and Zhou, 2014). In addi-
                                                                   tion to anthropogenic forcing, the sustained warming over
On seasonal timescales, freshwater input due to rainfall and       the Indian Ocean warm pool region is caused by local ocean–
river discharge is important for the salinity balance in the Bay   atmosphere coupled mechanisms, with their relative roles be-
of Bengal, and horizontal advection related to the monsoon         ing debated (e.g., Dong et al., 2014; Du and Xie, 2008). The
plays a dominant role in the northern Indian Ocean (Rao and        importance of the Indian Ocean in the global ocean heat bud-
Sivakumar, 2003; Da-Allada et al., 2015). In the southwest-        get was not recognized until the hiatus period at the begin-
ern tropical Indian Ocean, the freshwater flux due to precip-      ning of the 21st century, during which the abrupt increase in
itation is a major control on the salinity (Da-Allada et al.,      the upper Indian Ocean heat content served as a major sink
2015). The rainfall over the Indian Ocean shows a general          of the excessive heat entering the Earth system (e.g., Nieves
migration to the summer hemisphere following sunlight and          et al., 2015).
warm SSTs, highlighting their strong coupling. Conversely,
latent heat loss caused by cool, dry air from the Asian conti-

https://doi.org/10.5194/acp-22-6625-2022                                          Atmos. Chem. Phys., 22, 6625–6676, 2022
6630                                         S. Tegtmeier et al.: Atmospheric gas-phase composition over the Indian Ocean

   The Indian Ocean warming is not spatially homogeneous          last 2 decades. At the same time, an enhanced rainfall contri-
in models or observations. The western tropical Indian Ocean      bution has occurred due to a higher precipitation efficiency
has been warming for more than a century at a rate faster than    (K. Singh et al., 2016, 2019), possibly leading to a dry at-
any other region of the tropical oceans and is the largest con-   mosphere. Further changes in the Indian summer monsoon
tributor to the overall trend in the global mean SST (Roxy        rainfall are expected for the future, but current model projec-
et al., 2014). Positive SST anomalies in the western part of      tions give contradicting results (e.g., Roxy et al., 2015; Zou
the Indian Ocean have increased markedly since 1950, while        and Zhou, 2013).
negative events have been reduced (Cai et al., 2009). The            Changes in surface wind are expected to be moderate for
warming of the generally cool western Indian Ocean against        the first half of the 21st century, with a noticeable decline of
the rest of the tropical warm pool region (Roxy et al., 2014,     wind speed over the tropical Indian Ocean due to reduced
2015) and corresponding changes in the zonal SST gradi-           thermal land–sea contrasts. The southern extratropical re-
ent (Saha et al., 2014) have both been proposed as plausible      gion and Southern Ocean, on the other hand, are expected to
explanations for the observed decrease in Indian monsoon          show a significant strengthening of the wind fields by the end
rainfall over the last 3 decades. In addition, they have the      of the 21st century (Mohan and Bhaskaran, 2019). Ocean–
potential to alter the marine food webs in this biologically      atmosphere feedback that is not well represented and coarse
productive region.                                                model resolutions, however, are known to lead to large un-
   The Indian Ocean warming is projected to further increase      certainties in model estimates of wind speed changes (Anna-
over the course of the 21st century in response to unabated       malai et al., 2017; Mohan and Bhaskaran, 2019).
greenhouse gas emissions. By the end of the 21st century, the
strongest warming in the Arabian Sea and western equato-
rial Indian Ocean is consistently projected in CMIP models,       2.3.3   Salinity and productivity
which could yield more Arabian Sea cyclones and a further
decrease in monsoonal rains (Gopika et al., 2020).                Du et al. (2015) noted freshening in the southeastern tropi-
                                                                  cal Indian Ocean starting in the mid-1990s. Idealized model
2.3.2   Summer monsoon and precipitation
                                                                  experiments suggest that multidecadal changes in subsurface
                                                                  ocean salinity during 1950–2000 were due to isopycnal mi-
There are large uncertainties related to the variability in the   gration related to ocean surface warming (Lago et al., 2016).
South Asian summer monsoon in a changing climate. Sev-            However, the enhanced precipitation in the Maritime Con-
eral studies have debated whether the monsoon is weak-            tinent and the strengthening of the Indonesian Throughflow
ening or strengthening, as well as the mechanisms driving         are thought to be the likely causes of the freshening trend in
the changes (Roxy et al., 2015). According to a review by         the southeastern Indian Ocean since the early 2000s (Llovel
D. Singh et al. (2019), observational and modeling studies        and Lee, 2015; Hu and Sprintall, 2017).
have determined that the potentially weakened monsoon is             While Behrenfeld et al. (2006) indicate a reduction in net
due to a combination of forcings, such as land use and irriga-    primary productivity over most of the tropics as a result
tion changes, increased greenhouse gases, and anthropogenic       of surface thermal stratification, they have suggested an in-
aerosols. Roxy et al. (2015) provide compelling evidence          crease in primary productivity for the western Indian Ocean
that Indian Ocean warming potentially weakens the land–sea        from 1998 to 2004. Recent biogeochemical simulations of
thermal contrast and dampens the summer monsoon Hadley            the Arabian Sea ecosystem suggest that an intensification
circulation, leading to reduced rainfall over parts of South      of monsoon winds strongly increases ecosystem productiv-
Asia.                                                             ity, thereby amplifying the oxygen biological consumption
   The Indian Ocean is one of the greatest moisture sources,      and intensifying the oxygen minimum zone (OMZ) at depth
accounting for nearly one-third of the total net transport        (Lachkar et al., 2018). At the same time, the near-surface
of water toward the continents (Bengtsson, 2010). Both re-        area will experience increased ventilation due to the pre-
mote and local SST anomalies can induce hydrological cy-          dicted stronger winds. On the contrary, a review in this issue
cle changes over the Indian Ocean, affecting local and re-        summarizes evidence indicating a significant, but small, re-
mote precipitation. Han et al. (2019) showed that the mois-       duction in primary production in the northern Indian Ocean
ture sources (evaporation minus precipitation) in the tropical    (Löscher, 2021). An alarming decrease of up to 20 % in ma-
central-eastern and southwestern Indian Ocean experienced         rine phytoplankton during the past 6 decades has been identi-
a significant increase during boreal summer between 1979          fied in the western Indian Ocean (Roxy et al., 2016) driven by
and 2016. In addition, there has been a significant reduction     enhanced ocean stratification and suppressed nutrient mixing
in the annual frequency of tropical cyclones and their asso-      from subsurface layers. Gregg and Rousseaux (2019) also
ciated rainfall over the northern Indian Ocean since the mid-     conclude from the assimilation of ocean color satellite data
dle of the 20th century (Krishnan et al., 2020). In contrast,     (1998–2015) into an ocean biogeochemical model that the
the frequency of very severe cyclonic storms during the au-       decline in global ocean primary productivity of 2.1 % per
tumn transition season has increased significantly during the     decade is mainly driven by the northern and equatorial In-

Atmos. Chem. Phys., 22, 6625–6676, 2022                                            https://doi.org/10.5194/acp-22-6625-2022
S. Tegtmeier et al.: Atmospheric gas-phase composition over the Indian Ocean                                                6631

dian Ocean. Any changes to biological processes have the           centration cell sensors launched above Ahmedabad in west-
potential to alter trace gas cycling in the surface ocean.         ern India (Lal et al., 2014). The continuous dataset enabled
                                                                   studies of the impact of transport processes on the seasonal
3     Campaigns, station data, and satellite                       cycle and on the vertical distribution of ozone. The observa-
      measurements                                                 tion site in Trivandrum situated on the southwest coast of In-
                                                                   dia collected measurements of nitrogen oxides with a chemi-
A few Indian Ocean coastal or island stations have been oper-      luminescence NOx analyzer from 2007 to 2009 (David and
ated as part of long-term scientific measurement programs or       Nair, 2011).
operational air quality networks, providing limited area ob-
servations. In addition, intensive ship and aircraft campaigns
have been conducted for detailed investigations of atmo-           3.2     Satellite measurements
spheric processes during short episodes. These data can be         Satellite measurements of atmospheric composition over the
complemented by satellite observations of tropospheric com-        Indian Ocean have provided valuable information over the
position, which provide the large-scale picture for a number       last decades that allowed for studies of the overall distri-
of substances, albeit often with limited vertical resolution       bution and long-term changes in key substances. Most in-
and reduced accuracy for individual measurements. In this          struments used today apply passive remote sensing with ob-
section, we will give an overview of campaigns, station data,      servations being mainly done in nadir geometry. Here we
and satellite measurements that have been applied to study         will give a short overview of satellite instruments that pro-
the atmospheric composition over the Indian Ocean over the         vide measurements used in scientific studies of the Indian
last decade.                                                       Ocean atmosphere. In addition, we have compiled plots of
                                                                   the seasonal CO, NO2 , and CH4 surface distribution for this
3.1    Campaigns and station data                                  review article and will describe the respective satellite mea-
                                                                   surements in more detail.
Chemical, physical, and biogeochemical processes occurring
in and above the Indian Ocean have been explored during
various field campaigns. Here, all campaigns that have con-        3.2.1    Pollutants (NO2 ) from OMI and TROPOMI
tributed to the recent progress in the field and led to publica-
tions after 2010 are summarized in Table 1. It should be noted     The Ozone Monitoring Instrument (OMI) is a key instrument
that the ICARB multi-platform field experiment consisted of        on board NASA’s Aura satellite. OMI is a nadir-viewing,
three phases, with the first phase exploring composition in        wide-field-imaging spectrometer that measures backscat-
the spring transition season of 2006 (ICARB), a second phase       tered radiances at a spectral resolution of 0.42–0.63 nm (Lev-
taking place during the winter monsoon of 2008–2009 (re-           elt et al., 2006). Its wide field of view of 114◦ with a swath
ferred to as W_ICARB) supplemented by aircraft measure-            width of 2600 km yields daily global coverage with a spatial
ments, and a third phase during the winter monsoon of 2018         resolution of 13 km × 24 km (Liu et al., 2010). OMI mea-
(referred to as ICARB-218).                                        sures ozone profiles as well as other key air quality compo-
   In addition to dedicated campaigns, some island and             nents such as NO2 , SO2 , and aerosol characteristics. In this
coastal stations have conducted long-term measurements that        article, we use the OMI tropospheric NO2 column product
provide valuable information about the atmospheric compo-          from 2003 to 2020 to analyze long-term changes over dif-
sition over the Indian Ocean.                                      ferent coastal and open-ocean regions of the Indian Ocean
   CO2 surface flask measurements from the Cape Rama site          (Sect. 6).
on the Indian coastline have been used to analyze the distri-         The TROPOspheric Monitoring Instrument (TROPOMI)
bution and variability of CO2 over this region for 2009–2012       is a nadir-viewing imaging spectrometer on board the Coper-
(Nalini et al., 2018). Measurements of CH4 , another impor-        nicus Sentinel-5 Precursor satellite, which was launched in
tant greenhouse gas, and the pollutant CO are available from       October 2017 for a mission of 7 years. The satellite has a sun-
ground-based in situ cavity ring-down spectroscopy analyz-         synchronous orbit achieving nearly full surface coverage on
ers and Fourier transform infrared spectrometers at two sites      a daily basis. TROPOMI contains four spectrometers, with
on Reunion Island in the southern Indian Ocean (Zhou et al.,       three covering the ultraviolet and near-infrared wavelengths
2018). These multi-annual time series (2011–2017) allowed          and one for the shortwave infrared range. Key atmospheric
investigating the impact of emissions from biomass burning         species observed by TROPOMI include ozone, NO2 , SO2 ,
in Africa and South America on atmospheric pollutant lev-          CO, and aerosol properties. The TROPOMI tropospheric
els over the Indian Ocean. CO surface data are also available      NO2 column product (Boersma et al., 2018) shows improved
from the NOAA/ESRL Global Monitoring Division network              spatial resolution compared to previous versions. The NO2
station in Mahé (Wai et al., 2014).                                retrieval algorithm is based on the NO2 DOMINO retrieval
   In situ tropospheric ozone measurements were collected          previously used for OMI spectra with improvements made
from 2003 to 2007 from balloon-borne electrochemical con-          for all retrieval steps. In this article, we use the TROPOMI

https://doi.org/10.5194/acp-22-6625-2022                                           Atmos. Chem. Phys., 22, 6625–6676, 2022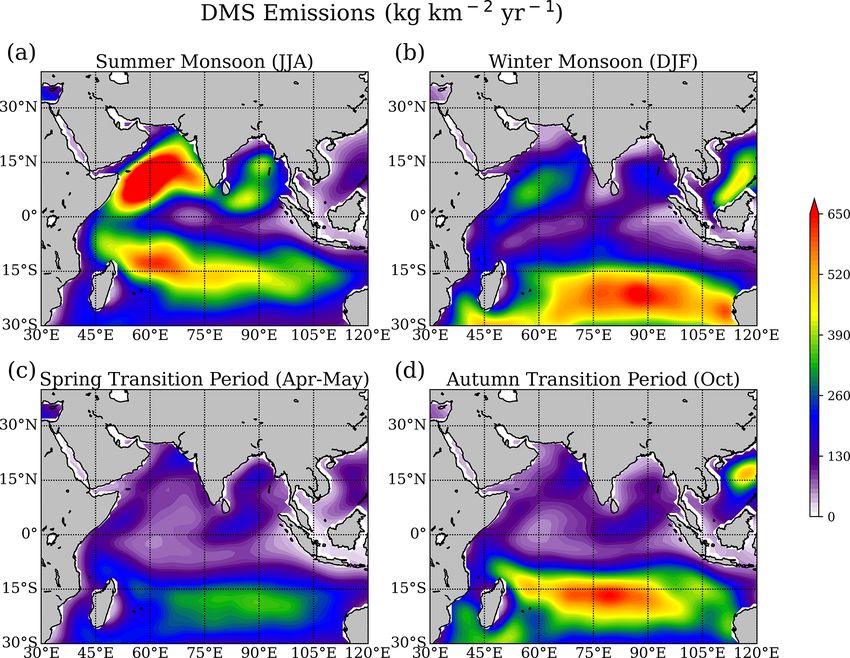
6632                                           S. Tegtmeier et al.: Atmospheric gas-phase composition over the Indian Ocean

Table 1. Summary of campaigns in the Indian Ocean for the 21st century.

  Campaign                  Time                   Region             Objective                                  Reference
  ARMEX                     2002                   Arabian Sea        Study of reactive halides released         Ali et al. (2009)
  (Arabian Sea Monsoon      June–August                               from sea salt aerosols and their role in
  Experiment)                                                         ozone chemistry
  PESO                      2004                   Southern Indian    Multidisciplinary expeditions to           Pandey et al. (2006)
  (Pilot Expedition         January–April          Ocean              understand the forcing mechanisms
  to the Southern Ocean)                                              behind widely geographically separated
                                                                      climate change
  ISOE 1–11                 Since 2004             Southern Indian    Identify role and response of the          ISOE Reports
  (1st–11th Indian South-                          Ocean              Southern Ocean to regional and             Mahajan et al.
  ern Ocean Expedition)                                               global climate variability (emissions of   (2019a, b), Inamdar
                                                                      trace gases since ISOE 8)                  et al. (2020)
  ICARB                     2006                   Indian mainland,   Characterize the physicochemical           Moorthy et al.
  (Integrated Campaign      March–May;             northern Indian    properties and radiative effects of        (2008), David et al.
  for Aerosols, gases and   2008/2009              Ocean, Bay of      atmospheric aerosols and trace gases       (2011)
  Radiation Budget)         December–              Bengal             over the Indian landmass and the
                            January;                                  adjoining oceanic regions
                            2018
                            January–February
  Sagar Kanya cruise        2009                   Bay of Bengal      Understand the gaseous atmospheric         Girach et al. (2017)
  during the CTCZ           July–August                               boundary layer composition over the
  (Continental Tropical                                               Bay of Bengal during the summer
  Convergence Zone)                                                   monsoon season
  experiment
  Campaign aboard the       2010                   Bay of Bengal      Analyze atmospheric composition over       Mallik et al. (2013)
  ocean research vessel     October–November                          the Bay of Bengal and how it is driven
  Sagar Kanya (SK-277)                                                by air mass origin from Indian Ocean,
                                                                      Southeast Asia, and the Indian
                                                                      subcontinent
  OASIS                     2014                   West Indian        Investigate oceanic emissions of very      Fiehn et al. (2017),
  (Organic VSLS and         July–August            Ocean              short-lived substances and their           Zavarsky et al.
  their air–sea exchange                                              transport and chemistry from the           (2018b)
  from the Indian Ocean                                               tropical Indian Ocean to the
  to the Stratosphere)                                                atmosphere, in particular to the
                                                                      stratosphere
  OMO                       2015                   Indian Ocean       Identify atmospheric impacts of            Lelieveld et al.
  (Oxidation Mechanism      July–August            and the            associated air pollution emissions at      (2018)
  Observations aircraft                            Mediterranean      regional and global scales during the
  campaign)                                                           South Asian summer monsoon
  IIOE-2                    2015–2020              Indian Ocean       Advance Indian Ocean initiatives and       Hood et al. (2016)
  (Second International                                               projects addressing emerging scientific
  Indian Ocean                                                        issues of the Indian Ocean in the 21st
  Expedition)                                                         century
  AQABA                     2017                   Mediterranean      Study air quality and climate change in    Bourtsoukidis et al.
  (Air Quality and          July–August            and Arabian        the Arabian Basin                          (2019)
  climate change in the                            Peninsula
  Arabian BAsin)

Atmos. Chem. Phys., 22, 6625–6676, 2022                                                 https://doi.org/10.5194/acp-22-6625-2022
S. Tegtmeier et al.: Atmospheric gas-phase composition over the Indian Ocean                                                 6633

Level 2 NO2 tropospheric column data product to show its           3.2.4   Pollutants (NO2 ) from GOME and SCIAMACHY
distribution and seasonal variations (Sect. 5.1).
                                                                   The Global Ozone Monitoring Experiment (GOME) is
                                                                   a UV–visible spectrometer on the European polar sun-
3.2.2   Pollutants (CO) from MOPITT                                synchronous orbiting satellite ERS-2 launched in April 1995.
The Measurements of Pollution in the Troposphere (MO-              It measures in the 230–800 nm wavelength range, with a
PITT) instrument is on board NASA’s Earth Observing                spectral resolution of 0.2–0.4 nm, and obtains global cov-
System Terra spacecraft, measuring tropospheric CO since           erage at the Equator after 3 d (Burrows et al., 1999). Prob-
March 2000. The satellite is in a sun-synchronous polar orbit      lems with tape storage on ERS-2 led to the replacement
of 705 km, allowing the instrument to make measurements in         of GOME by the Scanning Imaging Absorption Spectrom-
a 612 km cross-track scan with a footprint of 22 km × 22 km,       eter for Atmospheric Chartography (SCIAMACHY), which
providing global coverage every 3 d. The MOPITT mea-               was launched in 2002 on the European ENVISAT platform.
surements provide vertical profiles and total columns of           It measures in the spectral range 240–2380 nm (Bovens-
CO, which are useful to analyze the distribution, transport,       mann et al., 1999). Both instruments provide measurements
sources, and sinks on a global scale. CO retrieval products        of the mean columnar amount of tropospheric NO2 , facili-
are generated with an iterative optimal-estimation-based re-       tating studies of its variations and long-term changes over
trieval algorithm based on the MOPITT calibrated radiances         the Indian subcontinent (Ghude et al., 2013; Mahajan et al.,
and a priori knowledge of CO variability. The recently re-         2015a).
leased version 8 (V8) products benefit from updated spec-
troscopic information used in the radiative transfer model         4   Regional sources and sinks
and improved methods for radiance bias corrections (Deeter
et al., 2019). In this article, we use MOPITT V8 Level 3           Atmospheric composition over the Indian Ocean is known to
monthly data (near and thermal infrared radiances) with day        be impacted by the trace gas outflow from the surrounding
and night retrievals averaged to analyze the seasonal varia-       continental landmasses, long-range transport, and regional
tion of the surface CO distribution (Sect. 5.1).                   oceanic air–sea fluxes (Lawrence and Lelieveld, 2010). Here,
                                                                   we describe the distribution, seasonality, and trends of conti-
3.2.3   Greenhouse gases (CH4 and CO2 ) from GOSAT
                                                                   nental and oceanic trace gas emissions important for the at-
                                                                   mospheric composition over the Indian Ocean. Our study re-
The Greenhouse Gases Observing Satellite (GOSAT/Ibuki)             gion includes East Africa, the Middle East, South Asia, East
is a sun-synchronous polar orbit satellite that measures CO2       Asia, and Southeast Asia and is depicted in Fig. 2.
and CH4 from the stratosphere to the Earth’s surface. The             We use the latest versions of the Emissions Database for
retrieval precision for CO2 is smaller than 3.5 ppm (Yoshida       Global Atmospheric Research (EDGAR) to present conti-
et al., 2011) utilizing the Thermal and Near-Infrared Sensor       nental pollution and greenhouse gas emissions over the last
for the Carbon Observation–Fourier Transform Spectrome-            2 decades. For air pollutants, EDGAR v5.0_AP for the period
ter, which operates in the shortwave and thermal emission          1970–2015 is available (Crippa et al., 2020), and for green-
bands. The GOSAT Level 3 product at a horizontal resolu-           house gases EDGAR v5.0_GHG for the period 1970–2015
tion of 2.5◦ × 2.5◦ has data gaps over the globe, including a      (Crippa et al., 2019a) can be used. The EDGAR datasets
major portion of the Indian region during the monsoon sea-         include continental emissions from the energy sector (i.e.,
son, due to its limitation in retrieving CO2 in the presence of    power industry), industrial processes (i.e., manufacturing, in-
clouds. This is rectified in the Level 4 product that uses the     dustrial combustion), the transport sector (i.e., road trans-
Atmospheric Tracer Transport Model to incorporate ground-          port, aviation), residential sources (small-scale combustion
based observations and achieves a better distribution of CO2       and waste treatment), and agriculture. Exhausts from ship
over the Indian Ocean (Nalini et al., 2018).                       engines as one of the major sources of air pollution over the
   Observations from the Thermal and Near-Infrared Sen-            open ocean are also included in the EDGAR emissions. The
sor for carbon Observation–Fourier Transform Spectrome-            datasets are given at a high spatial resolution of 0.1◦ × 0.1◦ .
ter (TANSO-FTS) on board GOSAT in the thermal infrared             The results shown in this section focus on the main pollu-
(TIR) provide CH4 profile information. While the sensitiv-         tants CO, NOx , and SO2 and the greenhouse gases CH4 ,
ity of the observations is relatively low near the surface,        N2 O, and CO2 . We also briefly discuss mercury emissions.
the GOSAT/TANSO-FTS TIR instrument has been shown to               The most recent year for which data are given (the year 2015
have sufficient sensitivity to provide CH4 information at the      for both air pollutants and greenhouse gases) is used here to
top of the boundary layer for the Indian subcontinent and In-      present emission strength and patterns representative for the
dian Ocean region (Belikov et al., 2021). In this article we use   last decade. Emission changes are calculated for the time pe-
GOSAT/TANSO-FTS CH4 version 1 (V1) Level 2 CH4 data                riod 2000–2015 and are shown in relative terms compared
at 800 hPa averaged over 2009–2014 to analyze the seasonal         to the emissions in 2000. Emissions are averaged over East
variation of the boundary layer CH4 distribution (Sect. 5.2).      Africa, the Middle East, South Asia, East Asia, and Southeast

https://doi.org/10.5194/acp-22-6625-2022                                           Atmos. Chem. Phys., 22, 6625–6676, 2022
6634                                          S. Tegtmeier et al.: Atmospheric gas-phase composition over the Indian Ocean

Figure 2. Annual mean CO emissions for 2015 (a) and relative change with respect to 2000 (b) from EDGAR V5.0_AP.

Asia for a direct comparison of the regional contributions as       is a pollutant which plays an important role in the formation
well as the text and tables.                                        of particulate matter, as well as in acidification and eutroph-
   The ocean is an important source and sink to and from the        ication of ecosystems (Lelieveld et al., 2015; Bauer et al.,
atmosphere for many of the same gases mentioned above,              2016).
as well as other climate-active and chemically active com-             The distributions of CO, NOx , and SO2 emissions are
pounds, such as DMS, isoprene, and halogen species. Be-             shown in Figs. 2, 3, and 4, respectively. One of the com-
low we will describe the net ocean fluxes of CO, CH4 , CO2 ,        mon features of the spatial distribution of these emissions is
N2 O, VOCs, DMS, isoprene, and CHBr3 as obtained from               that they generally coincide with the population distribution
recent publications, placing special attention on monsoon-          such that high emissions appear in densely populated areas.
related variability.                                                In East Asia, high-emission areas include northern China,
                                                                    the Yangtze River delta, Sichuan Basin, and Korea. In South
                                                                    Asia, high emissions are distributed throughout northern In-
4.1    Pollutants                                                   dia, Nepal, the southern point of India, and Bangladesh. In
                                                                    Southeast Asia, high emissions appear around some major
Among atmospheric pollutants, CO is considered to be one of
                                                                    cities including Bangkok, Hanoi, and Ho Chi Minh City, as
the most important gases as it is highly toxic at elevated con-
                                                                    well as Java. Similar to Southeast Asia, high-emission re-
centrations. Due to its intermediate lifetime of a few months
                                                                    gions in East Africa are also around major cities like Kam-
(Seinfeld and Pandis, 2006), CO is much more variable in the
                                                                    pala, Nairobi, and Addis Ababa. In the Middle East, high-
troposphere than other atmospheric constituents with longer
                                                                    emission regions are distributed around the Persian Gulf.
lifetimes and is often used as a transport tracer. CO has an in-
                                                                    Among the different source regions, East Asia and South
direct radiative effect, since it scavenges the hydroxyl radical
                                                                    Asia are main emitters. In 2015, the two regions accounted
(OH), the cleaning agent of the atmosphere that would other-
                                                                    for 41 % (East Asia) and 27 % (South Asia) of the total CO
wise destroy the greenhouse gases CH4 and O3 (Daniel and
                                                                    emissions discussed here. East Asia is also a large emitter of
Solomon, 1998). Another important pollutant is the family of
                                                                    NOx (54 %) and SO2 (57 %).
nitrogen oxides (NOx ) consisting of nitrogen dioxide (NO2 )
                                                                       It is well known that pollution sources from Asia are char-
and nitrogen oxide (NO). Tropospheric NOx acts as a precur-
                                                                    acterized by inefficient combustion processes during biofuel
sor for a number of harmful secondary air pollutants such as
                                                                    and fossil fuel burning. For instance, the burning of biofu-
ozone and particulate matter and plays a role in the forma-
                                                                    els such as wood, dung, and agricultural waste accounts for
tion of acid rain. Breathing in raised levels of NO2 can cause
                                                                    18 % of all CO emissions in Southeast Asia. Globally it only
respiratory problems independently of negative health effects
                                                                    accounted for ∼ 9 % of all CO emissions in 2015, highlight-
of other secondary pollutants. SO2 is another key component
                                                                    ing the role of biofuel burning in regions around the Indian
of gaseous air pollution. As for NO2 , exposure to SO2 can
                                                                    Ocean. Inefficient combustion processes also occur during
harm the human respiratory system. In addition, SO2 can re-
                                                                    fossil fuel burning at lower temperatures and result in rela-
act with other compounds in the atmosphere to form small
                                                                    tively low NOx emissions and higher CO / CO2 ratios when
particles that contribute to particulate matter pollution. If ox-
                                                                    compared to other industrialized areas around the globe. In-
idized within airborne water droplets, SO2 produces sulfuric
                                                                    complete fossil fuel combustion from the residential sector
acid, which can be transported by wind over many hundreds
                                                                    and road transportation are the two main sources contribut-
of kilometers and deposited as acid rain. Atmospheric NH3

Atmos. Chem. Phys., 22, 6625–6676, 2022                                              https://doi.org/10.5194/acp-22-6625-2022
S. Tegtmeier et al.: Atmospheric gas-phase composition over the Indian Ocean 6635 Figure 3. Annual mean NOx emissions for 2015 (a) and relative change with respect to 2000 (b) from EDGAR V5.0_AP. Figure 4. Annual mean SO2 emissions for 2015 (a) and relative change with respect to 2000 (b) from EDGAR V5.0_AP. ing to CO production, accounting for 29.5 % and 29.0 % of ship emissions can lead to substantial ozone enhancements all CO emissions in our study region in 2015. and in turn to higher OH concentrations (Endresen et al., NOx emissions mainly stem from high-temperature com- 2003). bustion. Energy production, manufacturing industries, and Over the period 2000–2015, the emissions of all pollu- road transportation caused 30.7 %, 25.8 %, and 25.6 % of tants increased in almost all regions around the Indian Ocean, all NOx emissions in our study region in 2015, respec- with CO emissions changing from 275.9 to 350.3 Tg yr−1 , tively. Manufacturing industries and energy (electricity and NOx from 35.3 to 58.3 Tg yr−1 , and SO2 from 41.8 to heat production) are also the two main contributors to SO2 61.1 Tg yr−1 . Between 2000 and 2015, CO emissions par- emissions, accounting for 41 % and 40 %, respectively, of ticularly increased along the Mekong River, north of the all SO2 emissions in our study region in 2015. As per the Persian Gulf, in Afghanistan, and in East Africa, while CO 2000 Asian emission inventory, India has the second-highest emissions in most regions of East Asia decreased despite a SO2 emission (14 %) after China (65 %) with coal-burning comparably low overall increase (15 %, Table 2, Fig. 2b). power plants contributing to around half (47 %) of the emis- NOx emission increases show a different pattern and are rel- sions in India (Kurokawa et al., 2013). About 40 % of the atively high in most regions around the Indian Ocean, with thermal plants in India are located over the Indo-Gangetic peaks in East Asia, South Asia, and East Africa (Fig. 3b). Plain, causing relatively high SO2 emissions from this re- SO2 emission changes show a similar distribution as the gion (Fig. 4; Aswini et al., 2020). In addition, ship traffic NOx changes, with peaks along the Mekong River and in leads to anthropogenic NOx and SO2 emissions directly over East Africa (Fig. 4b). Ship traffic in the Indian Ocean saw the open ocean with emissions concentrated along the ma- the largest increase worldwide between 1992 and 2012, es- jor shipping lanes (e.g., Franke et al., 2009). In general, NOx pecially on well-defined shipping lanes, such as the Red https://doi.org/10.5194/acp-22-6625-2022 Atmos. Chem. Phys., 22, 6625–6676, 2022
6636                                           S. Tegtmeier et al.: Atmospheric gas-phase composition over the Indian Ocean

Table 2. Emissions of CO, NOx , and SO2 from different regions in 2015 and their increase with respect to 2000.

                                                Emission in 2015 (increase with respect to 2000)
                East Africa            Middle East            South Asia              East Asia              Southeast Asia
       CO       26.5 Tg yr−1 (40 %)    16.8 Tg yr−1 (18 %)    94.0 Tg yr−1 (50 %)     144 Tg yr−1 (15 %)     68.9 Tg yr−1 (25 %)
       NOx      0.89 Tg yr−1 (76 %)    7.27 Tg yr−1 (65 %)    12.5 Tg yr−1 (101 %)    31.4 Tg yr−1 (56 %)    6.28 Tg yr−1 (54 %)
       SO2      0.43 Tg yr−1 (67 %)    7.55 Tg yr−1 (54 %)    13.1 Tg yr−1 (120 %)    34.6 Tg yr−1 (29 %)    5.42 Tg yr−1 (40 %)

Sea–Arabian Gulf–Asia route or the Asia–Cape Town route                   The atmospheric pollutant mercury is transported around
(Tournadre, 2014). The overall increase in pollutant emis-             the globe as gaseous elemental mercury, eventually oxidiz-
sions shows pronounced variations from region to region (Ta-           ing to divalent mercury. The latter is known to deposit to
ble 2), with the highest rate of increase in emissions for all         the surface from where it can be taken up into food webs
three pollutants found in South Asia.                                  and transformed to highly toxic species endangering humans
   In particular, for the time period after 2012, satellite mea-       and ecosystems (Selin et al., 2007). Atmospheric mercury
surements have shown pronounced regional SO2 and NO2                   is released from anthropogenic activities, such as coal-fired
pollution changes. A decrease in SO2 pollution from the                power plants, metal smelting, and waste incineration (Pacyna
North China Plain has been noted since 2011 as a result                and Pacyna, 2005; Streets et al., 2005). Emissions associated
of government efforts, while SO2 and NO2 emissions from                with artisanal and small-scale gold mining account for al-
India have continued to grow at a fast rate (Krotkov et al.,           most 38 % of the global total emission (UN-Environment,
2016). Recent emission estimates suggest that during 2013–             2019). Mercury is also emitted from the oceans, soils, ter-
2017, anthropogenic emissions from China decreased by                  restrial vegetation, and biomass burning. These mostly nat-
23 % for CO, 21 % for NOx , and 59 % for SO2 as a con-                 ural emissions include some anthropogenic fraction related
sequence of the implementation of active clean air policies            to the recycling of previously deposited mercury (Mason and
(Zheng et al., 2018).                                                  Sheu, 2002). Based on 2015 inventories, Asia is responsi-
   Unfortunately, measurements of oceanic CO emissions                 ble for a large part of the emissions (49 %), which primar-
from the Indian Ocean are sparse. We only know of unpub-               ily stem from East and Southeast Asia. While emissions in
lished datasets (D. Arevalo-Martinez, personal communica-              North America and the European Union have shown moder-
tion) from one GEOMAR campaign (OASIS) and a series                    ate decreases, increased economic activity, notably in Asia,
of NASA–SAGA cruises (https://gml.noaa.gov/hats/ocean/,                and the use and disposal of mercury-added products led to
last access: 1 July 2021, eastern open Indian Ocean, summer            a global increase of approximately 20 % between 2010 and
1987). Net fluxes covering the northern to southern extent of          2015 (UN-Environment, 2019).
the Indian Ocean range from ∼ 0.1 to ∼ 1.4 Mg km−2 yr−1 ,                 For NH3 , East Asia and South Asia are the two main con-
as CO is always supersaturated in the surface ocean (Conte             tributors, which account for 38.9 % and 32.3 % of the to-
et al., 2019, and references therein). These values are sim-           tal emissions, respectively (not shown here). From 2000 to
ilar to ship emissions but considerably smaller than con-              2015, emissions of NH3 in the regions around the Indian
tinental emissions (Fig. 2). CO is produced in the surface             Ocean documented by EDGAR increased by 22.5 %. Agri-
ocean from organic material photochemistry and biological              cultural activities dominate the ammonia emissions, with
processes (Conte et al., 2019). Available data from the west-          about 56.7 % and 18.4 % of the emissions coming from di-
ern Indian Ocean suggest that the most significant meridional          rect soil emission and manure management. Besides, long-
gradients occur due to open-ocean upwelling at 5–10◦ S. CO             term satellite measurements (van Damme et al., 2018) show
emissions are high from 5–15◦ S, but to the north and south            other hotspots of ammonia emission not well represented in
of this region, emissions decrease to zero with seasonal vari-         the EDGAR inventory, most of which are associated with ei-
ations occurring due to upwelling changes. In the eastern In-          ther high-density animal farming or industrial fertilizer pro-
dian Ocean, seasonal variability is expected in association            duction.
with surface productivity changes in the Seychelles–Chagos
thermocline ridge. However, no seasonal cycle can be de-               4.2   Greenhouse gases
tected in available measurements from this region, and it is
not clear if this is a real feature or caused by the lack of data.     CO2 concentrations have been increasing steadily over the
Additional variability is expected in coastal regions, since           last decades, reaching a new annual global mean record high
large amounts of seasonally discharged runoff supply terres-           in 2020 of 412.5 ± 0.1 ppm (Blunden and Boyer, 2020). Due
trial organic material that serves as a precursor to CO marine         to its high atmospheric abundance and long atmospheric life-
photoproduction.                                                       time, CO2 is the most important of Earth’s long-lived green-
                                                                       house gases. In addition to its impact on climate, CO2 is

Atmos. Chem. Phys., 22, 6625–6676, 2022                                                  https://doi.org/10.5194/acp-22-6625-2022
You can also read