AT WHAT COST? STUDENT LOAN DEBT IN THE BAY AREA - APRIL 2019
←
→
Page content transcription
If your browser does not render page correctly, please read the page content below
AT WHAT COST?
STUDENT LOAN
DEBT IN THE
BAY AREA
APRIL 2019

ABOUT THE AUTHORS

THE FEDERAL RESERVE BANK OF SAN FRANCISCO
The Federal Reserve Bank of San Francisco (SF Fed) promotes low inflation, full employment
and financial stability and serves the Twelfth Federal Reserve District, which includes the nine
western states—Alaska, Arizona, California, Hawaii, Idaho, Nevada, Oregon, Utah, and
Washington—plus American Samoa, Guam, and the Commonwealth of the Northern Mariana
Islands. The SF Fed’s community development team works with a wide range of organizations
to create economic opportunity for lower income Americans by developing and connecting
best practices and emerging ideas with organizations positioned to make meaningful change
in communities.
Bina Patel Shrimali, DrPH was the contributing author from the SF Fed.
Learn more at www.frbsf.org/community-development

THE SAN FRANCISCO TREASURER’S OFFICE OF FINANCIAL EMPOWERMENT
The Office of Financial Empowerment (OFE) is a unique private-public partnership housed
within the Office of the Treasurer & Tax Collector of San Francisco that convenes, innovates
and advocates to strengthen economic security and mobility of all San Franciscans. For more
than a decade, under the leadership of Treasurer José Cisneros, the OFE has engaged partners
inside and outside City Hall to equip San Franciscans with knowledge, skills and resources to
strengthen their financial health and well-being. At the same time, the OFE has leveraged
what has worked on the ground to model what is possible across the country.
Jacob DuMez, MPP and Sarika Abbi, MPA were contributing authors from OFE.
Learn more at https://sfgov.org/ofe/

The views expressed are those of the authors and not necessarily those of the Federal Reserve Bank
of San Francisco or the Federal Reserve System.

ACKNOWLEDGEMENTS
This report was inspired by the 2017 report “Student Loan Borrowing Across NYC
Neighborhoods,” co-authored by the Federal Reserve Bank of New York (FRBNY) and the New
York City Department of Consumer Affairs (DCA). We wish to thank Joelle Scally (FRBNY),
Zayne Abdessalam (DCA), and Nichole Davis (DCA) for their guidance; Laura Choi (SF Fed),
Laurel Gourd (SF Fed), Jessica Thompson (TICAS) and Mike Pierce (Student Borrower
Protection Center) for their review and advice; and Brian Walker for design support.

CONTENTS

Executive Summary ...................................................................................................................... 1
Data And Methodology ............................................................................................................... 3
Introduction .................................................................................................................................. 4
Student Debt Burden ................................................................................................................... 6
   Student Loan Debt Burden Has Increased Significantly for Bay Area Borrowers Since 2003 .. 6
   Growing Student Loan Debt Creates a Burden for Borrowers and Communities.................... 9
Borrowing .................................................................................................................................... 10
   Who Has Student Debt in the Bay Area? .................................................................................. 10
   How Much Do Borrowers Owe? ............................................................................................... 13
Which Bay Area Borrowers Are In Distress? ............................................................................ 16
   Delinquency .............................................................................................................................. 16
   Default ....................................................................................................................................... 20
   Recent Research Paints a Troubling Picture of Student Loan Default .................................... 26
   Many More Borrowers Have Defaulted at Least Once Since 2003 .......................................... 26
   Higher Default Rates in Neighborhoods with High Percentages of Black and Hispanic
   Residents ................................................................................................................................... 28
   Who is Paying Down Their Loan Balances?.............................................................................. 30
   How are Older Borrowers Managing Student Loan Debt? ...................................................... 33
Student Loan Borrowing And Repayment in the Bay Area ................................................... 35
   Who Has Student Debt In San Francisco? ................................................................................ 36
   How Much do San Francisco Borrowers Owe? ........................................................................ 38
   Delinquency .............................................................................................................................. 40
   Default ....................................................................................................................................... 42
Conclusion ................................................................................................................................... 47
Endnotes ...................................................................................................................................... 49
EXECUTIVE SUMMARY
This report provides an in-depth look at student loan borrowing in the nine-county San
Francisco Bay Area.* As of March 1, 2018, approximately 735,000 Bay Area student loan
borrowers (12.2 percent of the adult population) owed a collective $26.6 billion in student
debt, with an average balance of $36,243. Nationally, total student loan debt climbed to $1.46
trillion by the end of 2018, more than doubling in size in the past decade, making it now the
second largest source of consumer debt.1
Although the Bay Area has a lower prevalence of student loan debt than California (13.9
percent) or the U.S. (17.9 percent), our research finds that Bay Area and even county-level
trends mask dramatic disparities among communities throughout the region. Analyzing
student loan debt at the zip code level finds wide variance in borrowing and loan balances,
and considerably higher delinquency and default in low-income communities and
communities of color.
Key findings include:
Student loan burden has increased considerably in the past 15 years. Adjusting
for inflation, total student debt in the Bay Area increased by 243 percent between
2003 and 2018, with the percentage of the adult population with student loan debt
nearly doubling from 6.2 percent to 12.2 percent and median balance increasing by
27.8 percent, from $13,685 to $17,489 in 2018 dollars. At the same time, the borrower
delinquency rate increased by 60 percent, from 7.4 percent to 11.8 percent, and the
default rate increased by 135 percent, from 3.8 percent to 9.1 percent.**
Borrowers in low-income neighborhoods experience higher rates of delinquency
and default. Twenty percent of borrowers in the lowest income neighborhoods are
90 days or more delinquent on their loans, with three quarters of these borrowers in
default. In the lowest income neighborhoods, only 37.1 percent of borrowers are
successfully making payments that reduce their student loan balances, compared to
53.8 percent of borrowers in the highest income neighborhoods.
Borrowers with low student loan balances experience higher levels of
delinquency and default. Approximately half of all Bay Area student loan borrowers
in default owe less than $15,000, and nearly one in five defaulted borrowers owe less
than $5,000. The median loan balance among delinquent borrowers is $15,846, 10.4
percent lower than the median loan balance among all Bay Area borrowers.
Higher rates of delinquency and default are found in neighborhoods with high
percentages of Black and Hispanic residents. The Bay Area zip codes with the
highest rates of delinquency and default tend to have higher percentages of Black and
*
This report employs data from the Federal Reserve Bank of New York Consumer Credit Panel/Equifax
Data (CCP).
**
Delinquency is defined as being 90 days or more past due on one or more student loans. Default, a
subset of delinquency, is defined as being at least 270 days late on payments.
1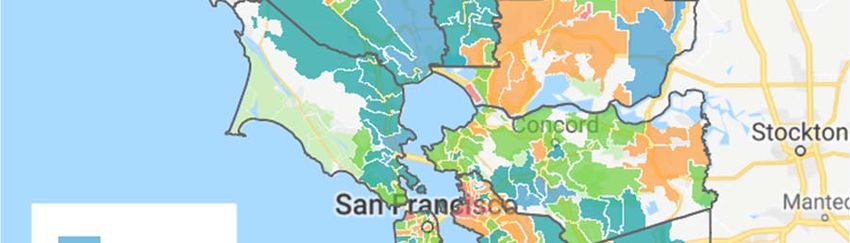
Hispanic residents. In the Bay Area neighborhoods with the highest percentage of
Black and Hispanic residents, 19.9 percent of borrowers are delinquent, 15.3 percent
are in default, and 26.9 percent have defaulted since 2003.
One in six Bay Area student loan borrowers have experienced default in the past
15 years. The percentage of student loan borrowers who have defaulted at some
point since 2003 rises to 17.2 percent, nearly double the current rate of default in the
Bay Area (9.1 percent). One out of every six Bay Area student loan borrowers has
experienced severe difficulty repaying their loans, risking ruined credit and other
negative consequences. At the zip code level, the percentage of borrowers who have
defaulted at some point since 2003 reaches as high as 46.2 percent.
2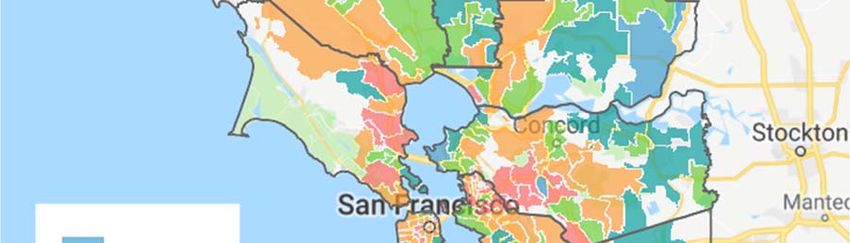
DATA AND METHODOLOGY

This report employed data from the Federal Reserve Bank of New York Consumer Credit
Panel/Equifax Data (CCP). Collected quarterly by the credit bureau Equifax, these data
comprise various credit and demographic characteristics of an anonymized 5 percent national
random sample of consumers over 18 with a credit history and Social Security numbers. The
student loan data component of the CCP used in this analysis provides loan-level information
on each student borrower, The CCP data consists of various consumer characteristics
including: age and geographic area of residence, but does not contain any information on
race, ethnicity, gender, income, employment, type of school attended, school completion, or
repayment plan participation
We followed the methods of the Federal Reserve Bank of New York for this report.2 We
aggregated loan-level information to student, zip code, and county levels for this analysis. To
compare 2018 and 2003, we used data from the second quarter of 2003 and the first quarter of
2018. We adjusted 2003 balances for inflation to 2018 dollars. To examine whether borrowers
had defaulted since 2003, we assessed default in any quarter between the first quarter of 2003
and the first quarter of 2018. We linked the CCP data to zip code tabulation areas used by
Census 2000 and American Community Survey (ACS) 2013-2017 to calculate prevalence and
characterize borrowers by various features of their neighborhood, including by quintile of
neighborhood income and racial/ethnic composition.
We adjusted balances to account for jointly-held loans. We defined delinquency and default in
accordance with the Department of Education definitions of being 90 days or 270 or more
past due on one or more student loan, respectively. We excluded zip codes from analysis if
they are missing Census or ACS data or from maps if they have fewer than 10 observations. In
analyses of age only, we included individuals born in 1918 or later. We determined repayment
status by comparing each quarter’s balances with those in the previous quarter. Black refers to
non-Hispanic black. Due to small sample sizes and reliance on population estimates from the
ACS, prevalence estimates presented here are subject to measurement error and should be
interpreted with caution.

                                               3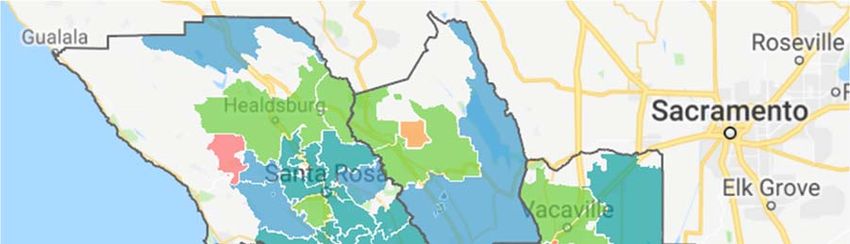
INTRODUCTION

Today many student loan borrowers struggle with their debt, including borrowers who keep
up with their loan payments as well as those falling behind. For most Americans, an
investment in higher education continues to be a key driver of economic security and
mobility, yielding a substantial financial and personal return.3 However, while tuition and fees
have risen rapidly (more than doubling over the past 30 years),4 and more low-income
students are borrowing to attend college5, wages have stagnated, especially at the bottom of
the income distribution.6

These trends, without the development of adequate support systems for borrowers, especially
low-income borrowers, have resulted in more borrowing and rising rates of delinquency and
default. Student debt has reached nearly $1.5 trillion nationally, while total student debt has
more than tripled in the Bay Area in the past 15 years to $26.6 billion. Borrowers are taking
longer to repay their loans, and cumulative default rates nationally continue to rise even 20
years after borrowers enter college, increasing from 18 to 26 percent between 12 and 20 years
among borrowers who entered college in 1996. Based on these trends, national projections for
cumulative student loan default 20 years after entry reach as high as 40 percent by 2023.7
Roughly one quarter of the national increase in student debt since 1989 is a result of more
students enrolling in college.8 Other factors contributing to ballooning student debt balances
include state divestment in higher education and rising college costs – not only tuition, but
student-related living costs such as housing, food, and transportation.9 Recent analyses find
that low-income students who attend one of California’s public higher education institutions
face considerable unmet needs.10
The share of students graduating with very high student loan balances (more than $50,000)
has also tripled since 2000, increasing from 5 percent of borrowers in 2000 to 17 percent of
borrowers in 2014. While eye-catching, high individual loan balances are not the main concern
when it comes to student loan distress. Numerous researchers have shown that low earnings,
especially among non-completers, for-profit college attendees, and borrowers of color, are
bigger causes of delinquency and default.11
Student debt burden is especially concerning in the Bay Area, where incomes have not kept
pace with the skyrocketing cost of living, and income inequality has increased significantly
over the past several decades. Between 1970 and 2015, incomes for the poorest Bay Area
households grew 15 percent, compared to 42 percent among the highest income
households.12 In a recent Brookings Institution analysis of 2016 data, both the San Francisco
and San Jose metropolitan areas were among the cities with the highest levels of income
inequality in the country.13
Stagnant wage growth has made it hard for low-income families in the Bay Area to cope with
rising expenses. In the Bay Area, half of all renters, and 60 percent of Black, Latinx, and Native
American renters are considered “rent-burdened,” spending at least 30 percent of their
income on housing. Six of every 10 Bay Area residents who are economically insecure are
renters, and 75 percent of them are rent-burdened.14 According to the California Self-
Sufficiency Standard (which does not include any student loan repayment costs) a family of
four in San Francisco with one school aged child and one preschooler must make $123,442

                                                 4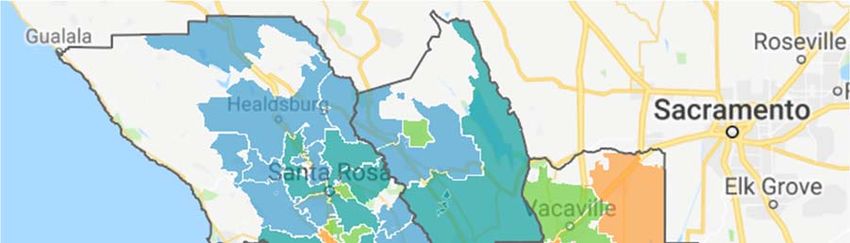
annually just to meet basic expenses; 28 percent of San Francisco households live below this
Standard, including 63 percent of African American and 48 percent of Latinx households.15
College success is crucial to support economic mobility, especially in the context of growing
inequality. However, rising costs of living and stagnant wages mean people need to work even
harder to survive, including, for many low-income students, working while they attend
college. In this environment, even a small obstacle like a financial emergency can negatively
impact college completion, leaving many with the burden of student debt without a college
degree and the higher earning power that comes with that degree.
For too many families in the Bay Area, it is a struggle to make ends meet, and these conditions
present challenges for student loan borrowers. To gain a better understanding of who is
suffering from financial distress related to student debt, we examine student borrowing and
repayment at the county level and by zip code within the nine-county region. This report
assesses how many people in the Bay Area have outstanding student loan debt and how
much student loan borrowers owe. We focus on rates of delinquency, current default, and
default since 2003, and examine how successful borrowers are in making payments to reduce
their loan balance. We also examine repayment status by age.
Following a Bay Area-wide analysis we provide a more in-depth analysis of student loan
borrowing and repayment in San Francisco. Throughout the report we provide additional
context for the growing concern around student loan debt, highlighting recent research on
national trends in delinquency and default, as well as research that describes how student
loan debt creates an increasing burden for borrowers, with negative spillover effects that
impact entire communities.
While this report provides critical insight into the state of student debt in the Bay Area, it is
primarily descriptive and does not purport to provide a complete picture of borrower
characteristics. Further research is needed to understand how borrowing and repayment vary
by key variables such as race, income, gender, school type, employment status, degree
completion, and participation in a repayment plan.

                                                5
STUDENT DEBT BURDEN

STUDENT LOAN DEBT BURDEN HAS INCREASED SIGNIFICANTLY FOR BAY AREA
BORROWERS SINCE 2003
Student loan borrowing and borrower distress in the Bay Area have increased dramatically
over the past 15 years, echoing the national trend (Figure 1). The percentage of people in the
Bay Area borrowing to finance higher education has nearly doubled over the past 15 years,
from 6.2 to 12.2 percent, and adjusting for inflation, median balances have increased 28
percent. The total student debt balance in the Bay Area tripled (from $7.8 billion to $26.6
billion in 2018 dollars) between Q2 2003 and Q1 2018. Total student debt in the United States
quadrupled over the same period, from $328 billion to $1.41 trillion.16

Borrower repayment outcomes have deteriorated during this time, with significant increases
in both delinquency and default. The delinquency rate for Bay Area borrowers increased by
60.3 percent, from 7.4 to 11.8 percent, while the borrower default rate grew by 135 percent,
from 3.9 to 9.1 percent. The impact on some counties has been more severe than on others,
with Napa, Solano and Santa Clara experiencing the largest increases in rates of delinquency
and default during this period.

Default (a subset of delinquency) has also come to represent a larger component of the overall
pool of delinquent borrowers in the Bay Area. In 2003, the percentage of defaulted borrowers
(3.9 percent) was slightly more than half that of delinquent borrowers (7.4 percent). By 2018,
defaults (9.1 percent of all borrowers) had grown to represent 77.1 percent of the total
delinquency pool (11.8 percent of borrowers).

The magnitude and direction of these changes highlight an urgency to address the growing
burden of student debt in the Bay Area.

                                               6
FIGURE 1. STUDENT LOAN PREVALENCE, DELINQUENCY, DEFAULT, AND MEDIAN BALANCE,
SAN FRANCISCO BAY AREA, 2003 AND 2018

                                                                    2003      2018
15%
                                                                                                                    $17,489

                         12.2%
                                                          11.8%
                                                                                                          $13,685
10%

                                                                                           9.1%

                                              7.4%
              6.2%
5%

                                                                               3.8%

0%
             Prevalence of                    Delinquency                          Default                Median Balance
              Borrowers                                                                                    (2018 dollars)

Source: FRBNY Consumer Credit Panel/Equifax Data, Census 2000, and 2013-2017 American Community Survey.

                                                                       7
At the county level, there is considerable variation in the size of these increases (Figure 2).
Contra Costa and Solano experienced the largest growth in prevalence of student loan debt
(149.2 and 147.8 percent respectively), while median loan balances grew fastest in Napa (51.2
percent). The deterioration of repayment outcomes for borrowers in Solano is of particular
concern, as delinquency and default rates that were comparable to other Bay Area counties in
2003 grew to become the highest in the region by a clear margin by 2018 (16.8 percent for
delinquency and 12.3 percent for default, an increase of 114.8 percent and 238.3 percent
respectively). On a percentage basis, Napa also experienced a marked increase in its default
rate (238.2 percent), although Napa’s 2018 delinquency and default rates remain among the
lowest across all Bay Area counties.
We do not have a clear answer for why Solano borrowers experience such high levels of
delinquency and default. One contributing factor appears to be higher prevalence of student
debt but low levels of degree attainment, which could point to problems with college
completion. More study is needed to better understand these repayment outcomes in Solano.
FIGURE 2. STUDENT LOAN PREVALENCE, MEDIAN BALANCE, DELINQUENCY, AND DEFAULT
BY COUNTY, SAN FRANCISCO BAY AREA, 2003 AND 2018
Prevalence Median Balance Delinquency Default
(2018 dollars)
2003 2018 % change 2003 2018 % change 2003 2018 % change 2003 2018 % change
Alameda 6.9% 13.6% 96.0% $14,260 $17,768 24.6% 8.5% 13.4% 57.7% 4.4% 10.0% 130.5%
Contra Costa 5.3% 13.2% 149.2% $13,493 $17,279 28.1% 7.2% 12.7% 77.4% 3.5% 9.5% 171.1%
Marin 5.0% 10.1% 100.9% $15,519 $20,680 33.3% 6.8% 9.2% 34.8% 3.8% 7.6% 98.9%
Napa 4.9% 10.9% 121.7% $10,734 $16,231 51.2% 4.8% 8.2% 71.2% 2.2% 7.3% 238.2%
San Francisco 9.2% 14.0% 52.6% $17,869 $20,197 13.0% 7.7% 10.1% 31.6% 4.2% 7.9% 87.0%
San Mateo 6.0% 10.9% 81.7% $12,936 $17,964 38.9% 7.0% 10.0% 41.5% 4.2% 7.7% 85.7%
Santa Clara 5.2% 10.3% 98.1% $11,993 $15,500 29.2% 5.9% 11.3% 90.5% 3.1% 8.8% 182.7%
Solano 6.1% 15.0% 147.8% $12,050 $17,260 43.2% 7.8% 16.8% 114.8% 3.6% 12.3% 238.3%
Sonoma 5.3% 10.1% 91.0% $11,048 $16,068 45.4% 8.3% 7.9% -5.5% 4.0% 7.3% 80.7%
Bay Area 6.2% 12.2% 96.2% $13,685 $17,489 27.8% 7.4% 11.8% 60.3% 3.9% 9.1% 135.4%
Source: FRBNY Consumer Credit Panel/Equifax Data, Census 2000, and 2013-2017 American Community Survey.
8GROWING STUDENT LOAN DEBT CREATES A BURDEN FOR
BORROWERS AND COMMUNITIES
Typically, the story about the consequences of student loan debt focuses on borrowers who default on their
loans, and with good reason: student loan default results in lower credit scores, potentially making it harder to
obtain future loans, rent an apartment, or even find a job. Defaulters may have their wages garnished or tax
refunds seized, and older defaulters may have their Social Security payments garnished. Returning to school is
difficult, since borrowers who default may not receive any additional federal student aid until they return their
loans to good standing. It is nearly impossible to discharge student loans through bankruptcy.
These are harmful outcomes, and new data on student loan repayment has increasingly drawn attention to
the impacts of delinquency and default [see “Recent Research Paints a Troubling Picture of Student Loan
Default,” page 26]. However, this is only one piece of the student debt story. Millions of additional borrowers
paying down their student debt struggle to buy a home, start a business, or save for retirement. This burden is
likely to be particularly acute in areas with a high cost of living, such as the Bay Area.
Moreover, there is increasing evidence that student debt has negative spillover effects that go beyond
individual borrowers and their families to impact entire communities. Seth Frotman, who served as Student
Loan Ombudsman for the Consumer Financial Protection Bureau, has noted that “Researchers are beginning
to show how this debt fuels economic, gender, and racial inequality, inhibits asset accumulation, accelerates
wealth gaps, and carves out a generational divide that, even in the best of circumstances, will take decades to
erase.”17
Below are examples of recent research documenting increased burdens and negative consequences
associated with student loan debt:
Rising monthly payments. The Federal Reserve of New York estimated that the average monthly student
loan payment increased by 73 percent, from $227 in 2005 to $393 in 2016.18
Homeownership. Households with student loan debt have a lower overall homeownership rate than
similar households without student debt19, while rising levels of student debt resulted in a significant
reduction in the homeownership rate between ages 28-3020 and are attributable to 20 percent of the
decline in homeownership among young adults since 2005.21
Wealth inequality. Over a lifetime, a household owing $53,000 (the average debt for a dual-headed
household with 4-year degrees) in student debt will experience a wealth loss of $208,000, largely due to
lower retirement savings and home equity.22 Additional research has found that student borrowing
negatively impacts economic mobility.23
Savings and retirement. A median debt balance of $23,300 was found to cost borrowers over $115,000
by the time they retire24, while 55 percent of Americans are not saving for emergencies due to student
loan debt.25
Small business formation. Gallup researchers used survey results to find that between 2006 and 2015,
there were 2 million less businesses started due to student debt26, while research has found that increased
student debt reduces small business formation by 14 percent.27
Gender inequality. Women take on more student loans, take longer to repay their debt, and are more
likely to experience student debt-related financial distress than men.28 Women with student debt are also
more likely to delay marriage29, and student debt has been found to have negative impacts on marriage
and career prospects.30
Physical and mental health. Student debt is associated with poor psychological functioning.31 In general,
household debt relative to available assets is associated with higher perceived stress and depression,
poorer self-reported general health, and higher diastolic blood pressure.32
9BORROWING
WHO HAS STUDENT DEBT IN THE BAY AREA?
As of March 1, 2018, there were approximately 735,000 student loan borrowers across the nine
Bay Area counties, representing 12.2 percent of the adult population. Bay Area student loan
borrowers have a median loan balance of $17,489, slightly higher than the national median of
$16,840 and roughly 12 percent higher than the median for California borrowers ($15,583).
The median age of Bay Area borrowers is 35, with little variance across the nine counties.
Student loan debt is widely distributed throughout the Bay Area and varies by county (Figure
3). In San Francisco, loan prevalence and educational attainment are both among the highest
of any Bay Area county; 14 percent of adults have student loan debt, and 55.8 percent have
received a bachelor’s or graduate degree. In Marin, educational attainment ranks highest
among Bay Area counties (57.5 percent of adults have a bachelor’s degree or higher), but loan
prevalence is among the lowest in the region.
However, Solano County presents a different and more concerning scenario, where student
loan prevalence is the highest of the nine counties and educational attainment is the lowest.
Solano has the highest student loan prevalence in the region (15.0 percent), but the lowest
levels of undergraduate or advanced degrees (25.6 percent of residents have a bachelor’s
degree or higher). Borrowers who do not complete a college degree might have a harder time
repaying their student loans, especially since average wages nationally for workers with a high
school degree or some college have stagnated or even declined since 2000, despite increases
in the minimum wage.33
10FIGURE 3. PERCENT OF ADULT POPULATION WITH A STUDENT LOAN AND
EDUCATIONAL ATTAINMENT BY COUNTY, SAN FRANCISCO BAY AREA, MARCH 2018
Some Bachelor’s Graduate /
Professional % Adults with Student Loan Debt
College Degree
Degree
Alameda 24.9% 25.7% 19.0% 13.6%
Contra Costa 30.5% 25.9% 14.9% 13.2%
Marin 24.5% 32.5% 25.0% 10.1%
Napa 32.1% 22.8% 11.8% 10.9%
San Francisco 19.8% 33.4% 22.4% 14.0%
San Mateo 24.9% 28.2% 20.3% 10.9%
Santa Clara 22.7% 26.8% 23.2% 10.3%
Solano 38.7% 17.9% 7.7% 15.0%
Sonoma 34.7% 21.7% 12.2% 10.1%
Bay Area 26.1% 26.7% 13.0% 12.2%
California 29.3% 20.4% 12.2% 13.9%
United States 29.1% 19.1% 11.8% 17.9%
Source: FRBNY Consumer Credit Panel/Equifax Data; 2013-2017 American Community Survey.
The map in Figure 4 shows the percentage of the adult population with outstanding student
loan debt by zip code across the Bay Area. While there is no single trend accounting for
variation in borrowing, higher rates of borrowing can be found in high poverty areas,
including Downtown and West Oakland (29.6 percent poverty and 20.4 percent with student
debt), Oakland’s Uptown-Lakeside neighborhoods (26.1 percent poverty and 20.4 percent
with student debt), and San Francisco’s South of Market neighborhood (22.0 percent poverty
and 18.2 percent with student debt).
11FIGURE 4. PERCENT OF ADULT POPULATION WITH STUDENT LOANS BY ZIP CODE,
SAN FRANCISCO BAY AREA, MARCH 2018
Source: FRBNY Consumer Credit Panel/Equifax Data; 2013-2017 American Community Survey.
12HOW MUCH DO BORROWERS OWE?
Student loan balances are typically correlated with level of educational attainment; borrowers
with four-year college degrees (and especially professional degrees) often have higher loan
balances. In Marin and San Francisco (where 57.5 percent and 55.8 percent of adults,
respectively, have bachelor’s degrees or higher), median loan balances are highest in the
region ($20,680 and $20,197 respectively). Borrowers in Sonoma and Napa counties, where
residents have lower levels of educational attainment (39.9 percent and 34.6 percent
respectively with bachelor’s degree or higher), have correspondingly lower median loan
balances ($16,068 and $16,231 respectively).
However, despite this general and expected trend, two counties buck this trend in
significantly differing ways. In Santa Clara, residents have relatively higher levels of
educational attainment (50 percent with bachelor’s degrees or higher) and the lowest median
loan balances of any Bay Area county ($15,500), while Solano residents have the lowest rate of
college completion (22.7 percent with bachelor’s degrees or higher) and a relatively high
median loan balance of $17,260 (ranking 6th among all Bay Area counties).
Figure 5 shows median loan balances by county. This table also looks at student loan balances
relative to median household income to assess household ability to pay down student loan
debt. While this is difficult to assess without fully understanding someone’s financial life and
monthly expenses, it is clear that borrowers in some counties might be struggling more than
others to pay down their debt. For instance, although San Mateo and Solano borrowers have
similar median loan balances, student loan debt represents a significantly higher percent of
median income for borrowers in Solano than in San Mateo (23.7 percent versus 17.0 percent
respectively).
13FIGURE 5. MEDIAN STUDENT LOAN BALANCES BY COUNTY AND
AS A PERCENT OF MEDIAN COUNTY INCOME,
SAN FRANCISCO BAY AREA, MARCH 2018
Percent of
Median Income Median Loan Balance
Alameda 20.7% $17,768
Contra Costa 19.5% $17,279
Marin 19.8% $20,680
Napa 20.4% $16,231
San Francisco 21.0% $20,197
San Mateo 17.0% $17,964
Santa Clara 14.5% $15,500
Solano 23.7% $17,260
Sonoma 22.4% $16,068
Bay Area 19.1% $17,489
Source: FRBNY Consumer Credit Panel/Equifax Data; 2013-2017 American Community Survey.
The map in Figure 6 shows the median student loan balance per borrower in each Bay Area zip
code. The highest median student loan balances tend to be located in predominantly higher
income areas with higher educational attainment, including Marin and San Mateo counties
and in the East Bay hills. However, this trend is not uniform, as borrowers in some high poverty
neighborhoods have very high median loan balances. This includes Treasure Island (51.5
percent poverty, $30,503 median loan balance), West Berkeley (15.2 percent poverty, $30,365
median loan balance), and Guerneville (16.3 percent poverty, $29,344 median loan balance).
14FIGURE 6. MEDIAN STUDENT LOAN BALANCES BY ZIP CODE,
SAN FRANCISCO BAY AREA, MARCH 2018
Source: FRBNY Consumer Credit Panel/Equifax Data
15WHICH BAY AREA BORROWERS ARE IN DISTRESS?
DELINQUENCY
As previously noted, delinquency is defined in this report as 90 or more days past due on one
or more student loans. While loans are considered delinquent by loan servicers the first day
after a missed payment, servicers typically report the delinquency to the three major national
credit bureaus when a student loan borrower becomes more than 90 days past due on their
loan payment.
Having a delinquency reported to credit bureaus will lower a borrower’s credit score and
negatively affect their finances. Thus, while this report uses the term delinquent to describe
these borrowers, these borrowers are indeed “severely” or “seriously” delinquent (as other
researchers have previously described them), and there are grave negative consequences of
being more than three months late on loan payments.
The percentage of borrowers more than 90 days late on their student loan payments varies
substantially by county. Solano, as we discuss earlier, has the highest prevalence of student
loan debt and lowest levels of college attainment among the nine Bay Area counties, but has
the highest rate of borrowers who are 90 or more days delinquent (16.8 percent). This
delinquency rate is more than double those observed among borrowers in Sonoma (7.9
percent) and Napa (8.2 percent), which ranked second and third behind Solano in terms of
lowest college completion but had much lower prevalence of student loan debt (10.1 and 10.9
percent respectively).
16FIGURE 7. PERCENT OF STUDENT LOAN BORROWERS 90+ DAYS DELINQUENT BY COUNTY,
SAN FRANCISCO BAY AREA, MARCH 2018
90+ Days Delinquent
Alameda 13.4%
Contra Costa 12.7%
Marin 9.2%
Napa 8.2%
San Francisco 10.1%
San Mateo 10.0%
Santa Clara 11.3%
Solano 16.8%
Sonoma 7.9%
Bay Area 11.8%
Source: FRBNY Consumer Credit Panel/Equifax Data
The map in Figure 8 indicates rates of student loan delinquency by zip code. Highest
delinquency rates are almost uniformly found in low-income neighborhoods, including
Bayview-Hunters Point in San Francisco, East and West Oakland, Richmond, and Vallejo.
17FIGURE 8. PERCENT OF STUDENT LOAN BORROWERS 90+ DAYS DELINQUENT BY ZIP CODE,
SAN FRANCISCO BAY AREA, MARCH 2018
Source: FRBNY Consumer Credit Panel/Equifax Data
18When examining these neighborhoods, we find high rates of serious delinquency among
borrowers living in low-income neighborhoods with high rates of household poverty. The
highest level of delinquency is in East Oakland’s Coliseum neighborhood, where nearly one in
three borrowers (32.3 percent) is 90+ days past due. The median household income in this
area is $34,566, well below the median income for Alameda County ($81,626), and 30.7
percent of people live in poverty. In seven of the top ten zip codes by delinquency rate,
borrowers have median loan balances below that of the Bay Area overall, in line with other
research showing that delinquent borrowers often have lower balances than average.34
There are some zip codes, however, where borrowers have high delinquency rates and high
median loan balances. Treasure Island (23.1 percent delinquency) and Guerneville (28.6
percent) have median loan balances of $30,503 and $29,344, among the highest in the Bay
Area. However, these communities appear to be outliers; the weighted median loan balance
among the top 25 zip codes by delinquency rate is $15,379, 13.7 percent lower than the Bay
Area median loan balance.
Sausalito/Marin City stands out on this list as an area with high student loan delinquency (24.6
percent), yet relatively low poverty (10.7 percent – still above the Bay Area median, but well
below other high delinquency zip codes). Although Sausalito is known for its affluence, Marin
City has significantly lower levels of household income and educational attainment. This
juxtaposition of extreme wealth and poverty, even within the same zip code, represents part
of the Bay Area story; extreme inequality in the region (Marin County has the second-highest
income inequality ratio among Bay Area counties, according to the United Way of the Bay
Area)35 frequently masks the struggles of low-income families who face an exceptionally high
cost of living and struggle to make ends meet.
FIGURE 9. ZIP CODES WITH HIGHEST PERCENTAGES OF STUDENT LOAN BORROWERS 90+ DAYS
DELINQUENT, SAN FRANCISCO BAY AREA, MARCH 2018
Zip Percent Median Percent Percent Percent
Neighborhood
Code Delinquent Balance Poverty Black Hispanic
1 94621 East Oakland - Coliseum 32.3% $13,583 30.7% 30.6% 59.6%
2 94590 Vallejo 30.8% $16,890 24.0% 25.2% 29.1%
3 95446 Guerneville 28.6% $29,344 16.3% 1.0% 12.4%
4 94509 Antioch 26.8% $12,955 18.1% 17.3% 37.7%
5 94589 American Canyon 24.8% $15,913 15.3% 21.5% 33.2%
6 94965 Sausalito/Marin City 24.6% $20,692 10.7% 8.8% 12.7%
7 94124 Bayview-Hunters Point 24.6% $14,844 21.3% 27.6% 23.7%
8 94603 East Oakland - East 14th St. 23.6% $13,742 21.6% 31.2% 56.2%
9 94806 North Richmond/San Pablo 23.3% $15,150 15.8% 15.3% 50.0%
10 94130 Treasure Island 23.1% $30,503 51.5% 17.1% 33.8%
Bay Area 11.2% $17,489 9.6% 5.9% 23.6%
Source: FRBNY Consumer Credit Panel/Equifax Data; 2013-2017 American Community Survey
19DEFAULT
Student loan default is defined as becoming 270 days delinquent on student loan payments.
Default is a sub-category within the larger pool of severely delinquent borrowers, and
borrowers who become severely delinquent on their student loans tend to default. The fact
that student loan debt is nearly impossible to discharge in bankruptcy also means that the
pool of stagnant defaulted debts grows over time, increasing the representation of defaulted
borrowers within the overall delinquency rate.
In the Bay Area, borrowers in default (9.1 percent) compose more than three-quarters of the
overall pool of delinquent borrowers. Solano County, which has the highest delinquency rate,
also has the highest default rate (12.3 percent), while Sonoma and Napa Counties, which had
the lowest delinquency rates, also have the lowest default rates (both 7.3 percent). While
delinquency is lowest in Sonoma and Napa, the vast majority of delinquent borrowers in these
counties are in default (93.0 percent in Sonoma and 89.8 percent in Napa). Figure 10 shows
the default rate for each Bay Area county and demonstrates how default represents a large
share of overall delinquency.
FIGURE 10. PERCENT OF STUDENT LOAN BORROWERS IN DEFAULT BY COUNTY
AND AS A PERCENTAGE OF OVERALL COUNTY DELINQUENCY RATE,
SAN FRANCISCO BAY AREA, MARCH 2018
Default as
Percent of Percent in Default
Delinquency
Alameda 74.7% 10.0%
Contra Costa 74.7% 9.5%
Marin 82.5% 7.6%
Napa 89.8% 7.3%
San Francisco 78.0% 7.9%
San Mateo 77.6% 7.7%
Santa Clara 77.6% 8.8%
Solano 72.9% 12.3%
Sonoma 93.0% 7.3%
Bay Area 76.7% 9.1%
Source: FRBNY Consumer Credit Panel/Equifax Data
The map in Figure 11 shows student loan default rates across Bay Area zip codes. This map is
similar to Figure 8 (depicting delinquency rates across Bay Area zip codes) and as expected the
frequency of borrower default and borrower delinquency are similarly distributed throughout
the region, underscoring the strong correlation between delinquency and default.
Neighborhoods with the highest rates of student loan default are generally characterized by
low incomes and high poverty.
20FIGURE 11. PERCENT OF STUDENT LOAN BORROWERS IN DEFAULT BY ZIP CODE,
SAN FRANCISCO BAY AREA, MARCH 2018
Source: FRBNY Consumer Credit Panel/Equifax Data
21The highest rates of default among Bay Area zip codes range from 18.4 percent in Downtown
& West Oakland to 23.3 percent in East Oakland-Coliseum (Figure 12). In these neighborhoods,
the majority of all delinquent borrowers are in default – from 71.1 percent in East Oakland-
Coliseum to (incredibly) one hundred percent in Treasure Island. More research may be
needed to understand why default makes up such a high percentage of overall delinquency. It
is possible that loan servicers are not reporting delinquent borrowers to the credit bureaus
until they have already reached the point of default, however we do not have adequate
information to explain this pattern.
In these high-default zip codes we generally observe high poverty and low levels of
educational attainment. Poverty rates range from 10.7 percent in Sausalito/Marin City to 51.5
percent in Treasure Island, compared to the Bay Area-wide poverty rate of 9.6 percent. Eight of
the ten neighborhoods with the highest default rates have lower levels of degree completion
(bachelor’s degree or higher) than is found in the Bay Area overall. Sausalito/Marin City again
stands out as one exception to this trend, with the lowest poverty rate and highest
educational attainment (62.2 percent with bachelor’s degree or higher) among zip codes with
highest rates of borrowers who have defaulted since 2003.
These neighborhoods are also characterized by lower median student loan balances and
significant Black and Hispanic populations. Most of the top ten highest default zip codes have
median loan balances below the Bay Area median ($17,489). Black residents compose more
than one quarter of the population in East, West, and Downtown Oakland, as well as Bayview-
Hunter’s Point and Vallejo, much larger than the Black population in the Bay Area overall (5.9
percent). Guerneville is a counter-example to this larger trend, with a small Black or Hispanic
population; borrowers in both Guerneville and Treasure Island are unique in having some of
the highest median loan balances in the Bay Area ($29,344 and $30,503 respectively) with high
levels of student loan default.
FIGURE 12. ZIP CODES WITH HIGHEST PERCENTAGES OF STUDENT LOAN DEFAULT,
SAN FRANCISCO BAY AREA, MARCH 2018
Default as
Zip Percent Median Percent Percent Percent
Neighborhood Percent of
Code Default Balance Poverty Black Hispanic
Delinquency
1 94621 East Oakland - Coliseum 23.3% 72.1% $13,583 30.7% 30.6% 59.6%
2 94590 Vallejo 23.2% 75.3% $16,890 24.0% 25.2% 29.1%
3 94130 Treasure Island 23.1% 100.0% $30,503 51.5% 17.1% 33.8%
4 95446 Guerneville 21.4% 74.9% $29,344 16.3% 1.0% 12.4%
5 94509 Antioch 21.4% 79.7% $12,955 18.1% 17.3% 37.7%
6 94965 Sausalito/Marin City 20.0% 81.3% $20,692 10.7% 8.8% 12.7%
7 94589 American Canyon 19.4% 78.1% $15,913 15.3% 21.5% 33.2%
8 94124 SF - Bayview-Hunters Point 19.1% 77.7% $14,844 21.3% 27.6% 23.7%
9 94603 East Oakland - 14th Street 18.5% 78.4% $13,742 21.6% 31.2% 56.2%
10 94607 Downtown & West Oakland 18.4% 83.9% $19,101 29.6% 31.9% 14.2%
Bay Area 9.1% 77.0% $17,489 9.6% 5.9% 23.6%
Source: FRBNY Consumer Credit Panel/Equifax Data; 2013-2017 American Community Survey
22Figure 13 highlights large numbers of defaulted borrowers with relatively small student loan
balances. This table divides borrowers into categories by loan balance in $5,000 increments,
up to $100,000; an additional 4,140 borrowers with balances above $100,000 are also in
default but not shown here. Among all borrowers in default, almost half (49.7 percent) owe
less than $15,000, with 18.4 percent owing less than $5,000 in student loan debt.
FIGURE 13. NUMBER OF BAY AREA STUDENT LOAN BORROWERS IN DEFAULT BY LOAN BALANCE,
SAN FRANCISCO BAY AREA, MARCH 2018
12,000
9,000
6,000
3,000
-
$0-5K
$5-10K
$10-15K
$15-20K
$20-25K
$25-30K
$30-35K
$35-40K
$40-45K
$45-50K
$50-55K
$55-60K
$60-65K
$65-70K
$70-75K
$75-80K
$80-85K
$85-90K
$90-95K
$95-100K
Source: FRBNY Consumer Credit Panel/Equifax Data
We further assess patterns of distressed borrowers by loan balance and by quintiles of
neighborhood income in the Bay Area (Figure 14). In the lowest neighborhood income
quintile 68 percent of delinquent or defaulted borrowers owe less than $15,000, with nearly
one in five borrowers (19 percent) owing less than $5,000. While the largest number of student
loan borrowers who are either severely delinquent or in default live in the lowest income Bay
Area neighborhoods, the trend of delinquent and default borrowers having relatively small
loan balances holds across all income quintiles.
23FIGURE 14. NUMBER OF STUDENT LOAN BORROWERS 90+ DAYS DELINQUENT
OR IN DEFAULT BY NEIGHBORHOOD INCOME AND LOAN BALANCE,
SAN FRANCISCO BAY AREA, MARCH 2018*
Source: FRBNY Consumer Credit Panel/Equifax Data; 2013-2017 American Community Survey
* Within each column, the colored sections and accompanying percentages represent the proportion of delinquent
and defaulted borrowers within each neighborhood income quintile whose loan balance falls within a given range.
For example, in the lowest neighborhood income quintile, 19 percent of delinquent and defaulted borrowers owe
between $0 and $5,000, 16 percent owe between $5,001 and $10,000, and so on.
24RECENT RESEARCH PAINTS A TROUBLING PICTURE
OF STUDENT LOAN DEFAULT
Newly available national student-level repayment data, including national datasets like the College Scorecard and
new measures of student outcomes in the Integrated Postsecondary Education Data System, have begun to fill in
gaps in our understanding of student loan repayment, default rates, and risk factors associated with default.
Researchers using this data find that borrowers are taking longer to repay their loans, and that default rates are rising
over time. The risk of default is particularly high for borrowers with relatively small amounts of student loan debt, for
students who attend for-profit colleges, and for students of color.
According to the Department of Education’s most recent statistics, 10.8 percent of borrowers who entered
repayment in 2015 had defaulted three years later.36 This official “cohort default rate” doesn’t tell the full story,
however, and reflects a misconception that most defaults happen within the first few years after students leave
school, when they may be unemployed or working in a low-paid job. Ben Miller from the Center for American
Progress found that 15.5 percent of borrowers who entered repayment in 2012 defaulted within 5 years; Miller also
analyzed data for students who entered college in 2004, finding that 29 percent defaulted within 12 years after
entry.37 And Judith Scott-Clayton of the Brookings Institution found that for students entering college in 1996, default
rates continued to rise between 12 and 20 years after enrollment; applying these trends to the 2004 cohort suggests
that almost 40 percent of borrowers may default by 2023.38
The new data confirms that defaults are highest among borrowers with small amounts of student loan debt.
According to Miller, the median defaulter from the 2004 cohort owed $9,625 – $8,500 less than the median loan
balance for a non-defaulter.39 Scott-Clayton showed that 37 percent of those who borrow between $1 and $6,125 for
undergraduate study default within 12 years, compared with 24 percent of those who borrow more than $24,000.40
This new research shows that, contrary to the prevailing media narrative, borrowers with smaller loan balances face a
greater risk of default than those with larger debts.
Student loan borrowers who attend for-profit colleges are experiencing very high, and rising, rates of default. Scott-
Clayton found that among all new students entering a for-profit school in 2004, 47 percent had defaulted within 12
years, compared to 24 percent in the 1996 cohort – a rate nearly four times that seen in public or private non-profit
schools.41 Scott-Clayton also noted the importance of examining outcomes not just for borrowers, but for all entrants,
since borrowing rates differ substantially (most for-profit students borrow, for example, compared to less than half of
community college students).
Outcomes for Hispanic and especially African-American students are the most alarming. Scott-Clayton showed that
while 28 percent of borrowers who entered college in 2004 had defaulted 12 years later, the default rate for Hispanic
borrowers (35 percent) and Black borrowers (48.7 percent) was significantly higher than that of white borrowers (21.4
percent).42 Black students who completed their bachelor’s degree had a default rate (21 percent) more than five times
higher than that of white BA graduates (four percent); Hispanic BA graduates had a default rate of 8.6 percent. The
default rate for black students who achieved a bachelor’s degree was even higher than the default rate for white
college dropouts (21 versus 18 percent).43
Among all African-American first-time college entrants in 2004, almost 38 percent had defaulted within 12 years, up
from 25 percent in the 1996 cohort. Projections for 2004 entrants suggest that as many as 70 percent of black
borrowers – and nearly 50 percent of Hispanic borrowers – may default by 2023.44 Contributing to higher default
rates among Black and Hispanic borrowers are higher attendance (and borrowing) at for-profit schools, and lower
average incomes for college graduates of color. While Black and Hispanic students make up less than one-third of all
college students, they represent nearly half of all those attending for-profit institutions.45 The median white worker
with a bachelor’s degree earned $64,084 in 2018, about $13,500 and $11,800 more, respectively, than the median
income of their Black and Hispanic counterparts.46
26MANY MORE BORROWERS HAVE DEFAULTED AT LEAST ONCE SINCE 2003
In addition to showing current repayment status for student loan borrowers, we examine
current student loan borrowers who have defaulted at some point on their student loans since
2003. While the patterns are similar across Bay Area zip codes, the magnitude of default is
quite a bit higher. Across the Bay Area, 17.2 percent of student loan borrowers have defaulted
at least once during this period, nearly twice the current rate of default (9.1 percent).
Nearly half of borrowers from Treasure Island (46.2 percent) and the Coliseum neighborhood
in East Oakland (45.1 percent) have experienced a default since 2003 – roughly double the
percentage of borrowers from these neighborhoods currently in default (23.1 percent among
Treasure Island Borrowers and 23.3 percent among borrowers in East Oakland-Coliseum). In
Rio Vista, the percentage of student loan borrowers who have defaulted since 2003 (31.3
percent) is 150 percent higher than the current borrower default rate (12.5 percent).
FIGURE 15. ZIP CODES WITH HIGHEST PERCENTAGES OF STUDENT LOAN BORROWERS WHO HAVE
DEFAULTED AT LEAST ONCE SINCE 2003, SAN FRANCISCO BAY AREA, MARCH 2018
Percent Bachelor's
Zip Percent Percent Percent
Neighborhood Default Degree or
Code Poverty Black Hispanic
Since 2003 Higher
1 94130 Treasure Island 46.2% 51.5% 17.1% 33.8% 43.3%
2 94621 East Oakland - Coliseum 45.1% 30.7% 30.6% 59.6% 7.9%
3 94590 Vallejo 41.7% 24.0% 25.2% 29.1% 22.0%
4 95446 Guerneville 35.7% 16.3% 1.0% 12.4% 34.6%
5 94124 SF - Bayview-Hunters Point 35.0% 21.3% 27.6% 23.7% 25.3%
6 94589 American Canyon 32.7% 15.3% 21.5% 33.2% 19.2%
7 94509 Antioch 31.9% 18.1% 17.3% 37.7% 16.4%
8 94571 Rio Vista 31.3% 11.4% 6.4% 14.5% 23.1%
9 94605 East Oakland - Elmhurst 31.0% 16.5% 43.8% 25.1% 32.4%
10 94533 Fairfield 30.8% 14.1% 16.1% 35.8% 18.3%
Bay Area 17.2% 9.6% 5.9% 23.6% 39.7%
Source: 2013-2017 American Community Survey
While default sounds like an end state, it is not necessarily a static position. Borrowers can
“cure” (or restore to good standing) defaulted federal student loans through rehabilitation,
loan consolidation, or paying off the loan in full.47 Most borrowers choose rehabilitation to
cure defaulted loans – according to the Consumer Financial Protection Bureau (CFPB),
rehabilitations make up 70 percent of federal loan collections, while consolidation makes up
less than 20 percent (repayment in full is relatively rare, as might be expected).48 Borrowers
only get one chance to rehabilitate their loans, which requires a series of nine on-time
monthly payments over a ten month period, driven by the borrower’s income and family size,
rather than their loan balance.49
26Unfortunately, borrowers attempting to cure their student loan default through rehabilitation
are not broadly successful. A 2017 CFPB report found that nearly one in three borrowers who
exited default through rehabilitation defaulted for a second time within 24 months, and over
40 percent of borrowers re-defaulted within three years.50 While there are likely multiple
reasons for the low rate of success in student loan rehabilitation, the default and rehabilitation
process is expensive for borrowers, including the cost of placing the loan with a private
collection agency as well as processing fees and attorney fees from the Department of Justice.
The Urban Institute found that loan balances balloon by an average of 10 percent following
default, likely due to the collection fees and the accumulation of interest.
Figure 16 shows rates of borrowers who have experienced a default in the past 15 years, by
county. Solano again stands out with 24.3 percent of borrowers having defaulted at least once
during this time, but the percentage of borrowers who have defaulted in the last 15 years is
significantly higher in every county than the percentage of borrowers currently in default.
FIGURE 16. PERCENT OF STUDENT LOAN BORROWERS CURRENTLY IN DEFAULT
AND DEFAULTED AT LEAST ONCE SINCE 2003 BY COUNTY,
SAN FRANCISCO BAY AREA, MARCH 2018
10.0%
Alameda
19.3%
9.5%
Contra Costa
17.9%
7.6%
Marin
14.2%
7.3%
Napa
14.1%
7.9%
San Francisco
15.0%
7.7%
San Mateo
14.2%
8.8%
Santa Clara
16.0%
12.3%
Solano
24.3%
7.3%
Sonoma
15.4%
9.1%
Bay Area
17.2%
0% 10% 20% 30%
Currently in Default Defaulted since 2003
Source: FRBNY Consumer Credit Panel/Equifax Data
27In this longer-term analysis of borrower distress, borrowers living in low income
neighborhoods are still more likely to have experienced default since 2003, as shown in Figure
17. Across the Bay Area, borrowers in the lowest income quintile are nearly 2.5 times more
likely to have ever defaulted in the last 15 years than those in the highest income quintile.
FIGURE 17. PERCENT OF STUDENT LOAN BORROWERS CURRENTLY IN DEFAULT
AND DEFAULTED AT LEAST ONCE SINCE 2003 BY NEIGHBORHOOD INCOME,
SAN FRANCISCO BAY AREA, MARCH 2018
30%
Currently in Default Defaulted since 2003
26.6%
20%
20.0%
17.1% 17.2%
15.9%
15.1%
10% 10.9% 11.2%
8.7% 9.1%
8.2%
5.6%
0%
0-$62,660 $62,661- $77,389- $91,966- >$109,793 Bay Area
77,388 91,965 109,793
Source: FRBNY Consumer Credit Panel/Equifax Data; 2013-2017 American Community Survey
HIGHER DEFAULT RATES IN NEIGHBORHOODS WITH HIGH PERCENTAGES OF BLACK AND
HISPANIC RESIDENTS
Bay Area borrowers in neighborhoods with larger percentages of Blacks and Hispanics
experience higher rates of both delinquency and default.† We examine repayment outcomes
by racial/ethnic composition, dividing neighborhoods into quintiles by combined percentage
of Black and Hispanic residents. We focus on the percentage of Black and Hispanic residents
†
While recent national‐level research on student loan delinquency and default among Black and Hispanic
borrowers is able to identify borrower race, this variable is not included in the Consumer Credit Panel,
thus we examine repayment outcomes by neighborhood race and ethnicity in zip codes where borrowers
live.
28based on extensive evidence that Black and Hispanic student borrowers nationally experience
far higher levels of delinquency and default.51
Figure 18 shows the current default rate and the percent of borrowers who have experienced
a default since 2003 in these zip code quintiles. In the lowest zip code quintile 14.3 percent or
fewer residents are Black or Hispanic, while in the highest zip code quintile 44.9 to 90.2
percent of residents are Black or Hispanic. Rates of current default and default since 2003 rise
as the Black and Hispanic population increases. While the neighborhoods with the lowest
percentage of Black or Hispanic residents have only 4.9 percent of borrowers currently in
default and 10 percent have experienced a default since 2003, in the neighborhoods with the
highest percentages of Black and Hispanic residents, 15.3 percent of borrowers are currently in
default and 26.9 percent have experienced a default since 2003.
FIGURE 18. PERCENT OF BAY AREA BORROWERS CURRENTLY IN DEFAULT
AND DEFAULTED AT LEAST ONCE SINCE 2003 BY PERCENTAGE OF NEIGHBORHOOD
POPULATION OF BLACK AND HISPANIC RESIDENTS, SAN FRANCISCO BAY AREA, MARCH 2018
30%
Currently in Default Defaulted since 2003
26.9%
20%
17.8%
16.9%
15.3%
14.3%
10%
10.0% 9.4%
8.6%
7.1%
4.9%
0%
0-14.3% >14.3-21.8% >21.8-31.9% >31.9-44.8% >44.8-90.2%
Source: FRBNY Consumer Credit Panel/Equifax Data; 2013-2017 American Community Survey
The percent of borrowers who are currently 90+ days delinquent on student loans in these
neighborhoods (not shown) follows the same pattern. In the lowest quintile by Black and
Hispanic residency, 6.7 percent of borrowers are delinquent, rising across each quintile to a
peak of 19.9 percent borrower delinquency in neighborhoods with the highest percentage of
Black and Hispanic residents.
29You can also read