Assessment of commercially available energy-efficient room air conditioners including models with low global warming potential (GWP) refrigerants
←
→
Page content transcription
If your browser does not render page correctly, please read the page content below

LBNL-2001047

Assessment of commercially available
energy-efficient room air conditioners
including models with low global warming
potential (GWP) refrigerants
Authors:
Won Young Park,1 Nihar Shah,1 Brian Gerke2

Energy Analysis and Environmental Impacts Division
Lawrence Berkeley National Laboratory
International Energy Studies Group,1 Energy Efficiency Standards Group2

October 2017

               The Institute for Governance and Sustainable Development supported this work under Lawrence Berkeley National
               Laboratory Contract No. DE-AC02-05CH11231.

                                                        1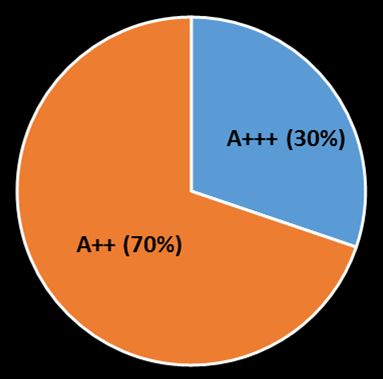
Disclaimer

This document was prepared as an account of work sponsored by the Institute for Governance & Sustainable
Development (IGSD). Neither IGSD nor any employee thereof, nor The Regents of the University of California, nor
any of their employees, makes any warranty, express or implied, or assumes any legal responsibility for the accuracy,
completeness, or usefulness of any information, apparatus, product, or process disclosed, or represents that its use
would not infringe privately owned rights. Reference herein to any specific commercial product, process, or service
by its trade name, trademark, manufacturer, or otherwise, does not necessarily constitute or imply its endorsement,
recommendation, or favoring by IGSD or any employee thereof, or The Regents of the University of California. The
views and opinions of authors expressed herein do not necessarily state or reflect those of IGSD thereof, or The
Regents of the University of California. Ernest Orlando Lawrence Berkeley National Laboratory is an equal
opportunity employer.

                                    COPYRIGHT NOTICE
         This manuscript has been authored by an author at Lawrence Berkeley National
       Laboratory under Contract No. DE-AC02-05CH11231 with the U.S. Department of
       Energy. The U.S. Government retains, and the publisher, by accepting the article for
       publication, acknowledges, that the U.S. Government retains a non-exclusive, paid-
        up, irrevocable, worldwide license to publish or reproduce the published form of
            this manuscript, or allow others to do so, for U.S. Government purposes.

                                                         2
ABSTRACT
Improving the energy efficiency of room air conditioners (RACs)1 will be a critical step toward
reducing the energy, peak load, and total lifecycle emissions impacts of RACs while transitioning
to low global-warming-potential (GWP)2 refrigerants under the 2016 Kigali Amendment to the
Montreal Protocol. Previous research quantified the energy and climate benefits of leapfrogging
to high efficiency in tandem with the transition to low-GWP refrigerants for RACs (Shah et al.,
2015) and identified opportunities for initial action to coordinate energy efficiency with refrigerant
transition, focusing initially on economies constituting about 65% of the global RAC market (Shah
et al., 2017). Previous research by Oak Ridge National Laboratory (ORNL) determined that
flammable HC-290 (R-290) and HFC-32 (R-32) are inherently more energy efficient than non-
flammable HFC-410A (R-410A).
This report describes further research performed to identify the best-performing (i.e., most efficient
and low-GWP-refrigerant using) RACs on the market to maximize the lifecycle energy, cost, direct
and indirect emissions savings discussed in previous work. By defining and describing current best
available technology (BAT), this report can help support market-transformation programs for
high-efficiency and low-GWP equipment such as minimum energy performance standards
(MEPS), labeling, procurement, performance assurance requirements for imports, and incentive
programs. Furthermore, the new strategy of bulk government procurement is proving that high
efficiency can be achieved at affordable cost by capturing economies of scale in production, sales,
distribution, and installation (Abhyankar et al., 2017; Mathur et al., 2017).
The report focuses more on RACs that maximize efficiency as long as the GWP of refrigerant is
marginally lower than the baseline, for the following reasons:
Energy related indirect emissions typically dominate carbon footprint over the lifecycle of
the RACs jurisdictions where the carbon intensity is high from fossil fuel and biomass
electricity generation but are insignificant in jurisdictions where the carbon intensity is low
from nuclear, wind, solar, and geothermal electricity generation. (Goetzler et al., 2016).
With the adoption of the Kigali Amendment there is a global agreement to phasedown high
GWP HFCs, with two associated decisions addressing energy efficiency (XXVIII 2 and 3)
The technology used in the highest efficiency RACs with high GWP non-flammable
refrigerants is similar to technology used in RACs with flammable low-GWP refrigerants.
We studied RACs available in six economies—China, Europe, India, Japan, South Korea, and the
United States—that together account for about 70% of global RAC demand, as well as other
emerging economies. The following are our key findings:
1
This study focuses on ductless split ACs, because the global RAC market is dominated by this type of unit, known
in the United States as mini-splits.
2
We use the term “low-GWP” to mean “lower than the baseline refrigerant being replaced.”
3 Fixed-speed RACs using high-GWP and ozone-depleting R-22 refrigerant still
dominate the market in many emerging economies. Because of the prevalence of fixed-
speed RACs using R-22 in many markets among the Article 5 (A5) Parties, there is
significant opportunity to improve RAC efficiency and transition to low-GWP
refrigerants using commercially available technology and to design market-
transformation programs for high-efficiency, low-GWP equipment, including
standards, labeling, procurement, performance assurance requirements for imports, and
incentive programs.
Highly efficient RACs using low-GWP refrigerants, e.g., R-32 and R-290 are
commercially available today at prices comparable to similar RACs using high-GWP
HCFC-22 (R-22) or R-410A. R-290 RACs are manufactured only in China and India
and have only penetrated the Indian market, but 30 million R-32 ACs have been sold
in ~50 countries with manufacturing in China, European Union, India, Indonesia, Japan,
South Korea, Philippines, and United States.3
High efficiency is typically a feature of high-end products selling at substantially higher
prices than less efficient low-end products. However, highly efficient, cost-competitive
(less than 1,000 or 1,500 U.S. dollars in retail price, depending on size) RACs are
increasingly available in some markets.4
Where R-22 is phased out, high GWP R-410A still dominates RAC sales in most non-
A5 Parties except Japan, where R-32 RACs are 100% of sales.
In all of the economies studied except Japan and India, only a few models are both
energy efficient and use low-GWP refrigerants.
RACs are available in most regions and worldwide that surpass the highest efficiency
levels recognized by labeling programs, suggesting considerable opportunity to
strengthen this and related market transformation programs.
3
Updated September 2017 by Stephen O. Anderson from information provided by Daikin.
4
In China, the price of 1-ton variable-speed ACs is estimated to be about USD 640 on average, ranging from about
USD 300 to USD 1950, while that of 1-ton fixed-speed ACs is about USD 360 on average, ranging from USD 250
to USD 600.
4ACRONYMS
A5 Article 5
AC air conditioner
AHRI Air-conditioning, Heating, and Refrigeration Institute
APF annual performance factor
ASEAN Association of Southeast Asian Nations
BAT best available technology
BEE Bureau of Energy Efficiency
Btu/h British thermal units per hour
CC cooling capacity
CEE Consortium for Energy Efficiency
CFC chlorofluorocarbons
CNIS China National Institute of Standardization
CO₂ carbon dioxide
COP coefficient of performance
CSPF cooling seasonal performance factor
ECCJ Energy Conservation Center Japan
EER energy-efficiency ratio
EERIDN Indonesian EER
EU European Union
EU SEER European Union seasonal energy-efficiency ratio
GHG greenhouse gas
GWP global warming potential
h hour
HC hydrocarbon
HCFC hydrochlorofluorocarbon
HFC hydrofluorocarbon
HFO hydrofluoroolefin
HSPF heating seasonal performance factor
IDEA International Database of Efficient Appliances
IDU indoor unit
IGSD Institute for Governance and Sustainable Development
ISEER India seasonal energy-efficiency ratio
ISO International Organization for Standardization
JARN Japan Air Conditioning, Heating and Refrigeration News
KEA Korea Energy Agency
kW kilowatt
LBNL Lawrence Berkeley National Laboratory
MEMR Ministry of Energy and Mineral Resources of the Republic of Indonesia
5MEPS minimum efficiency performance standards
mm millimeters
NH₃ ammonia
ODU outdoor unit
OEM original equipment manufacturer
RAC room air conditioner
RT refrigeration ton
S&L standards and labeling
SCOP seasonal coefficient of performance
SEER seasonal energy-efficiency ratio
SHINE Standards Harmonization Initiative for Energy Efficiency
USD U.S. dollar(s)
US DOE U.S. Department of Energy
US SEER United States seasonal energy-efficiency ratio
VRF variable refrigerant flow
6Executive Summary
Background and motivation
Driven by increasing incomes, electrification, urbanization, as well as a warming world, demand
for room air conditioners (RACs) in emerging economies, particularly those with hot climates, is
expected to greatly increase energy consumption. In the absence of implementation action under
the Kigali Amendment to the Montreal Protocol, this increased demand would also greatly increase
the use of high-GWP hydrofluorocarbon (HFC) refrigerants (Zaelke et al., 2017; Velders et al.,
2009); in 2050, prior to the Kigali Amendment, Article 5 (A5) Parties5 were expected to account
for more than 80% of global HFC use (Seidel et al., 2016). Improving the energy efficiency of
RACs6 while transitioning to low GWP7 refrigerants will be a critical step toward reducing the
energy, peak load, and emissions impacts of ACs while keeping costs low. Previous research
quantified the energy and climate benefits of leapfrogging to high efficiency in tandem with the
transition to low-GWP refrigerants for RACs (Shah et al., 2015) and identified opportunities for
initial action to coordinate energy efficiency with refrigerant transition in economies constituting
about 65% of the global RAC market (Shah et al., 2017).
This report describes further research performed to identify the best-performing (i.e., most efficient
and low-GWP-refrigerant using) RACs on the market at the time of this study, to support an
understanding of the best available technology (BAT). Understanding BAT can help support
market-transformation programs for high-efficiency and low-GWP equipment such as minimum
energy performance standards (MEPS), labeling, procurement, performance assurance
requirements for imports, and incentive programs by providing evidence to policymakers on:
• Technical potential for efficiency improvement
• Cost of efficient technology
• Technology drivers and key components for manufacturing efficient equipment
• Input into further research, e.g., testing, design, etc.
• Global dynamics regarding leading manufacturers
5
In 2016, the Parties to the Montreal Protocol adopted the Kigali Amendment to the Montreal Protocol to agree on a
global schedule for phasing down HFC refrigerants. The schedule consists of three groups of Parties, each with a
target phasedown date. Many of the A5 Parties, including China, Brazil, and all of Africa, will freeze the use of
HFCs by 2024. Collectively this group is known as “Group 1” of the A5 Parties. A small group of A5 Parties with
the world’s hottest climates—such as Bahrain, India, Iran, Iraq, Kuwait, Oman, Pakistan, Qatar, Saudi Arabia, and
the United Arab Emirates—have the most lenient schedule and will freeze HFC use by 2028. Collectively this group
is known as “Group 2” of the A5 Parties See http://ozone.unep.org/en/article-5-parties-status for the list of the
Parties included as A5 Parties.
6
This study focuses on ductless split ACs, because the global RAC market is dominated by this type of unit, often
referred to as mini-splits.
7
We use the term “low-GWP” to mean “lower than the baseline refrigerant being replaced.”
7Scope and methods
This report focuses more on RACs that maximize efficiency as long as the GWP of refrigerant is
marginally lower than the baseline, for the following reasons:
Energy related indirect emissions are typically the dominant type of emissions over the
lifecycle of the RACs (Goetzler et al., 2016).
With the adoption of the Kigali Amendment there is a global agreement to phasedown high
GWP HFCs, with two associated decisions addressing energy efficiency (XXVIII 2 and 3)
The technology used in the highest efficiency RACs with high GWP refrigerants is likely
similar to equivalent technology used in RACs with low-GWP refrigerants with some
modifications for refrigerant.
To identify energy-efficient RACs with conventional (e.g., HCFC-22 and HFC-410A, hereafter
referred to as R-22 and R-410A) and low-GWP (e.g., HFC-32, HC-290, hereafter referred to as R-
32 and R-290) refrigerants, we studied RACs available in six economies—China, Europe, India,
Japan, South Korea, and the United States—that together account for about 70% of global RAC
demand, as well as other emerging economies (JRAIA, 2017). We collected data, from March
2016 to July 2017, depending on economy, from a) coordination with the Lawrence Berkeley
National Laboratory (LBNL) International Database of Efficient Appliances (IDEA) initiative, b)
country-specific databases such as those of the Energy Conservation Center Japan (ECCJ) and the
Korea Energy Agency (KEA), c) websites such as Topten China and Topten EU (which provide
information on the most efficient appliances and equipment, including RACs), d) web searches
and manufacturer catalogs; and e) interviews with industry experts. The LBNL IDEA data used in
this study were collected for RACs from retail sites in China, India, Indonesia, and the United
States. The IDEA software combined the information from these sites and cross-referenced the
resulting models against certification data from the national appliance standards and labeling
programs to validate the information collected from retail sites and ensure the models listed are
available on the market at the time of this study.
This report does the following:
1. Provides a brief overview of RAC energy-efficiency and refrigerant trends.
2. Categorizes RAC products according to key characteristics, e.g., type (cooling-only or
reversible), compressor technology (fixed or variable speed), and cooling capacity.8
3. Analyzes the RAC efficiency distribution and leading manufacturers in each market based
on the most recent available data.
8
Other features e.g. standby power, air filtration etc. may impact energy use but are not separately considered here
since: a) these are not uniformly reported either online or in product databases, b) these are not covered under the
standard test procedures and c) these may tend to be associated more with higher end products.
84. Reviews the data collected from the economies to select highest-efficiency RAC products
in each category along with refrigerant and price information that we collected.
5. Discusses the implications of our findings and possible future research.
Key findings
The following are our key findings:
Fixed-speed RACs using high-GWP and ozone-depleting R-22 refrigerant still
dominate the market in many emerging economies. Because of the prevalence of fixed-
speed RACs using R-22 in many markets among the A5 Parties, there is significant
opportunity to improve RAC efficiency and transition to low-GWP refrigerants using
commercially available technology and to design market-transformation programs for
high-efficiency, low-GWP equipment, including standards, labeling, procurement,
performance assurance requirements for imports, and incentive programs.
BAT products, i.e., highly efficient RACs using low-GWP refrigerants (R-32 and R-
290) are commercially available today at prices comparable to similar RACs using
high-GWP R-22 or R-410A.
Where R-22 is being phased out, high-GWP R-410A still dominates RAC sales in most
mature markets except Japan, where R-32 dominates. From 2012, manufacturers in
Japan, anticipating a transition to lower-GWP refrigerants, began a second transition
from R-410A to R-32. In India, Godrej is making the transition directly from R-22 to
R-290, while Daikin India introduced R-32 RACs in new production.
In all of the economies studied except Japan, currently only a few models are energy
efficient and use low-GWP refrigerants.9
RAC manufacturers in China have developed R-290 products although the Chinese
market also has highly-efficient R-32 RAC models.10
Variable-speed or inverter products that already dominate mature RAC markets such
as Europe, Japan, and South Korea are currently driving high efficiency in RACs.
RACs are available in most regions and worldwide that surpass the highest efficiency
levels recognized by labeling programs (Figure ES-1).
While highly efficient, cost-competitive (less than 1,000 or 1,500 U.S. dollars in retail
price, depending on size) RACs are available (Figure ES-2), high efficiency is typically
bundled as a feature of high-end products.
9
Note: Low-GWP refrigerants e.g. R-32 and R-290 tend to be more efficient than the baseline units, so there is no
inherent barrier to high efficiency in ACs with low-GWP refrigerants.
10
In China, no sales of R-290 RACs were reported until July 2017 according to interviews with manufacturers and
JARN (2015), except for installations for demonstration purpose. In 2017, 100,000 units of R-290 ACs are likely to
be delivered from China to other markets, e.g., the Middle East and Vietnam (McLaughlin, 2017)
9See Table B1 in Appendix B for information on AC models analyzed.
Figure ES-1. Efficiency of most-efficient models relative to MEPS or least-efficient labels
10Number of models: 74 (1-RT R-22 fixed-speed in China), 40 (2-RT R-22 fixed-speed in China), 208 (1-RT R-410A variable-
speed in China), 92 (2-RT R-410A variable-speed in China), 3 (1-RT R-32 variable-speed in China), 2 (2-RT R-32 fixed-speed in
China), 6 (2-RT R-32 variable-speed in China), 1 (1-RT R-290 fixed-speed in India), 2 (1-RT R-290 variable-speed in India)
In China, the price of 1-ton variable-speed ACs is estimated to be about USD 640 on average, ranging from about USD 300 to
USD 1950, while that of 1-ton fixed-speed ACs is about USD 360 on average, ranging from USD 250 to USD 600.
Source: LBNL IDEA and web searches
Figure ES-2. Price vs. efficiency of 1-RT and 2-RT RACs
Further work
The highest-efficiency, low-GWP-refrigerant using, RAC models need to be further analyzed to
estimate the technical potential for efficiency improvement, cost reduction, and deployment of
low-GWP refrigerants. Prices in many markets (e.g., Japan, South Korea, and India) have
continued to fall over time, even with increases in efficiency (Phadke et al., 2017a; Abhyankar et
al., 2017).
In light of this evidence, engineering analysis is a suitable approach to estimating an appliance’s
potential for reduced energy consumption and associated incremental cost of efficiency
improvements. Engineering analysis is a bottom-up, static approach that has been employed in the
U.S. and European Union (EU) efficiency standards rulemaking processes as well as by the Bureau
of Energy Efficiency in India. When coupled with estimates for retail mark-up, this method
typically provides a conservative (higher) estimate of the increase in manufacturing cost and retail
price that might occur if efficiency were improved. To make the estimate even more conservative,
11it can be based on an estimate of the markup for baseline models, which includes typical wholesale
and retail costs.11 This approach could form the basis for conservative estimates of cost-benefit
calculations related to individual consumers, manufacturers, and countries or regions to account
for the additional costs, if any, compared to manufacturing conventional products.
For all refrigerants, including R-22 and R-410A 12 , RAC efficiency degrades with increased
ambient temperature. However, research indicates that low-GWP refrigerants could have
comparable or better performance than conventional refrigerants (R-22 or R-410A) in high-
ambient-temperature environments (Abdelaziz et al., 2015). Given that energy-savings potential
from RACs coupled with low-GWP refrigerants could vary by regional characteristics such as
local climatic conditions and projected RAC demand, there could be opportunities to achieve
larger energy savings by adopting regional seasonal energy efficiency metrics in many countries,
including those with hot climates.
11
For example, Shah et al. (2016) estimated retail markups in India at ~140% on a manufacturing cost of Rs. 14500
for a baseline 1.5 ton mini-split AC.
12
Note: R-22 is subject to phaseout under the Montreal Protocol and R-410A is now also subject to phaseout under
the Kigali Amendment to the Montreal Protocol.
12Table of Contents
Executive Summary ........................................................................................................................ 7
Table of Contents .......................................................................................................................... 13
Table of Figures ............................................................................................................................ 14
Table of Tables ............................................................................................................................. 15
1. Introduction ........................................................................................................................... 16
2. Overview of air-conditioner energy-efficiency and refrigerant trends ................................. 18
3. Data ....................................................................................................................................... 21
4. Review of energy-efficient air conditioners by region ......................................................... 25
4.1. China........................................................................................................................... 26
4.2. Europe ......................................................................................................................... 30
4.3. India ............................................................................................................................ 33
4.4. Japan ........................................................................................................................... 36
4.5. South Korea (Republic of Korea) ............................................................................... 39
4.6. United States ............................................................................................................... 43
4.7. Other countries ........................................................................................................... 46
5. Discussion: development of energy-efficient RACs with low-GWP refrigerants ................ 49
Acknowledgments......................................................................................................................... 56
References ..................................................................................................................................... 56
Appendix A. Energy Efficiency Standards and Labels ................................................................ 61
Appendix B. List of Highest-Efficiency RACs ............................................................................ 64
Appendix D. Interregional Conversion of Seasonal Energy Efficiency Performance .................. 66
13Table of Figures
Figure ES-1. Efficiency of most-efficient models relative to MEPS or least-efficient labels ...... 10
Figure ES-2. Price vs. efficiency of 1-RT and 2-RT RACs ......................................................... 11
Figure 1. Distribution of variable-speed RAC models in China in 2016, by efficiency and CC . 27
Figure 2. AC model share, by manufacturer in 2016 (2,024 models) .......................................... 27
Figure 3. Share of variable-speed AC models by manufacturer in 2016 (578 models)................ 27
Figure 4. Distribution of highest-efficiency RAC models in Europe in 2016, by efficiency and
CC ................................................................................................................................................. 31
Figure 5. Share of energy-efficient AC models in Europe, by manufacturer (96 models) ........... 31
Figure 6. Share of energy-efficient AC models in Europe, by refrigerant type (96 models) ....... 31
Figure 7. Distribution of energy-efficient RAC models in India in 2016–2017, by efficiency and
CC ................................................................................................................................................. 34
Figure 8. Share of AC models in India, by manufacturer (785 models) ....................................... 34
Figure 9. Share of energy-efficient AC models in India, by manufacturer (57 models) .............. 34
Figure 10. Distribution of RAC models in Japan, by efficiency and CC ..................................... 36
Figure 11. Share of AC models in Japan, by manufacturer (2,922 models) ................................. 37
Figure 12. Share of energy-efficient AC models (APF ≥ 7) in Japan, by manufacturer (139
models).......................................................................................................................................... 37
Figure 13. Distribution of RAC models (cooling-only type) in South Korea, by efficiency and
CC ................................................................................................................................................. 40
Figure 14. Distribution of RAC models (reversible type) in South Korea, by efficiency and CC 40
Figure 15. Share of AC models in South Korea, by manufacturer (1,309 models, cooling-only
type) .............................................................................................................................................. 41
Figure 16. Share of AC models in South Korea, by manufacturer (638 models, reversible type) 41
Figure 17. Distribution of mini-split ACs in the United States in 2017, by efficiency and CC ... 44
Figure 18. Share of mini-split models in the United States, by manufacturer (836 models)........ 44
Figure 19. Distribution of RAC models in Indonesia in 2017, by efficiency and CC .................. 47
Figure 20. Distribution of split AC models in the Philippines in 2016, by efficiency and CC .... 48
Figure 21. Efficiency of most-efficient models relative to MEPS or least-efficient labels .......... 49
Figure 22. Price vs. efficiency of 1-RT and 2-RT RACs.............................................................. 52
14Table of Tables
Table 1. Refrigerant transitions over time .................................................................................... 20
Table 2. Summary of primary data sources .................................................................................. 24
Table 3. Product categories by CC considered in this study and S&L programs of China, Japan,
and South Korea ............................................................................................................................ 25
Table 4. Highest-efficiency RACs in China (CC 0.75–2 RT) ...................................................... 28
Table 5. Summary of RAC market, S&L, and low-GWP refrigerants in China .......................... 29
Table 6. Highest-efficiency RACs in Europe (CC 0.75–2 RT) .................................................... 32
Table 7. Summary of RAC market, S&L, and low-GWP refrigerants in Europe ........................ 32
Table 8. Highest-efficiency RACs in India (CC 1–2 RT) ............................................................ 35
Table 9. Summary of RAC market, S&L, and low-GWP refrigerants in India ............................ 35
Table 10. Highest-efficiency RACs in Japan (CC 0.75–2 RT)..................................................... 37
Table 11. Summary of RAC market, S&L, and low-GWP refrigerants in Japan ......................... 38
Table 12. Highest-efficiency RACs (cooling-only type) in South Korea (CC 0.75–2 RT).......... 41
Table 13. Summary of RAC market, S&L, and low-GWP refrigerants in South Korea .............. 42
Table 14. Highest-efficiency ACs in the United States (mini-splits, CC 0.75–2 RT) .................. 45
Table 15. Summary of RAC market, S&L, and low-GWP refrigerants in the United States....... 45
Table 16. Highest-efficiency RACs in Indonesia (CC 0.75–2 RT) .............................................. 47
Table 17. Examples of high-efficiency, cost-competitive RACs with low-GWP refrigerants (CC
≤ 7.2 kW) ...................................................................................................................................... 53
Table A1. China’s energy-efficiency label thresholds for fixed-speed RACs.............................. 61
Table A2. China’s energy-efficiency label thresholds for variable-speed RACs ......................... 61
Table A3. The EU’s energy-efficiency classes and Eco-design requirements for RACs ............. 61
Table A4. Star ratings for RACs in India ..................................................................................... 62
Table A5. Japan Top Runner program’s target standards in APF for RACs ................................ 62
Table A6. South Korea’s energy-efficiency standards and labels for split ACs (cooling only) ... 62
Table A7. U.S. energy-efficiency standards for split ACs ........................................................... 63
Table A8. U.S. energy-efficiency standards for other central ACs and heat pumps .................... 63
Table A9. U.S. ENERGY STAR criteria for residential air source heat pumps and central ACs 63
Table B1. Highest-efficiency RACs identified in this studya ....................................................... 64
Table D1. Interregional conversion of seasonal energy efficiency for variable-speed (inverter-
driven) split ACs ........................................................................................................................... 66
Table E1. Comparison of selected Daikin Urusara 7 0.75-RT models ........ Error! Bookmark not
defined.
151. Introduction
Driven by increasing incomes, electrification, urbanization, and a warming world, demand for air
conditioners (ACs) in emerging economies with hot climates is expected to greatly increase energy
consumption. In the absence of implementation action under the Kigali Amendment to the
Montreal Protocol, 13 this increased demand would also greatly increase the use of
hydrofluorocarbon (HFC) refrigerants, which are replacing hydrochlorofluorocarbons (HCFCs);
in 2050, absent the Kigali Amendment, Article 5 (A5) Parties would have been expected to account
for more than 80% of global HFC use (Seidel et al., 2016). HFCs are currently the fastest-growing
greenhouse gases (GHGs), growing at the rate of 10%–15% every year. Improving the energy
efficiency of room ACs (RACs)14 while transitioning to low global warming potential (GWP)15
refrigerants is critical to reducing the energy and emissions impacts of the growing number of
RACs (Shah et el., 2017), while keeping implementation costs lower than they would be if these
activities were undertaken separately. This report provides analysis and evidence to support
establishment of energy-efficiency market-transformation programs such as standards, labeling,
procurement, performance assurance requirements for imports, and incentive programs for RACs,
which could also include a low-GWP refrigerant criterion.
Energy-efficiency policies can accelerate the adoption of cost-competitive, highly efficient
appliances and equipment to save energy, lower consumer electricity costs, shave peak load,
improve air quality, and reduce GHG emissions. The threshold at which products are recognized
as “highly efficient” is typically informed by the technical feasibility, commercial availability, and
cost-effectiveness of products that meet efficiency thresholds. Large multinational manufacturers
supply a significant share of RAC markets in most regions. Therefore, an understanding of the
highest-efficiency products available in several regions of the world will aid policymakers in
designing effective energy-efficiency market-transformation programs.
Formulating an energy-efficiency standard or other market transformation policy that considers
reduction of HFC and HCFC refrigerants requires information on the efficiency, refrigerants, and
costs of commercially available RACs. Because this information is often not readily available, we
address this data gap by performing an initial market assessment of energy-efficient RACs based
on the most current data at the time of our research. The information we have compiled (from
13
In 2016, the Parties to the Montreal Protocol adopted the Kigali Amendment to the Montreal Protocol to agree on
a global schedule for phasing down HFC refrigerants. The schedule consists of three groups of Parties, each with a
target phasedown date. Many of the A5 Parties, including China, Brazil, and all of Africa, will freeze the use of
HFCs by 2024. Collectively this group is known as “Group 1” of the A5 Parties. A small group of A5 Parties with
the world’s hottest climates—such as Bahrain, India, Iran, Iraq, Kuwait, Oman, Pakistan, Qatar, Saudi Arabia, and
the United Arab Emirates—have the most lenient schedule and will freeze HFC use by 2028. Collectively this group
is known as “Group 2” of the A5 Parties. See http://ozone.unep.org/en/article-5-parties-status for the list of the
Parties included as A5 Parties.
14
This study focuses on ductless split ACs, because the global RAC market is dominated by this type of unit, known
in the United States as mini-split ACs.
15
We use the term “low-GWP” to mean “lower than the baseline refrigerant being replaced.”
16March 2016 to July 2017, depending on economy, see Table 2) gives an up-to-date understanding
of the best available technology (BAT) levels of energy-efficient and low-GWP RACs in various
markets. This information can then be an input for research to determine a cost-efficiency
relationship for RACs and to test and model the highest-efficiency units. Such cost-efficiency
relationships can inform the design of market transformation programs for high efficiency and
low-GWP refrigerant using equipment such as standards, labeling, procurement, performance
assurance requirements for imports, and incentive programs.
The remainder of this report is organized as follows. Section 2 gives a brief overview of RAC
energy-efficiency and refrigerant trends. Section 3 describes the data sources and methodology we
employ to identify energy-efficient RACs and obtain information on the price of and refrigerants
used in each model. Section 4 describes energy-efficient RACs available in the economies studied.
Section 5 discusses the implications of our findings and possible future research.
172. Overview of air-conditioner energy-efficiency and refrigerant trends
Although designs and configurations vary by regional market, most ACs sold today use a vapor-
compression refrigeration cycle. Ductless split AC systems, on which this study focuses, are
common in the residential and commercial sectors almost everywhere except in the United States,
where ducted systems currently dominate but “mini-split” (ductless) systems have a gradually
increasing market share (Goetzler et al., 2016). RAC cooling capacities typically range from 1.75
to 18 kW (or 0.5–5 refrigeration tons [RT]16).
Energy efficiency and efficiency metrics
AC manufacturers continue to research and develop advanced technologies to improve
performance and reduce system costs. For example, variable-speed (or inverter) products that
make ACs highly efficient already dominate mature AC markets such as Australia, Europe, Japan,
and South Korea. Variable-speed compressors enable an AC unit to respond to changes in cooling
requirements, improving performance and reducing refrigerant flow rates compared to the
performance and refrigerant flow of conventional ACs with fixed-speed compressors that cycle on
and off (Shah et al., 2013).
Along with this trend, seasonal energy efficiency ratio (SEER) metrics have been designed to
estimate AC performance, based on part- and full-load operations at multiple temperature
conditions depending on climate. Local climatic conditions affect the amount of time an AC
operates at part or full load, so climate-specific weighting is used in calculating SEER to provide
a more representative measure of performance than the traditional energy-efficiency ratio (EER),
typically defined as rated cooling capacity (CC) over rated power input. 17 Difference in test
conditions and climate-specific weighting mean that direct conversion between regional metrics is
not possible. Appendix D provides a table for approximate conversion based on linear regression
of actual test data. These conversions are not sufficiently accurate to convert the performance of
individual models, but may be used to compare relative regional efficiency levels and metrics.
Although fixed-speed RAC units still dominate the markets in developing countries, the market
share of variable-speed RAC units is increasing. 18 For example, the market share in sales of
variable-speed RACs in China, the world’s largest RAC market, increased from 8% in 2007 to 65%
in 2016 (Li et al., 2016; JARN, 2017b). In India, variable-speed ACs—which account for about
16
Refrigeration tons indicate the nominal CC of the equipment where 1 ton = 12,000 Btu/h = 3.52 kW.
17
The International Organization for Standardization (ISO) standard 5151 defines EER as the ratio of the total CC to
the effective power input to the device at any given set of rating conditions, and it defines coefficient of performance
(COP) as the ratio of the heating capacity to the effective power input to the device at any given set of rating
conditions. We note that EER and COP have alternative definitions in certain regions.
18
Note: Shah et al (2016) found switching from fixed speed to inverter ACs saved ~21-26% of energy at an
incremental manufacturing cost of ~Rs 3600 – Rs 6300 (~US$55-96) i.e. roughly 25% incremental cost over a
baseline of Rs 14,500.
1810% of wall-mounted split AC products—are the fastest-growing category, achieving about a 40%
growth rate in sales between 2015 and 2016 (JARN, 2017i). The market share of variable-speed
RACs in Southeast Asia varies by country, from 5% to over 30%, and it is reported to be increasing
every year (JARN, 2016b). Typically, sales of variable-speed ACs tend to increase when the
energy savings from part-load operation due to the variable speed compressors are fully accounted
for in a seasonal metric (e.g. Seasonal Energy Efficiency Ratio (SEER) or Annual Performance
Factor (APF)). Hence, adopting SEER metrics will help further capture opportunities for reducing
future energy consumption, particularly in countries where large seasonal variations in climate
result in ACs running at part load for a larger amount of time (Shah et al., 2013).
Refrigerants
Refrigerants have changed several times, with the goal of improving safety and performance and
reducing environmental impacts. First-generation refrigerants were non-fluorinated substances
such as hydrocarbons (HCs), ammonia (NH₃), and carbon dioxide (CO₂). Second-generation
refrigerants were chlorofluorocarbons (CFCs, e.g., R-12) and HCFCs (e.g., R-22), which are
efficient, non-flammable, and non-toxic, but ozone-depleting and high GWP. Third-generation
refrigerants are HFCs (e.g., R-410A and R-134a), which are non-ozone depleting but often have
high GWP. Until 2012, most AC manufacturers making a transition from R-22 chose R-410A,
which is now the most widely used refrigerant in high-efficiency RACs. However, from about
2012, some Japanese manufacturers began a second transition from R-410A to R-32. The Indian
manufacturer Godrej leapfrogged R-410A and is making the transition directly from R-22 to R-
290. These transitions represent the trend toward fourth-generation refrigerants, which include
low-GWP HFCs (e.g., R-32), hydrofluoroolefins (HFOs) or HFO blends (e.g., R-452B, R-1234yf),
and natural refrigerants such as HCs (e.g., R-290) (Goetzler et al., 2016). Although current
technologies, including high-GWP refrigerants, can provide high-efficiency performance, the
ongoing transition to low-GWP refrigerants poses challenges for manufacturers developing and
deploying new products. Table 1 shows time frames and examples for each generation of
refrigerants.
19Table 1. Refrigerant transitions over time
Refrigerant Category Time Frame Example Refrigerants
HCs (butane, propane, naphtha,
gasoline), NH₃, carbon disulfide,
carbon dioxide, carbon
tetrachloride, dichlorethylene,
ethane, ethylamine, ethyl bromide,
1st Generation (“Toxic and Flammable”) 1830–1930
methyl bromide, methyl formate,
methylene chloride, methylamine,
methyl chloride, trichloroethylene,
and trimethylamine (Andersen et
al., 2013)
2nd Generation (“Safe and Durable”) but
1931–1990 CFCs, HCFCs (e.g., R-12, R-22)
Ozone-Depleting
3rd Generation (“Ozone-safe”) 1990–2010 HFCs (e.g., R-410A, R-134a)19
4th Generation (“Ozone-safe and Lower Low-GWP HFCs and blends (e.g.,
2010–now
GWP”) R-32 and R-452B), low-GWP
5th Generation (“Super-efficient and HFOs (e.g., R-1234yf), and HCs
2017–future
Sustainable” Low-GWP) (e.g., R-290), and others
We added the 5th generation to the 1st to 4th generations based on Calm (2008) and Goetzler et al. (2016). Andersen et
al. (2013) distinguish two periods in the 1 st generation: first toxic and flammable refrigerants used in industrial
facilities or to produce manufactured ice used in both commercial and residential applications and later toxic and
flammable refrigerants used in appliances in commercial and residential applications.
19
HFC 123 is low ODP, low GWP and energy efficient.
203. Data
To identify energy-efficient, affordable RACs with both conventional (e.g., R-410A) and low-
GWP (e.g., R-32, R-290) refrigerants, this report explores RAC products available primarily in six
economies—China, Europe, India, Japan, South Korea, and the United States—that account for
about 70% of global RAC demand, plus other developing economies in Southeast Asia (JRAIA,
2017). The data were collected from a) coordination with the Lawrence Berkeley National
Laboratory (LBNL) International Database of Efficient Appliances (IDEA) initiative; b) country-
specific databases such as those of the Energy Conservation Center Japan (ECCJ) and the Korea
Energy Agency (KEA); c) websites such as Topten China and Topten EU, which provide
information on the best-performing appliances and equipment, including RACs; d) web searches
and manufacturer catalogs; and e) interviews with industry experts. The LBNL IDEA data used in
this study were collected for ACs from retail sites in China, India, Indonesia, and the United States
(from March 2016 to July 2017, depending on economy, see Table 2). The LBNL IDEA software
combined the information from these sites and cross-referenced the resulting models against
certification data from the national appliance standards and labeling (S&L) programs. The
subsections below describe each data source and methodology used in our analysis.
China
We obtained a data set of about 2,000 models from the IDEA, which automatically collects
information at regular intervals from an array of online retailers and manufacturer websites across
different markets and appliance categories (see Gerke et al., 2017 for more details about the
database). The IDEA AC data used in this study were collected in 2016 from retail sites in China.
The IDEA software combined the information from these sites and cross-referenced the resulting
models against the certification data from the China National Institute of Standardization (CNIS)
appliance S&L program to ensure that only models available on the market are listed.20 From the
data, we identified 578 variable-speed AC models for which we have sufficient information to
evaluate efficiency and retail price.
We additionally reviewed the models listed by Topten (approximately 50 energy-efficient models),
which provides information on the most efficient appliances and equipment, including RACs, in
that country and China’s Energy Efficiency “Top Runner” Program 21 (45 models), which is
designed to distinguish super-efficient models, listed in March 2016. This report shows the
efficiency distribution of the 578 models identified from the IDEA as well as the highest-efficiency
models selected from all available sources (see Section 4.1).
LBNL IDEA
20
Not all models registered to the government database may be searchable online.
21
In December 2014, China announced plans to implement a voluntary Energy Efficiency Top Runner Program to
help distinguish super-efficient models, with possible future subsidies for super-efficient products. Qualifying
products that are recognized as Energy Efficiency Top Runners based on their score ranking will receive an “Energy
Efficiency Top Runner” designation on the China Energy Label (Shah et al., 2017).
21 Products listed in the CNIS database
Topten China
Energy Efficiency “Leader” (“Top Runner”) China
Europe
We obtained a data set of 96 energy-efficient models listed in November 2016 on the Topten EU
website, which provides information on the most efficient appliances and equipment, including
RACs, in the European Union (EU) countries. We collected information on price and additional
high-efficiency models through web searches. This report shows the efficiency distribution of the
96 models and selected highest-efficiency models (see Section 4.2).
Topten EU
Web searches
India
We obtained a data set of 785 models from the IDEA, including 472 fixed-speed models, 16
variable-speed models, and 297 unspecified models, based on the AC data collected in 2016 from
retail sites in India. The IDEA software combined the information from these sites and cross-
referenced the resulting models against the data associated with the Indian Bureau of Energy
Efficiency (BEE) appliance Star Rating program. From the data, we identified 11 variable-speed
AC models for which information is sufficient to evaluate efficiency. We also obtained a data set
of 123 highest-efficiency AC models listed in February 2017 on a website (Bijli Bachao) that is
an Indian equivalent of Topten, of which 73 are fixed speed and 50 are variable speed. Four of the
11 variable-speed models selected from the IDEA were included in Bijli Bachao’s top 10 most-
efficient ACs list. Based on these two data sets and recent reports, we finally selected 57 energy-
efficient AC models in India. This report shows the efficiency distribution of the 57 energy-
efficient models and selected highest-efficiency models (see Section 4.3).
Bijli Bachao website
Bureau of Energy Efficiency, Government of India
LBNL IDEA
Japan
We obtained a data set of about 2,900 models (all reversible-type products, which have both
cooling and heating functions, i.e., heat pumps, registered from October 2006 to September 2016)
from the ECCJ database. Products registered from 2014 to 2016 account for 54% of the database.
We collected price information through web searches. This report shows the efficiency distribution
of 2,922 models and selected highest-efficiency models (see Section 4.4).
Energy Conservation Center Japan database
Price information (last access on March 2017)
22South Korea
We obtained two data sets totaling approximately 2,000 models available in South Korea from the
KEA database. These products were registered to the database between January 2013 and
November 2016. We collected price information through web searches. This report shows the
efficiency distribution of 1,309 cooling-only and 638 reversible models as well as selected highest-
efficiency models (see Section 4.5).
Korea Energy Agency database
Price information (last access on March 2017)
United States
Although split ACs in the United States are primarily ducted systems, this report uses efficiency
data for ductless split (mini-split) ACs. We obtained a data set of 836 mini-splits from the IDEA.
The IDEA data used in this study were collected in 2017 from U.S. retail sites. The IDEA software
combined the information from these sites and cross-referenced the resulting models against data
from the U.S. Department of Energy (US DOE) Compliance Certification Database. We also
reviewed data of mini-splits registered to the databases of the Consortium for Energy Efficiency
(CEE) Directory of Efficient Equipment (supported by the Air-Conditioning, Heating and
Refrigeration Institute [AHRI]) and the ENERGY STAR Most Efficient program. This report
shows the efficiency distribution of 836 models and selected highest-efficiency models (see
Section 4.6).
LBNL IDEA
U.S. Department of Energy’s Compliance Certification Database
CEE-AHRI Directory of Efficient Equipment database
ENERGY STAR Most Efficient program
Other countries
We provide RAC market information for Indonesia and the Philippines, where affordable but
relatively less-efficient RACs are still dominant. We obtained a data set of 335 RACs from the
IDEA. The IDEA data used in this study were collected in 2017 from retail sites in Indonesia. The
IDEA software combined the information from these sites and cross-referenced the resulting
models against data from Indonesia’s Ministry of Energy and Mineral Resources (MEMR)
database. We also obtained a data set of RACs from the Philippine Department of Energy database.
We discuss recent market trends in developing countries based on information from commercially
available sources such as Japan Air Conditioning, Heating and Refrigeration News (JARN).
Table 2 summarizes the region-specific data collected for this analysis.
23Table 2. Summary of primary data sources
Region Sources AC Models Analyzed
LBNL IDEA (updated 07/2016) 578 variable-speed AC models (all
CNIS database reversible type) from LBNL IDEA
China
Topten China (updated 03/2016) Highest-efficiency models selected
Top Runner China (listed 03/2016) from all available sources
Topten EU (updated 11/2016) 96 highest-efficiency single split AC
EU
models (all reversible type)
LBNL IDEA (updated 09/2016) 57 highest-efficiency variable-speed
India BEE database AC models (all cooling-only type)
Bijli Bachao (updated 02/2017) selected from the two sources
ECCJ database (registered 10/2006– 2,922 split AC models (all reversible
Japan
09/2016) type)
KEA database (registered 01/2013– 1,309 cooling-only AC models
South
11/2016) 638 reversible-type AC models (heat
Korea
pumps)
LBNL IDEA (updated 07/2017) 836 mini-split models from LBNL
US DOE Compliance Certification IDEA
Database Highest-efficiency models selected
United
CEE-AHRI Directory of Efficient from all available sources
States
Equipment
ENERGY STAR Most Efficient
2017
LBNL IDEA (updated 02/2017)
Indonesia 335 AC models from LBNL IDEA
MEMR database
697 split AC models from the
Philippines Government database
government database
Price information for ACs in the European Union (EU), Japan, and South Korea was collected through web searches
between November 2016 and March 2017.
244. Review of energy-efficient air conditioners by region
This section reviews RAC performance data by region and product category, and it identifies RAC
models for further analysis. We begin by categorizing RAC products based on key characteristics,
i.e., type (cooling-only/reversible, fixed-speed/variable-speed) and size by CC. We select energy-
efficient products in each product category for the eight economies studied. We then review the
selected products by refrigerant and price data. Energy-efficiency S&L requirements for RACs in
the EU, India, and the United States do not differ by CC—that is, S&L requirements do not
decrease as CC increases. However, China, Japan, South Korea, and some other Asian countries
set different S&L requirements by CC, because the energy efficiency of AC compressors (e.g.,
rotary compressors) tends to decrease as the size (CC) increases. Major AC manufacturers
typically optimize compressor efficiency by taking advantage of the fact that variable-speed
compressors can operate at a wide range of frequencies. Table 3 shows the product categories by
CC considered in this study and S&L programs of China, Japan, and South Korea.
Table 3. Product categories by CC considered in this study and S&L programs of China,
Japan, and South Korea
CC (values in kW unless otherwise specified)
This study CC ≤ 2.8 2.8 < CC ≤ 4.5 4.5 < CC ≤ 6.0 6.0 < CC ≤ 7.1 > 7.1
Typical AC unit
2.6 3.5 5.3 7.0 10.5
size by CC (tons
(0.75 RT) (1 RT) (1.5 RT) (2 RT) (3 RT)
of refrigeration)
China CC ≤ 4.5 4.5 < CC ≤ 7.1 7.1 < CC ≤ 14.0
3.2 < CC 4.0 < CC 5.0 < CC ≤ 6.3 < CC ≤
Japan CC < 3.2 7.1 < CC ≤ 28.0
≤ 4.0 ≤ 5.0 6.3 7.1
South Korea CC < 4 4 ≤ CC < 10 10 ≤ CC < 17.5
According to recent data from the Japan Refrigeration and Air Conditioning Industry Association,
global RAC demand—including split and window types—is about 85–91 million units annually.
China, Europe, India, Japan, South Korea, and the United States account for about 70% of the
demand (JRAIA, 2017). Because model-specific sales data were unavailable, we calculate the
product-weighted market share22 of commercially available models (or highest-efficiency models)
by manufacturer in each region, which could be different from the sales-weighted market share.
See Appendix A for regional energy-efficiency S&L requirements for ACs.
For example, manufacturer A’s product-weighted market share is calculated by dividing the total number of
22
manufacturer A’s models by the total number of all manufacturers’ models in the data set.
254.1. China
China has the largest RAC market in the world, with domestic sales in China accounting for about
43%–47% of the global RAC market (JRAIA, 2017). The market share of variable-speed inverter
RACs increased from 7% in 2007 to over 60% in 2016 (Li et al., 2016; JARN, 2017b). Chinese
manufacturers also started selling R-32 RACs in China and exporting to Australia, Southeast Asia,
and Europe (JARN, 2017b). Top-tier Chinese manufacturers (e.g., Gree, Midea, and Haier) have
also developed R-290 RACs and completed retrofits of production lines23 for them with support
of the United Nations Montreal Protocol Multilateral Fund Demonstration Project. However, there
are no or few R-290 RACs commercially available on the market, except for some installed units
for demonstration only. (JARN, 2016a, 2015).
In China, minimum energy performance standards (MEPS) were introduced for fixed-speed RACs
in 1989 and revised in 2004 (effective from 2005 on) and 2010 (effective from 2010 on). MEPS
and labeling requirements for variable-speed units were introduced separately in 2008 and revised
in 2013 (Baillargeon et al., 2011; Li et al., 2016; Fridley et al., 2016). The Chinese AC efficiency
metrics for variable-speed ACs are a SEER for cooling-only products and annual performance
factor (APF) for reversible-type products (i.e., heat pumps). Those are defined by the Chinese AC
efficiency standard GB 21455-2013. Both China’s SEER and APF are consistent with the cooling
seasonal performance factor (CSPF) and the APF defined by ISO 16358, but they use a China-
specific outdoor temperature profile. The Chinese efficiency metric for fixed-speed ACs is the
EER, CC over power consumption at full-load, defined by the Chinese AC efficiency standard GB
12021.3-2010 and consistent with the definition of ISO 5151.
We obtained data from the LBNL IDEA on 2,024 AC models in China. Of these, we identified
578 split variable-speed reversible-type AC models for which information is available on capacity,
efficiency, refrigerant, and price. Figure 1 shows the AC model data by CC and efficiency. The
product-weighted average APF and CC of the select models are 3.9 and 4.1 kW, respectively.
Nearly all selected products use R-410A refrigerant. The efficiency of the six models that use the
low-GWP refrigerant R-32 is low, ranging from APF 3.2 to 3.7, compared to the full efficiency
range of APF 3.1 to 5.4, leading to the finding that at least in China, low-GWP R-32 refrigerant is
being used even with lower efficiency technology. The most stringent labels, i.e., Grade 1
requirements (see Table A2 in Appendix A), are met by 18% of the models. Figures 2 and 3 show
the data by manufacturer. Although Chinese manufacturers (such as Haier, Midea, Gree, Aux,
Chigo, and Changhong) account for more than 60% of the total 2,024 models, five manufacturers
(Haier, Midea, and Gree headquartered in China, and Mitsubishi and Daikin headquartered in
Japan) represent approximately 62% of the 578 variable-speed models selected.
23
As of the end of 2015, China’s RAC industry completed a total of 19 production lines of R-290 RACs and
transformed four production lines of R-290 compressors (JARN, 2017g).
26You can also read