Assessing shop completeness in OpenStreetMap for two federal states in Germany
←
→
Page content transcription
If your browser does not render page correctly, please read the page content below
AGILE: GIScience Series, 2, 20, 2021. https://doi.org/10.5194/agile-giss-2-20-2021
Proceedings of the 24th AGILE Conference on Geographic Information Science, 2021.
Editors: Panagiotis Partsinevelos, Phaedon Kyriakidis, and Marinos Kavouras.
This contribution underwent peer review based on a full paper submission.
© Author(s) 2021. This work is distributed under the Creative Commons Attribution 4.0 License.

Assessing shop completeness in OpenStreetMap for two federal
states in Germany
Josephine Brücknera (corresponding author),Moritz Schotta , Alexander Zipfa,b and Sven
Lautenbacha,b

ww400@uni-heidelberg.de, moritz.schott@uni-heidelberg.de, zipf@uni-heidelberg.de, sven.lautenbach@heigit.org

a
    Institute of Geography, GIScience, Heidelberg University, 69120 Heidelberg, Germany
b
    HeiGIT at Heidelberg University, 69120 Heidelberg, Germany

Correspondence: Josephine Brückner (ww400@uni-heidelberg.de)

Abstract. The completeness of the number of Open-                               terest in being well represented in these POI collec-
StreetMap (OSM) retail stores was estimated for two                             tions for advertisement and visibility reasons. While
federal states of Germany at district level. An intrinsic                       big players such as Apple, Google and Microsoft
measurement was applied that fits saturation models                             dominate the market, the Volunteered Geographic In-
on the cumulative curve of the number of OSM retail                             formation project OpenStreetMap (OSM) provides
stores over time. Even though the mean completeness                             an established non-commercial crowd sourced al-
of retail stores was estimated high in both states, the                         ternative. OSM contains an enormous amount of
values within the states varied between 42 % and 100                            various geodata, that are continuous edited by the
%. The question therefore arises in which areas retail                          great number of more than 7.5 million volunteers
stores are well represented in OSM and whether eco-                             (state of March 2021, OpenStreetMap contributors
nomically weaker regions are possibly also digitally                            (2021)). The open nature of the OSM project ad-
disadvantaged on the map. We investigated the influ-                            ditionally provides the potential to cast niches for
ence of the urban-rural gradient as well as the influence                       specialized services such as for shops without pack-
of socioeconomic factors (gross domestic product, the                           aging (https://cartovrac.fr), cigarette vending ma-
unemployment rate, the proportion of academics) on                              chines (http://www.ubahnverleih.de/osm/zigaretten) or
the estimated completeness by means of a general-                               farm shops (https://farmshops.eu). According to
ized linear model. Our results indicate that average big                        https://taginfo.openstreetmap.org/keys/shop 4.5 mil-
cities with low unemployment rate are better mapped                             lion objects with the key shop=* existed in OSM at
with respect to retail stores.                                                  the end of March 2021. Especially in Germany where
                                                                                the active OSM community has created an extremely
Keywords. VGI, OpenStreetMap commpleteness, in-                                 rich data set that is well known and used, OSM would
trinsic quality analysis, limited growth functions                              be suitable as a flexible platform for online-shop-
                                                                                searching and navigation apps. The advantage of OSM
                                                                                over commercial providers of geodata is the free avail-
                                                                                ability under the Open Data Commons Open Database
1      Introduction                                                             License that allows an unrestricted use in many com-
                                                                                mercial or non-commercial applications. A persistent
                                                                                question for the usability of OSM is the quality of
The ubiquity of smartphones has lead to a continu-
                                                                                its data base. OSM roads are often mapped first and
ous availability of geodata. In day to day life, espe-
                                                                                are now considered almost complete in many regions
cially at less familiar locations, shops and restaurants
                                                                                (Zielstra and Zipf, 2010). Due to the high growth rates
are some of the most frequently searched points of in-
                                                                                of OSM in recent years, a high completeness can also
terest (POI). Having an up to date and complete col-
                                                                                be assumed for other objects such as buildings or
lection of these POIs is of great interest for the po-
                                                                                stores.
tential customers. Shop owners equally have great in-

                                                                                                                                  1 of 7
Even though extensive research has been carried out                    Table 1. Regional data and economic information of Baden-
on the OSM data quality, no single study exist - to the                Württemberg and Saxony: Number of administrative dis-
best of our knowledge - on the completeness of OSM                     tricts, the GDP in 1000 euros per employed person (for
retail stores. Such an investigation is not only neces-                2016), unemployment rate as percentage of unemployed in
sary to clarify for which areas OSM data is suitable for               the civilian labor force (for 2017), proportion of academics
                                                                       as employees to social security contributions at the place of
shop finding platforms, but also to clarify the usability
                                                                       residence with an academic qualification per 100 inhabitants
of OSM for researchers to analyze spatio-temporal pat-                 of working age, total area and population density (2019) of
terns of the stationary retail sector. In addition, knowl-             the respective federal state.
edge on influencing factors on shop-completeness can
be used to predict, which parts of the physical world                                                       Baden-      Saxony
are digitally mapped or digital lacking and to counter-                                                Württemberg
act a digital disadvantage of retailers in particular re-
gions, that may even already be economically weaker.                    Rural districts                            9          8
Moreover, the socio-economic system of retailing is an                  Urban districts                           27          2
                                                                        Independent cities                         8          3
interesting study field in OSM, because it can be as-
sumed, that - in contrast to roads - local knowledge is                 GDP [1000 e per employed                73.6       57.2
necessary to locate, tag and add specific information                   person]
(e.g. opening hours) to these locations.                                Unemployment rate [%]                     3.5       6.8
For these reasons, this study examined the complete-                    Academics per 100 inhabi-                 9.3      10.2
ness of retail stores, a main quality criterion for                     tants
online-searching-platforms, using the case study of                     Area [km2 ]                            35673     18449
two economically different states in Germany, Baden-                    Inhabitants per km2                      311       221
Württemberg and Saxony. We further investigated how
the urban-rural gradient and socio-economic factors
(gross domestic product, unemployment rate and pro-
portion of academics) were associated with complete-                   a non-linear regression approach. Baden-Württemberg
ness of OSM retail stores.                                             and Saxony were particularly suitable for this intrinsic
                                                                       investigation, as no bulk data imports of retail stores
                                                                       into the OSM database have been recorded so far.
2   Methods and data
                                                                       2.1   Experimental setup
OSM quality analyses can be categorised into extrinsic
or intrinsic approaches. Extrinsic approaches compare                  Retail stores are defined as places, where goods or ser-
OSM with an external data set of presumably higher                     vices are sold to the final consumer (Bankim and Vaja
quality (see for example Zielstra and Zipf (2010); Ar-                 (2015)). Our analysis was restricted to stationary re-
sanjani et al. (2015); Hecht et al. (2013); Törnros et al.             tail stores, that were tagged as “shop” or “amenity”
(2015); Fan et al. (2014); Neis et al. (2012). A major                 and that were listed in the OSM Wiki (OSM Wiki
drawback of extrinsic approaches is the necessity for                  (26.02.2021)). We included all key-value combinations
a compatible external data set, which may not always                   that could not be clearly excluded from retail trade (for
be available. For example for shops, official statistics,              a detailed list of the used tags see the linked source
if available at all, may only be in reference to a cer-                code in section 2.2). These included combinations of
tain level of administration and a specific definition of              retail trade and direct marketing - such as farm shops -
’retail’, that cannot be directly transferred to the defini-           or services - such as car repair shops.
tion of OSM. Therefore, we assess the fitness for pur-                 The research area is characterized by contrasts, both
pose of an intrinsic completeness estimation using only                economically and in the degree of urbanisation. Baden-
OSM data itself (see Ballatore and Zipf (2015); De-                    Württemberg, located in South Germany, has been one
grossi et al. (2017); Barron et al. (2014); Barrington-                of the economically strongest federal states of Ger-
Leigh and Millard-Ball (2017) for some examples on                     many. Saxony in East Germany has been economically
intrinsic OSM data quality assessment).                                weaker. Altogether, both states contain 57 administra-
The underlying idea of the intrinsic completeness anal-                tive districts of rural as well as urban character (ta-
ysis is that the added number of OSM objects of a                      ble 1).
specific feature class per time period decreases as the                We fitted various limited growth curves to the OSM
number of mapped objects converges against the (un-                    history for each administrative district and estimated
kown) true number of objects. The cumulative number                    the completeness level via their saturation parameter.
of OSM objects would then saturate. Given a sufficient                 The curves used originate from two families. On one
mapping activity it is possible to estimate the satura-                hand, the family of sigmoid curves seems adequate
tion level using a suitable function in the context of                 for a three-phase mapping process as also described

AGILE: GIScience Series, 2, 20, 2021 | https://doi.org/10.5194/agile-giss-2-20-2021                                           2 of 7
by Barrington-Leigh and Millard-Ball (2017). On the                    based on two criteria: i) the relative residual standard
other hand, curves of the non-logistic growth curves                   error and ii) the relative deviation of the slope between
family tend to represent a mapping process without the                 the historic development and the fitted curve during the
initial phase of slow growth. In this analysis, we used                last two years of the analysis period. If both criteria
the following functions: the three and four parameter                  contradicted each other, the selection was made based
logistic function (equation 1 and 2), that are assigned                on visual assessment. The completeness level was esti-
to the sigmoid curve family as well as the rectangular                 mated as the quotient of the current number of retail
hyperbola (equation 3) and the asymptotic function (4)                 stores and the asymptote of the estimated saturation
of the non-logistic growth curves family .                             curve.
                                                                       Finally, we investigated the influence of factors on the
                                                                       completeness level based on a generalized linear model
         Asym
y=         tmid −t                                       (1)           (GLM) with a negative binomial distribution and a log-
     1+e    scale
                                                                       link. We used the estimated asymptote (the estimated
                                                                       number of retail stores) as the response variable and
                                                                       used the logarithm of the number of shops as an offset.
                     Asym − Asymlow                                    This standard procedure allowed to model the relation
y = Asymlow +                tmid −t                     (2)
                       1+e    scale                                    between estimated and observed counts without mix-
                                                                       ing up distributional assumptions. Since completeness
                                                                       was inversely proportional to the asymptote, negative
     Asym ∗ t                                                          coefficients of the regression indicated a higher com-
y=                                                       (3)
     t1/2 + t                                                          pleteness level, whereas positive coefficients meant a
                                                                       lower completeness level.
                                                                       We examined the influence of the urban-rural gradi-
y = Asym + (y0 − Asym) ∗ e        −elrc ∗t
                                                         (4)           ent by the district type of the administrative units de-
                                                                       fined by Bundesinstitut für Bau-, Stadt- und Raum-
                                                                       forschung (2019). Type 1 are independent cities with
where:
                                                                       at least 100,000 inhabitants. Type 2 are urban dis-
                                                                       tricts with a medium population density of at least
 Asmp    = a numeric parameter representing the
                                                                       150 inhabitants/km2 . Type 3 are rural districts with a
           saturation to which the curve
                                                                       low population density less than 150 inhabitants/km2 .
           converges
                                                                       We tested in addition the effects of three socio-
 Asmplow = lower Asymptote
                                                                       economic factors as predictors: the gross domestic
 t       = time at which half the saturation level
                                                                       product (GDP) in 1000 euros per person in employ-
           is attained
                                                                       ment (for 2016), the unemployment rate as the per-
 tmid    = mid point of the logistic curve
                                                                       centage of unemployed in the civilian labor force (for
 scale   = the steepness of the logistic curve
                                                                       2017) and the proportion of academics as employees to
 t1/2    = time, 50 % saturation
                                                                       social security contributions at the place of residence
 y0      = parameter, that specifies the value of y
                                                                       with an academic qualification per 100 inhabitants of
           (here count of OSM contributions) at
                                                                       working age (for 2017). We hypothesized that the com-
           the begin of the period
                                                                       pleteness level would increase along the rural-urban
 rc      = ’rate constant’, parameter that
                                                                       gradient and with higher GDP, lower unemployment
           determines the spread of the curve
                                                                       rate and higher share of academic employees. These
           with time
                                                                       hypotheses are based on Neis et al. (2013) who found
 lrc     = log of the ’rate constant’
                                                                       a positive link between urban and OSM activity as well
                                                                       as GDP and OSM activity.
The reliability of estimation the number of retail stores
in a district depends on the development of OSM con-
tributions in several ways. First and foremost, the data               2.2   Software and data availability
history was checked for a decline in growth at all, that
is a fundamental criterion to estimate a saturation level              Monthly counts of shops were extracted from OSM
as a proxy for the number of retail stores.                            using the ohsome API at https://api.ohsome.org to
Fitted models were filtered for unrealistic fits where                 query the OpenStreetMap History Database (OSHDB)
the asymptote was estimated to be lower than the cur-                  (Raifer et al., 2019) for the time frame 01.01.2008 until
rent number of OSM retail stores. To account also for                  01.01.2020.
the uncertainty of the models, we accepted fits whose                  The data for the administrative units were taken from
asymptote was at most 2% lower than the actual lat-                    German federal agency for geodesy and cartography
est amount. We chose the best fitting functional form                  (Bundesamt für Kartographie und Geodäsie, http://
of all accepted curves for each administrative district                gdz.bkg.bund.de) (reference 01.01.2020).

AGILE: GIScience Series, 2, 20, 2021 | https://doi.org/10.5194/agile-giss-2-20-2021                                       3 of 7
The data for the influencing factors GDP, unemploy-
ment rate, proportion of academics as well as the clas-
sification into district types originate from the federal
institute for Research on Building, Urban affairs and
Spatial Development (Bundesamt für Bau-, Stadt- und
Raumforschung, INKAR, https://www.inkar.de/).
Further statistical information (population density,
area) were queried via the regional database of Ger-
many from the statistical offices of the federation and
the federate states (Statistische Ämter des Bundes und
der Länder, Regionaldatenbank Deutschland https:// (a) sigmoid curve family
www.regionalstatistik.de/genesis/online/, data licence
Germany – attribution – Version 2.0 www.govdata.de/
dl-de/by-2-0).
The analysis was performed in R (R Core Team,
2021), using the packages sf (Pebesma, 2018), RCurl
(Temple Lang, 2021), geojsonio (Chamberlain and
Teucher, 2021), tidyverse (Wickham et al., 2019),
ggplot2 (Wickham, 2016) and ggpubr (Kassambara,
2020).
All source code, preprocessed data and results
can be found at https://github.com/GIScience/ (b) non-logistic curve family
shop-completeness.
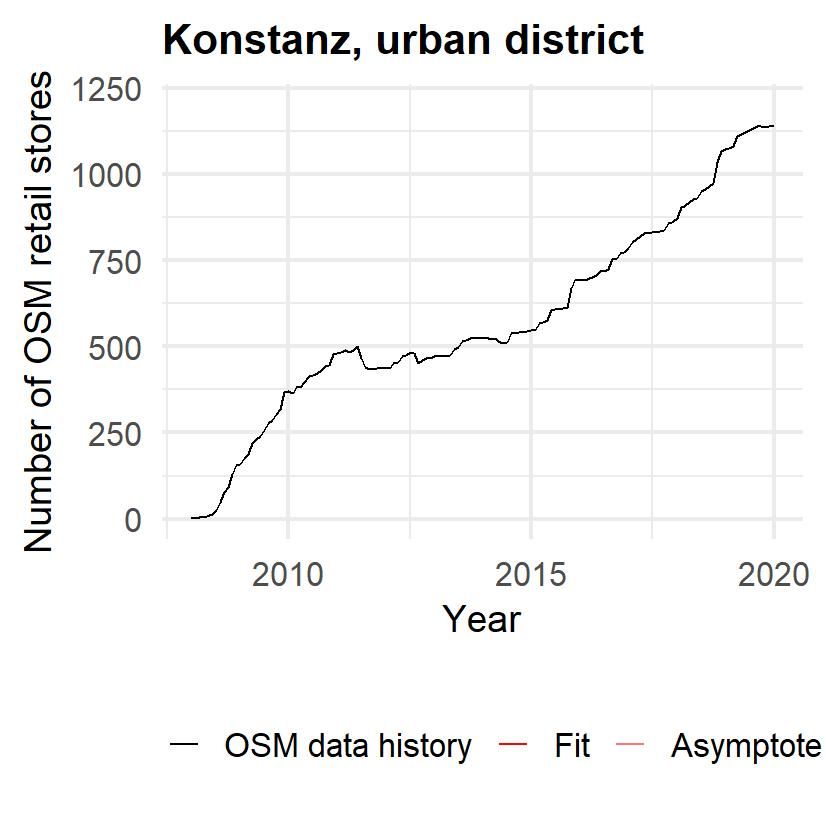
3 Results
Well fitting saturation models were generated for 44 of
the 57 districts in both federal states. For five districts
the data history showed a steady high increase in the
number of OSM retail stores and did not indicate any
slow down in growth rate while eight regions produced
low quality saturation models (figure 1c) due to com-
plex temporal pattern. These issues occurred indepen-
dent of influencing factors such as population density (c) no suitable fit
due to non continuous mapping activities and the re-
spective regions had to be ignored for the GLM. The Figure 1. Non-linear regression of varied curves to data his-
non-linear fit of a sigmoid curve produced the best re- tory of OSM retail stores
sults for 28 districts (figure 1a), while a non-logistic
curve showed the best fit for 16 districts (figure 1b). Table 2. Number of districts for which a sigmoid fit, a non-
Ten of the thirteen districts for which no saturation logistic fit, and none of the fits were considered reasonable
level could be estimated were visually categorized as for the completeness estimation as well as the percent com-
relatively far from saturation (table 2). pleteness as mean for the respective federal state.
The mean completeness level of Baden-Württemberg
was approximately 88 %, slightly higher than the mean Baden- Saxony
Württemberg
value of Saxony of about 82 %. The completeness
ranged from 42 % to almost 100 %. Even though the Sigmoid curve family 21 6
results showed heterogeneity in the completeness, the Non-logistic curve family 14 3
majority of 38 districts achieved at least 80 %. No suitable fit 9 4
Completeness was significantly higher in the indepen- Avg. Completeness [%] 88 82
dent cities than in the urban and rural districts (table 3).
The completeness level of the data decreased signifi-
cantly with a higher unemployment rate. In total, the However, districts, that were clearly not saturated,
GLM explained 18 % of the deviance in the data. were mostly of type rural or urban district and had a
Districts, for which no suitable saturation model could GDP, a proportion of academic as well as an unem-
be estimated, were represented in all district types. ployment rate slightly below the average of each fed-
AGILE: GIScience Series, 2, 20, 2021 | https://doi.org/10.5194/agile-giss-2-20-2021 4 of 7eral state. Fitting a binomial GLM with a log-link (a dent cities - the district type with the highest popula-
logistic regression) did not reveal any significant re- tion density - was similar to those reported by stud-
lationship between the four predictors and successful ies on the completeness of other OSM feature classes
fitting of a saturation curve. However, if compared vi- (Zielstra and Zipf, 2010; Mashhadi et al., 2015; Wang
sually for each district category unemployment was et al., 2020). However, the completeness for the cat-
higher on average for those districts where the satu- egory urban districts could not be distinguished from
ration level could not be estimated reliably. the completeness of rural districts. So the hypothesis,
that completeness increases with the rural-urban gradi-
Table 3. Coefficient estimates, standard errors and p-values ent was not supported by our data.
of the GLM for the 44 districts with a reasonable fit of the The relatively small sample size makes the results sen-
asymptote. Coefficients and standard errors are provided at
sitive to outliers. Two rural districts could be identi-
the link scale. The response was the asymptote - for a given
observed count (included as an offset in the model) complete-
fied as influential by means of the usual regression di-
ness goes up if the asymptote is lower. Negative coefficients agnostics: “Nordsachsen” with the lowest of all esti-
therefore indicate a positive effect on completeness and vice mated completeness levels (42%) with a high leverage
versa. Rural districts were used as the reference level - the and a high cook’s distance and "Görlitz" with a high
coefficient therefore represents the intercept. The θ parame- leverage. If both districts would be omitted simultane-
ter of the binomial distribution was estimated as 54.5 with a ously, regression coefficients estimates would remain
standard error of 12.3. the same with slightly higher standard errors due to
the reduced sample size. If only "Görlitz" would be
Factor Estimate std. error p-value ommited, the regression coefficients would be of sim-
Rural districts 0.026 0.076 0.733 ilar magnitude and sign but if "Nordsachsen" would
Urban districts 0.009 0.050 0.859 be omitted all coefficient estimates would render in-
Independent -0.140 0.066 0.033 significant. Since we had to exclude districts with low
cities completeness since we could not reliably estimate the
Unemployment 0.037 0.014 0.01
saturation level, and those districts show a tendency
rate [%] for higher unemployment rate and to belong to rural
or urban district types our results might be to conser-
vative. To prove and clarify the effects of the factors
on the completeness, further studies including a larger
amount of data are necessary.
4 Discussion
The major challenge of the intrinsic completeness es-
timation is the selection of the best fit among multi-
In comparison to previous studies e.g. on the complete-
ple options. Additionally, using different models to es-
ness of OSM buildings in Germany ((Törnros et al.
timate the completeness makes comparison of results
(2015))), the estimated completeness of retail stores in
for different districts more challenging. In our analy-
OSM was relatively high. It is in general more prob-
sis, curves of the non-logistic curve family tended to
lematic to estimate the saturation level for incomplete
estimate a higher asymptote - and therefore a lower
districts than for complete districts. With this in mind,
completeness level - than curves of the sigmoid fam-
the mean completeness values tended to be overesti-
ily.
mated since districts with lower saturation are not con-
sidered. Saturation may also occur due to a decrease in However, the diversity of OSM contribution histories
mapping activity resulting in a false intrinsic estimate seems to not allow a "one fits all" approach. We have
of completeness. In our analysis, a sufficient number of started to extend our research in this direction to over-
active users was present in all districts which provides come this limitation.
reasonable support for the assumption that saturation
did not occur to a lack of user activity. Events, such as
bulk data imports or mapping parties affect the form of 5 Conclusion and outlook
the data history and require fitting functions of respec-
tive forms. In our analysis, the data history of only 8 of
the 57 districts showed one of this deviating forms, due The presented approach allowed a reliable complete-
to which no suitable fit function was found. However, it ness estimation and comparison of OSM data between
might be suitable to included additional function types regions with individual contribution histories. This
such as multiple sigmoid forms as well as step forms in study was applied to the use for case of retail stores
other regions and for other OSM feature class, whose but the approach may be transferred to e.g. roads or
data history reflects such events. land use data by substituting the store count with road
network length or land use area.
The higher data completeness found for districts with
a low unemployment rate was consistent with our hy- The estimated completeness level of more than 86 %
pothesis. The higher completeness level of indepen- on average indicated the high potential of OSM to
AGILE: GIScience Series, 2, 20, 2021 | https://doi.org/10.5194/agile-giss-2-20-2021 5 of 7be used as a database for platforms offering online- Hecht, R., Kunze, C., and Hahmann, S.: Measuring
shop-searching in densely mapped countries such as Completeness of Building Footprints in OpenStreetMap
Germany. For a real world application, further qual- over Space and Time, ISPRS International Journal of
ity elements like positional accuracy and moreover the Geo-Information, 2, 1066–1091, https://doi.org/10.3390/
completeness of the various attributes, such as opening ijgi2041066, 2013.
hours, contact information as well as accessibility’s, Kassambara, A.: ggpubr: ’ggplot2’ Based Publication Ready
would also need to be investigated. Future research Plots, https://CRAN.R-project.org/package=ggpubr, r pack-
should further study how the completeness differ in the age version 0.4.0, 2020.
various types of retail stores, such as supermarkets or Mashhadi, A., Quattrone, G., and Capra, L.: The Impact of
clothing stores, to identify lacks regarding store types. Society on Volunteered Geographic Information: The Case
of OpenStreetMap, in: OpenStreetMap in GIScience, edited
The results of the GLM suggest that especially big by Arsanjani, J. J., Zipf, A., Mooney, P., and Helbich, M.,
cities with low unemployment rates can be expected Lecture Notes in Geoinformation and Cartography, pp. 125–
to be of higher completeness of retail stores and there- 141, Springer, Cham, Heidelberg, New York, Dordrecht,
for presumably fit for purpose. Furthermore, we expect London, 2015.
of OSM to catch up in disadvantaged areas soon. This Neis, P., Zielstra, D., and Zipf, A.: The street network evo-
is due to the high estimated completeness level of re- lution of crowdsourced maps: OpenStreetMap in Germany
tail stores compared to previous studies of other feature 2007–2011, Future Internet, 4, 1–21, 2012.
classes, that demonstrate the continued growth of OSM
Neis, P., Zielstra, D., and Zipf, A.: Comparison of Volun-
and the overall high activity of the OSM community.
teered Geographic Information Data Contributions and Com-
munity Development for Selected World Regions, Future In-
ternet, 5, 282–300, https://doi.org/10.3390/fi5020282, 2013.
References OSM Wiki: Key:amenity, https://wiki.openstreetmap.org/
wiki/DE:Key:amenity, 26.02.2021.
Arsanjani, J. J., Mooney, P., Zipf, A., and Schauss, A.: Pebesma, E.: Simple Features for R: Standardized Sup-
Quality assessment of the contributed land use information port for Spatial Vector Data, The R Journal, 10, 439–446,
from OpenStreetMap versus authoritative datasets, in: Open- https://doi.org/10.32614/RJ-2018-009, 2018.
StreetMap in GIScience, pp. 37–58, Springer, 2015.
R Core Team: R: A Language and Environment for Statistical
Ballatore, A. and Zipf, A.: A conceptual quality frame- Computing, R Foundation for Statistical Computing, Vienna,
work for Volunteered Geographic Information, in: Interna- Austria, https://www.R-project.org/, 2021.
tional Conference on Spatial Information Theory, pp. 89–
107, Springer, 2015. Raifer, M., Troilo, R., Kowatsch, F., Auer, M., Loos, L.,
Marx, S., Przybill, K., Fendrich, S., Mocnik, F.-B., and
Bankim and Vaja, R.: Retail Management, IJRAR- Interna- Zipf, A.: OSHDB: a framework for OSHDB: a framework
tional Journal of Research and Analytical Reviews, 2, 22–28, for spatio-temporal analysis of OpenStreetMap history data,
2015. Open Geospatial Data, Software and Standards, 4, 1–12,
Barrington-Leigh, C. and Millard-Ball, A.: The world’s user- https://doi.org/10.1186/s40965-019-0061-3, 2019.
generated road map is more than 80% complete, PLOS ONE, Temple Lang, D.: RCurl: General Network (HTTP/FTP/...)
12, e0180 698, 2017. Client Interface for R, https://CRAN.R-project.org/package=
Barron, C., Neis, P., and Zipf, A.: A Comprehen- RCurl, r package version 1.98-1.3, 2021.
sive Framework for Intrinsic OpenStreetMap Qual- Törnros, T., Dorn, H., Hahmann, S., and Zipf, A.: Un-
ity Analysis, Transactions in GIS, 18, 877–895, certainties of Completeness Measures in Openstreetmap
https://doi.org/10.1111/tgis.12073, 2014. - a Case Study for Buildings in a Medium-Sized Ger-
Bundesinstitut für Bau-, Stadt- und Raumforschung: INKAR man City, ISPRS Annals of Photogrammetry, Remote
- Indikatoren und Karten zur Raum- und Stadtentwicklung. Sensing and Spatial Information Sciences, II-3/W5, 353–
Erläuterungen zu den Raumbezügen., https://www.inkar.de/ 357, https://doi.org/10.5194/isprsannals-II-3-W5-353-2015,
documents/Erlaeuterungen%20Raumbezuege19.pdf, 2019. 2015.
Chamberlain, S. and Teucher, A.: geojsonio: Convert Data Wang, S., Zhou, Q., and Tian, Y.: Understanding
from and to ’GeoJSON’ or ’TopoJSON’, https://CRAN. Completeness and Diversity Patterns of OSM-Based
R-project.org/package=geojsonio, r package version 0.9.4, Land-Use and Land-Cover Dataset in China, IS-
2021. PRS International Journal of Geo-Information, 9, 531,
https://doi.org/10.3390/ijgi9090531, 2020.
Degrossi, L. C., Albuquerque, J. P. d., Rocha, R. d. S., and
Zipf, A.: A Framework of Quality Assessment Methods for Wickham, H.: ggplot2: Elegant Graphics for Data Analy-
Crowdsourced Geographic Information : a Systematic Liter- sis, Springer-Verlag New York, https://ggplot2.tidyverse.org,
ature Review, in: Proceedings of the 14th ISCRAM Confer- 2016.
ence, pp. 21–24, issue: May, 2017. Wickham, H., Averick, M., Bryan, J., Chang, W., McGowan,
Fan, H., Zipf, A., Fu, Q., and Neis, P.: Quality assessment L. D., François, R., Grolemund, G., Hayes, A., Henry, L.,
for building footprints data on OpenStreetMap, International Hester, J., Kuhn, M., Pedersen, T. L., Miller, E., Bache, S. M.,
Journal of Geographical Information Science, 28, 700–719, Müller, K., Ooms, J., Robinson, D., Seidel, D. P., Spinu, V.,
2014. Takahashi, K., Vaughan, D., Wilke, C., Woo, K., and Yutani,
AGILE: GIScience Series, 2, 20, 2021 | https://doi.org/10.5194/agile-giss-2-20-2021 6 of 7H.: Welcome to the tidyverse, Journal of Open Source Soft- ware, 4, 1686, https://doi.org/10.21105/joss.01686, 2019. Zielstra, D. and Zipf, A.: Quantitative studies on the data quality of OpenStreetMap in Germany, in: Proceedings of GIScience, vol. 2010, 2010. AGILE: GIScience Series, 2, 20, 2021 | https://doi.org/10.5194/agile-giss-2-20-2021 7 of 7
You can also read