Assessing Nitrogen Availability in Biobased Fertilizers: Effect of Vegetation on Mineralization Patterns

Page created by Ethel May
 
CONTINUE READING
Assessing Nitrogen Availability in Biobased Fertilizers: Effect of Vegetation on Mineralization Patterns
agriculture

Article
Assessing Nitrogen Availability in Biobased Fertilizers: Effect
of Vegetation on Mineralization Patterns
Hongzhen Luo *, Ana A. Robles-Aguilar                       , Ivona Sigurnjak, Evi Michels and Erik Meers

                                           Department of Green Chemistry & Technology, Faculty of Bioscience Engineering, Ghent University,
                                           9000 Ghent, Belgium; Ana.RoblesAguilar@UGent.be (A.A.R.-A.); ivona.sigurnjak@ugent.be (I.S.);
                                           evi.michels@ugent.be (E.M.); erik.meers@ugent.be (E.M.)
                                           * Correspondence: hongzhen.luo@ugent.be; Tel.: +32-9-264-60-39

                                           Abstract: Biobased nitrogen (N) fertilizers derived from animal manure can substitute synthetic
                                           mineral N fertilizer and contribute to more sustainable agriculture. Practitioners need to obtain
                                           a reliable estimation of the biobased fertilizers’ N value. This study compared the estimates for pig
                                           slurry (PS) and liquid fraction of digestate (LFD) using laboratory incubation and plant-growing
                                           experiments. A no-N treatment was used as control and calcium ammonium nitrate (CAN) as
                                           synthetic mineral fertilizer. After 100 days of incubation, the addition of PS and LFD resulted in a net
                                           N mineralization rate of 10.6 ± 0.3% and 20.6 ± 0.4% of the total applied N, respectively. The addition
                                           of CAN showed no significant net mineralization or immobilization (net N release 96 ± 6%). In the
                                           pot experiment under vegetation, all fertilized treatments caused N immobilization with a negative
                                           net N mineralization rate of −51 ± 11%, −9 ± 4%, and −27 ± 10% of the total applied N in CAN,
                                 PS, and LFD treatments, respectively. Compared to the pot experiment, the laboratory incubation
         
                                           without vegetation may have overestimated the N value of biobased fertilizers. Vegetation resulted
Citation: Luo, H.; Robles-Aguilar,         in a lower estimation of available N from fertilizers, probably due to intensified competition with
A.A.; Sigurnjak, I.; Michels, E.; Meers,   soil microbes or increased N loss via denitrification.
E. Assessing Nitrogen Availability in
Biobased Fertilizers: Effect of            Keywords: N dynamics; immobilization; maize; incubation; digestate
Vegetation on Mineralization Patterns.
Agriculture 2021, 11, 870. https://
doi.org/10.3390/agriculture11090870

                                           1. Introduction
Academic Editors: Pavel Krasilnikov,
Miguel A. Taboada and Amanullah                 Synthetic mineral nitrogen (N) fertilizers have made an essential contribution in
                                           maintaining an adequate food supply for the growing world population. However, the
Received: 10 August 2021                   production of synthetic mineral N fertilizers via the Haber–Bosch process is high energy
Accepted: 6 September 2021                 and fossil-fuel dependent [1]. The N applied to crop is only partly used due to N losses
Published: 10 September 2021               through leaching, emission, and non-harvested crop residues left in the field [2]. Moreover,
                                           the N cycles in agro-systems are no longer closed because of the growing independence
Publisher’s Note: MDPI stays neutral       between crop production and animal husbandry, resulting in unbalanced N flows, which
with regard to jurisdictional claims in    threaten the sustainability of agriculture both environmentally and economically. To help
published maps and institutional affil-    close the N loop, biobased N fertilizers derived from animal manure could substitute
iations.                                   synthetic mineral N fertilizer [3–6] and contribute to more sustainable agriculture in line
                                           with a circular economy.
                                                While N supplied by synthetic mineral N fertilizers is 100% in mineral form, most
                                           biobased N fertilizers also partly provide organic N, which can be directly taken up by
Copyright: © 2021 by the authors.          plants [7] or become available for plants via microbial N mineralization and immobilization
Licensee MDPI, Basel, Switzerland.         turnover (NMIT) [8]. Furthermore, biobased fertilizers usually provide additional organic
This article is an open access article     carbon (C) to the soil, accelerating the NMIT process [9]. Therefore, the actual value
distributed under the terms and            of biobased N fertilizers depends on the content of mineral N, which is directly plant-
conditions of the Creative Commons         available, and the mineralizable organic N whose availability can be affected by the product
Attribution (CC BY) license (https://      characteristics (C/N ratio, organic C and N quality, etc.) [10,11], the target plants [12,13],
creativecommons.org/licenses/by/           and the soil microbial communities [14,15].
4.0/).

Agriculture 2021, 11, 870. https://doi.org/10.3390/agriculture11090870                                   https://www.mdpi.com/journal/agriculture
Assessing Nitrogen Availability in Biobased Fertilizers: Effect of Vegetation on Mineralization Patterns
Agriculture 2021, 11, 870                                                                                              2 of 18

                                  The nitrogen use efficiency of fertilizers is most accurately assessed by tracing the trans-
                            formation, absorption, transfer, and transport of nitrogen fertilizer in the soil–crop system
                            using 15 N isotope labeling technology. However, this technology is not usually applicable
                            due to the high cost of 15 N materials and 15 N measurements. Therefore, a straightforward
                            and cost-effective approach was used by calculating the difference between N uptake by
                            crop in fertilized and unfertilized treatment divided by the total applied N in a single
                            season, defined as apparent N recovery (ANR) [16]. The potential value of biobased N
                            fertilizers in substituting synthetic mineral N fertilizers is evaluated by N fertilizer replace-
                            ment value (NFRV), which is calculated as the ratio between the ANRs of the biobased
                            fertilizers and those of the reference synthetic mineral N fertilizer. Fields represent the
                            ideal scale for NFRV estimation. However, conducting a field trial is expensive and la-
                            borious, which makes it not always practical. As an alternative, laboratory incubation at
                            controlled conditions can monitor the N release from organic fertilizers in the absence of
                            plants. It is considered an effective and reliable tool for the initial estimation of N release
                            in a relatively short term (varying from a few days to a few months) [17,18]. However,
                            this method does not take into consideration the effect of vegetation on the N dynamics
                            in the soil through biological activities like plant N uptake [8], rhizodeposits [19], rhizo-
                            sphere microbial turnover [20], and their interactions [21,22], or physical amendments
                            by roots development on soil which affects the water holding capacity (WHC) and the
                            N diffusion in soil [23]. To date, very few studies provided a direct comparison between
                            planted and unplanted experiments to show the effect of vegetation on N dynamics, still
                            less under biobased fertilization. Cheng [12] observed that the presence of soybean (exclud-
                            ing N2 -fixation) and wheat resulted in higher soil net N mineralization (balance between
                            immobilization and mineralization as measured with 15 N isotopic labelling technology) by
                            21% and 9%, respectively, than that in unplanted soil. Canarini and Dijkstra [24] also found
                            more significant N mineralization rates and higher N loss in planted soil under constant
                            moisture (60% WHC) but not under drying-rewetting condition.
                                  In contrast, Qian et al. [25] concluded in a maize-growing experiment that the presence
                            of plants resulted in increased microbial N immobilization (+67%) and accumulated deni-
                            trification (+77%) in planted soil compared with unplanted soil, whereas Grunert et al. [13]
                            found vegetation with tomato plants enhanced the N release from recovered struvite but
                            no significant effect on N mineralization of the tested commercial organic fertilizer. Further
                            investigation is needed to assess the effect of vegetation on the N mineralization pattern of
                            biobased fertilizers as substitutions for synthetic mineral N fertilizers.
                                  In this study, parallel observations were conducted in a laboratory incubation exper-
                            iment (without vegetation) and in a pot experiment (with plant growing) to assess the
                            potential N value of two biobased fertilizers: pig slurry (PS) and liquid fraction of digestate
                            (LFD). PS was selected as a raw biobased N fertilizer that usually requires processing due to
                            high water content and limited land disposal surrounding pig farms [26]. Correspondingly,
                            the anaerobic digestion process was reported to reduce the soil C supply unilaterally and
                            increase the amounts of readily available N, leading to a more balanced soil C and N
                            supply [27]. Therefore, the LFD, produced from PS-based biowaste through anaerobic
                            digestion and subsequent physical separation, was selected as a merging biobased N fertil-
                            izer. It was hypothesized that (i) vegetation with maize plant can result in an increased net
                            N release compared to unplanted incubation; and (ii) the addition of LFD with a reduced
                            C/N ratio can lead to higher N mineralization and thus show higher potential N value
                            than unprocessed PS.

                            2. Materials and Methods
                            2.1. Experiment Setup
                                 An incubation experiment was conducted in 10-cm-deep poly vinyl chloride (PVC)
                            tubes in parallel with a plant-growing experiment using maize (Zea mays LG31220, France)
                            in 45-cm-deep tubes for 100 days. Maize was used because it is widely grown throughout
                            the world and it serves as one of the most important sources for food, fuel, and animal
Assessing Nitrogen Availability in Biobased Fertilizers: Effect of Vegetation on Mineralization Patterns
Agriculture 2021, 11, 870                                                                                                   3 of 18

                            feed [28]. The tested fertilizers, i.e., calcium ammonium nitrate (CAN, 30% N, as syn-
                            thetic N fertilizer), pig slurry (PS), and liquid fraction of digestate (LFD), were applied at
                            a rate of 150 kg total N ha−1 in the two experimental setups, by manually mixing them
                            with soil before incubation or planting. For the control, no N fertilizer was applied. The
                            moisture content of the soil was adjusted to 70% of WHC by adding deionized water.
                            The P and K fertilizers were applied in all treatments at the same dosages, compensat-
                            ing with triple superphosphate (TSP, 40% P2 O5 ) and patentkali (PAT, consisting of 30%
                            K2 O, 10% MgO, and 42% SO3 ) to the highest supplies of 77 kg P2 O5 ha−1 by PS and
                            148 kg K2 O ha−1 by LFD. All fertilizers were applied on a surface basis. Considering a soil
                            density of 1400 kg m−3 and a soil depth of 0–30 cm, the applied dosages corresponded to
                            35 mg N kg−1 , 18 mg P2 O5 kg−1 , and 34 mg K2 O kg−1 soil dry weight (DW).

                            2.2. Soil Collection and Analyses
                                  The soil was collected from the surface layer (0–30 cm) of an arable field at Bottelare,
                            Belgium (50◦ 580 0” N, 3◦ 450 0” E). It contained 40% sand, 7% clay, and 53% silt, and the
                            texture was classified as silty-loam (USDA texture triangle). The collected soil was air-
                            dried and sieved through a 2-mm mesh. To reduce the potential interference in the net N
                            mineralization from the soil mineral N supply, which was relatively high (22 mg N kg−1
                            DW) compared to the fertilizer N supply (150 kg N ha−1 , equal to 35 mg N kg−1 DW), the
                            air-dried soil was mixed with oven-dried river sand at a ratio of 1:1 w/w. A subsample
                            of the mixture (from now on stated as ‘soil’) was taken for determination of the moisture
                            content, organic matter (OM), pH-H2 O, and mineral N (NO3 − -N and NH4 + -N). The WHC
                            of the soil was determined by the addition of demineralized water to oven-dried soil until it
                            became saturated and excess water was draining freely [29]. The mass of added water was
                            recorded. The DW was determined by weight loss after drying the soil sample to constant
                            weight at 105 ◦ C for at least 24 h. The OM was measured using a muffle furnace for four
                            hours at 550 ◦ C. Soil actual acidity (pH-H2 O) was measured using a pH electrode (Orion-
                            520A USA) and the electrical conductivity (EC) was measured using a WTW-LF537 (GE)
                            conductivity electrode after 10 g of soil was allowed to equilibrate in 50 mL demineralized
                            water for 16 h [30]. Total N and C content in soil was determined using a CN analyzer
                            (Skalar Analytical BV, Breda, The Netherlands). Nitrate N (NO3 − -N) (ISO 13395:1996) and
                            ammonium N (NH4 + -N) (ISO 11732:1997) in soil were analyzed from 1 M KCl extract using
                            a continuous flow auto-analyzer (Chemlab System 4, Skalar, Breda, The Netherlands).
                                  The characteristics of the tested soil were sandy loam texture (70% sand, 4% clay, and 26% silt);
                            DW = 98.8%; WHC = 305 g water per kg dried soil; pH-H2O = 7.1; EC = 68 µS cm−1; OM = 3%;
                            total C = 0.4%; total N = 0.36 g kg−1; NH4+-N = 4.9 mg kg−1; and NO3−-N = 6.6 mg kg−1.
                            The N and C contents were within the recommended criteria (NO3−-N < 20 mg kg−1 soil and
                            organic C < 1.5%) for mineralization experiments according to the Flemish Institute for
                            Technological Research [31].

                            2.3. Biobased Fertilizer Collection and Analyses
                                  The tested biobased fertilizers were collected from a biogas plant in Gistel, Belgium
                            (51◦ 100 0” N, 2◦ 570 0” E). The biogas plant runs at 37–40 ◦ C with a hydraulic retention time
                            (HRT) of 30 days and a total volume of 1000 m3 . Pig slurry is the primary input material
                            for the biogas plant, accounting for 71%, supplemented with 8% raw cow manure, 12%
                            solid pig manure, and 9% fried potato waste. After anaerobic digestion, the digestate is
                            separated into liquid and solid fractions by centrifugation. Two liters of PS and LFD were
                            collected in plastic bottles and stored at 4 ◦ C before analysis and application.
                                  The two biobased fertilizers were characterized in triplicate (Table 1). The values
                            of DW, OM, total N, total C, NH4 + -N, and NO3 − -N were determined as described in
                            Section 2.2. The EC and pH values were determined on the fresh sample, using a WTW-
                            LF537 (GE) conductivity electrode and an Orion-520A pH-meter (USA). The concentration
                            of total phosphorus (P) and total potassium (K) were analyzed by inductively coupled
Agriculture 2021, 11, 870                                                                                              4 of 18

                            plasma optical emission spectrometry (ICP-OES) (Varian Vista MPX, Varian Palo Alto, CA,
                            USA) after microwave digestion using 13% HNO3 .

                            Table 1. Characterization of biobased fertilizers in fresh weight (FW) basis (mean ± standard
                            deviation; n = 3).

                                       Parameters                            Pig Slurry        Liquid Fraction of Digestate
                                      DW (g    kg−1 )                        94.0 ± 0.4                 43.0 ± 0.4
                                      OM (g kg−1 )                           63.3 ± 0.6                 25.9 ± 0.1
                                    Total C (g kg−1 )                        23.6 ± 0.5                 11.6 ± 0.2
                                           pH                                    7.0                        7.4
                                     EC (mS cm−1 )                           38.9 ± 0.3                 30.4 ± 0.5
                                    Total N (g kg−1 )                        7.80 ± 0.07               4.77 ± 0.02
                                   NH4 + -N (g kg−1 )                        4.51 ± 0.07               2.77 ± 0.02
                                   NO3 − -N (g kg−1 )
Agriculture 2021, 11, 870                                                                                                  5 of 18

                                2.6. Calculation on N Release and Mineralization
                                       In this experiment, the “two-pool” model [32] was used: one of the pools contained
                                the plant-available N (i.e., NO3 − -N, NH4 + -N) and the other one had the non-available N
                                (i.e., organic-N, fixed NH4 + ). For laboratory incubation, the potential N value of tested
                                fertilizers was evaluated by net N release (Nrel , net ), which is the difference between the
                                mineral N measured in the fertilized soil minus the mineral N measured in the control (i.e.,
                                unfertilized soil), calculated as Equation (1) [33]:

 Nrel, net (%) = [(NH4 + -N)treatment + (NO3 − -N)treatment − (NH4 + -N)control − (NO3 − -N)control ]/total applied N × 100 (1)

                                     At t = 0, the Nrel, net (%) equals the product mineral N to total N ratio × 100.
                                     In the maize-growing experiment, the plant N uptake was included and Nrel, net was
                                calculated as Equation (2) adapted from Equation (1):

        Nrel, net (%) = [ShootNtreatment + RootNtreatment + (NH4 + -N)treatment + (NO3 − -N)treatment − (shootNcontrol −
                                                                                                                              (2)
                          RootNcontrol − (NH4 + -N)control − (NO3 − -N)control ]/total applied N × 100

                                     Net N mineralization (Nmin, net (%)) is the N mineralized from the organic fraction of
                                the biobased fertilizers and is calculated by subtracting the amount of mineral N already
                                present in the biobased fertilizers at t = 0, as Equation (3) according to [33]:

                                                      Nmin, net (t, %) = Nrel, net (t, %) − Nrel, net (t = 0, %)              (3)

                                    A positive Nmin, net value indicates net N mineralization, whereas a negative Nmin, net
                                value indicates net N immobilization.

                                2.7. Mass Balance Calculation
                                      Based on the mean N concentration in soil and plant samples on day 0 and day 100,
                                a mass balance for N flows under the different fertilizer treatments was established re-
                                spectively for the incubation and the pot experiment. In incubation, the plant-available
                                N pool referred to the mineral N pool (hypothetically plant-available), while in the pot, it
                                referred to the plant N uptake plus the mineral N residue in the soil. The plant-available N
                                in both setups can come from soil mineral N, fertilizer mineral N, as well as mineralized N
                                from soil organic matter (SOM) and fertilizer organic N. The soil mineral N supply was
                                calculated as the mineral N in the soil before fertilization, while the mineralized N from the
                                SOM was calculated as the difference of mineral N contents in control treatment between
                                day 100 and day 0. Here, the possibility of additional SOM decomposition (priming effect)
                                that might be brought by fertilization was not considered. Thus, the mineralized N from
                                the SOM was assumed to be the same in all treatments. In fertilizer treatments, the extra
                                mineralized N was attributed to the mineralization of fertilizer organic N. The remaining
                                fertilizer-derived N that cannot be included in the above-mentioned N flows was counted
                                as unmeasured.

                                2.8. Statistical Analyses
                                      Statistical analyses were performed using SPSS statistical software (version 26.0; SPSS
                                Inc., Chicago, IL, USA). The data from the incubation and field measurements were first
                                subjected to one-way ANOVA for each sampling moment to evaluate the effect of vegeta-
                                tion and fertilization separately. To analyze the trends in time, a three-way ANOVA was
                                conducted to compare the main effect of vegetation, fertilization, and sampling moment, as
                                well as their interactions, on the plant-available N concentration and the calculated Nrel, net .
                                When significant differences between means were observed, additional post hoc assessment
                                was performed using Tukey’s test (p < 0.05, n = 4). These differences are indicated by the
                                different lower-case letters. Normality was checked using the Shapiro–Wilk test, whereas
                                homogeneity was tested with the Levene test.
Agriculture 2021, 11, 870                                                                                                                            6 of 18

                                          Linear regressions were calculated to (i) predict the N availability in the maize-growing
                                      pot based on that in incubation experiment and (ii) predict the Nrel, net in incubation
                                      or ANR in pot and field trials based on the mineral N to total N ratio of the applied
                                      biobased fertilizers.

                                      3. Results
                                      3.1. Root and Shoot Development of Plants
                                           At the early stage (0–20 days), the FW and DW biomass yields of CAN and LFD
                                      treated maize plants were on average lower than those of control and PS treatment. From
                                      day 20 to day 80, the fresh biomass yield of maize plant shoots under control, CAN,
                                      PS, and LFD treatment increased by 21, 77, 47, and 80 times, respectively. After that,
                                      some leaves turned yellow and started to dry out, resulting in a slight increase (−10%
                                      to 5.5%) of shoots FW on day 100 compared to day 80 (Table 2). As indicated in Fig-
                                      ure 1, since day 70, the maize plant showed symptoms as the old leaves turned pale
                                      or yellowish-green and developed an inverted “V” or spear-shaped discoloration start-
                                      ing at the tip of the leaf and extending toward the leaf base. Nevertheless, the DW of
                                      the shoot in all treatments kept increasing until the end of the experiment, with rapid
                                      growth rates (0.21–0.78 g day−1 ) in fertilized treatments and a relatively constant increase
                                      (0.12–0.18 g day−1 ) in control treatment from day 60 (Table 2). By the end of the experi-
                                      ment, fertilizer treatments showed a significant (p < 0.05) increase on both FW and DW
                                      biomass yield of maize shoot compared to control. Addition of CAN and PS resulted in the
                                      highest biomass yields, being FW 148 ± 7 g pot−1 , DW 32 ± 1 g pot−1 in CAN treatment,
                                      and FW 141 ± 8 g pot−1 , DW 32 ± 2 g pot−1 in PS treatment, while the addition of LFD
                                      (FW 109 ± 15 g pot−1 , DW 24 ± 3 g pot−1 ) led to around two times higher biomass yield
                                      than control (FW 52 ± 4 g pot−1 , DW 11 ± 1 g pot−1 ).
                                           The root biomass showed a similar trend as that of the shoot (Table 2). From day 20 to
                                      day 60, the FW of roots in all treatments continuously increased to 14–16 g per pot, while
                                      the DW of roots increased by 4, 9, 9, and 10 times in control, CAN, PS, and LFD treatment,
                                      respectively. From day 60, the root FW in control treatment suffered a decrease (Table 2). There
                                      was no significant increase in FW or DW from day 80 to the end in fertilized treatments.

      Table 2. Fresh weight (FW), dry weight (DW), and the C assimilation and N uptake of the maize shoots and roots on
      DW basis (mean ± standard deviation; n = 4). The small letters refer to statistical analyses for each sampling date using
      one-way ANOVA and post-hoc pair-wise comparisons with a significant difference at the 5% level. Parameters without
      letter assigned showed no significant difference between treatments. Control = no N fertilizer; CAN = calcium ammonium
      nitrate, PS = pig slurry, LFD = liquid fraction of digestate.

   Growing Days                                                    Shoot                                                    Root
   (Approximate
    Phenological                         FW           DW                                            FW            DW              N
                       Treatment      (g pot−1 )   (g pot−1 )    N (mg   g−1 )   C (mg   g−1 )   (g pot−1 )    (g pot−1 )      (mg g−1 )       C (mg g−1 )
      Stages)
                            Control   2.3 ± 0.8    0.18 ± 0.06     46 ± 2 b        384 ± 2       2.1 ± 0.7    0.30 ± 0.06       19 ± 3 b       276 ± 24 ab
          20                 CAN      1.9 ± 0.6    0.15 ± 0.04   50 ± 11 ab       396 ± 26       1.6 ± 0.3    0.22 ± 0.01      22 ± 3 ab       287 ± 16 ab
         (V2)                 PS      3.0 ± 0.7    0.23 ± 0.05     56 ± 4 a       381 ± 8        1.8 ± 0.3    0.25 ± 0.04       25 ± 3 a        266 ± 18 b
                             LFD      1.5 ± 0.6    0.12 ± 0.04    47 ± 12 b       396 ± 16       1.1 ± 0.5    0.17 ± 0.03       23 ± 6 a         300 ± 7 a
                            Control    18 ± 6 b     1.5 ± 0.6     16 ± 1 b         409 ± 4       8.1 ± 2.1    0.90 ± 0.27          11 ± 1 b     327 ± 21
         40                  CAN      26 ± 9 ab     1.9 ± 0.8     36 ± 6 a        405 ± 10       7.5 ± 1.9    0.83 ± 0.19          19 ± 3 a     316 ± 17
       (V3–V4)                PS       38 ± 7 a     2.9 ± 0.5     30 ± 5 a        415 ± 5        9.5 ± 1.6    1.15 ± 0.22          17 ± 3 a     317 ± 20
                             LFD      29 ± 7 ab     1.7 ± 0.3     33 ± 4 a         409 ± 5       6.8 ± 1.0    0.75 ± 0.09          19 ± 2 a     329 ± 14
                            Control     43 ± 6 c     5±1c        8.1 ± 0.4        415 ± 2         15 ± 1      1.4 ± 0.2 b          7.6 ± 0.6    381 ± 8 a
         60                  CAN      85 ± 20 ab   10 ± 2 ab     11.4 ± 0.1       426 ± 3         14 ± 2      2.2 ± 0.5 ab         9.4 ± 0.6   335 ± 17 b
       (V5–V6)                PS       100 ± 7 a    13 ± 1 a     8.4 ± 0.7        422 ± 5         15 ± 1       2.5 ± 0.3 a         8.0 ± 0.2   348 ± 12 b
                             LFD       79 ± 10 b    9±2b          9.9 ± 1.3       420 ± 3         16 ± 2       1.9 ± 0.3 b         8.8 ± 0.9   356 ± 7 ab
                            Control     49 ± 4 c     8±1c         4.9 ± 0.1       420 ± 3         9±1c         1.3 ± 0.3 c         6.9 ± 0.6     395 ± 8
         80                  CAN      147 ± 18 a    26 ± 4 a      4.6 ± 0.5       429 ± 1        20 ± 2 a     3.1 ± 0.3 ab         6.3 ± 0.3    372 ± 21
        (VT)                  PS       146 ± 4 a    26 ± 1 a      4.5 ± 0.4       430 ± 1        22 ± 3 a      3.5 ± 0.7 a         6.5 ± 0.3    374 ± 18
                             LFD      122 ± 15 b    19 ± 2 b      5.1 ± 0.2       430 ± 1        16 ± 3 b     2.5 ± 0.5 b          6.4 ± 0.1    371 ± 21
                            Control     52 ± 4 c    11 ± 1 c      4.2 ± 0.1      403 ± 10 b      10 ± 1 c     1.6 ± 0.1 c          8.6 ± 0.2    377 ± 11
         100                 CAN       148 ± 7 a    32 ± 1 a      4.0 ± 0.7       423 ± 3 a      20 ± 3 a     3.3 ± 0.3 a          7.4 ± 0.7    365 ± 18
       (R1–R3)                PS       141 ± 8 a    32 ± 2 a      4.0 ± 0.3       424 ± 1 a      21 ± 1 a     3.4 ± 0.5 a          7.6 ± 0.2    382 ± 18
                             LFD      109 ± 15 b    24 ± 3 b      4.2 ± 0.1       418 ± 4 a      14 ± 4 b     2.2 ± 0.5 b          8.1 ± 0.3    389 ± 16
(VT)     PS                     146 ± 4a      26 ± 1a    4.5 ± 0.4  430 ± 1                      22 ± 3a     3.5 ± 0.7a         6.5 ± 0.3   374 ± 18
                   LFD                    122 ± 15b      19 ± 2b    5.1 ± 0.2  430 ± 1                      16 ± 3b     2.5 ± 0.5b         6.4 ± 0.1   371 ± 21
                 Control                    52 ± 4c      11 ± 1c    4.2 ± 0.1 403 ± 10b                     10 ± 1c     1.6 ± 0.1c         8.6 ± 0.2   377 ± 11
      100          CAN                     148 ± 7a      32 ± 1a    4.0 ± 0.7 423 ± 3a                      20 ± 3a     3.3 ± 0.3a         7.4 ± 0.7   365 ± 18
 Agriculture 2021, 11, 870                                                                                                                                    7 of 18
  (R1–R3)           PS                     141 ± 8a      32 ± 2a    4.0 ± 0.3 424 ± 1a                      21 ± 1a     3.4 ± 0.5a         7.6 ± 0.2   382 ± 18
                   LFD                    109 ± 15b      24 ± 3b    4.2 ± 0.1 418 ± 4a                      14 ± 4b     2.2 ± 0.5b         8.1 ± 0.3   389 ± 16

                                                                   (a)                                          (b)
                                                 Figure
                                                  Figure1.1. Images
                                                              Imagesof
                                                                     ofmaize
                                                                        maizeleaves
                                                                                leavesphotographed
                                                                                        photographedon onday
                                                                                                          day70.
                                                                                                               70. The
                                                                                                                   Theblue
                                                                                                                        bluearrows
                                                                                                                             arrowsshow
                                                                                                                                    showthe
                                                                                                                                          the yellow
                                                                                                                                              yellow and
                                                                                                                                                     and
                                                 dried leaves.  (a) old leaves   turned   pale or yellowish-green;  (b) an inverted “V” or spear-shaped
                                                  dried leaves. (a) old leaves turned pale or yellowish-green; (b) an inverted “V” or spear-shaped
                                                 discoloration
                                                  discolorationstarting
                                                                 startingat
                                                                          atthe
                                                                             thetip
                                                                                 tipof
                                                                                     ofthe
                                                                                        theleaf.
                                                                                            leaf.

                                                       The   root biomass
                                                        Consistent   with theshowed
                                                                                DW, N a similar    trend as
                                                                                          continuously        that of the shoot
                                                                                                           accumulated            (Table
                                                                                                                           in shoots   and2).roots
                                                                                                                                               From   day 20
                                                                                                                                                    under   all
                                                 to  day  60,  the FW   of  roots in  all  treatments    continuously     increased   to  14–16
                                                  treatments, with significantly (p < 0.05) higher N uptake (calculated from Table 2) in fertil-  g per   pot,
                                                 while   the DW ofthan
                                                  ized treatments     roots   increased
                                                                           control by day  by100.
                                                                                               4, 9,However,
                                                                                                     9, and 10together
                                                                                                                 times inwith
                                                                                                                            control,  CAN,
                                                                                                                                the rapid     PS, and
                                                                                                                                            growth       LFD
                                                                                                                                                      of plant
                                                 treatment,
                                                  biomass from respectively.  From
                                                                   day 40 to day  80,day
                                                                                      the60,   the root FW in in
                                                                                            N concentrations     control
                                                                                                                    shootstreatment
                                                                                                                            decreasedsuffered    a decrease
                                                                                                                                         dramatically.   In all
Agriculture 2021, 11, 870                        (Table   2). There
                                                  treatments,   the Nwas  no significant
                                                                       accumulation          increase
                                                                                       in shoots       in FWaor
                                                                                                    showed         DW lower
                                                                                                                much    from day
                                                                                                                               rate 80
                                                                                                                                    (0–3tomg    end−1in
                                                                                                                                           thepot        of −
                                                                                                                                                            191 )
                                                                                                                                                        ferti-
                                                                                                                                                      8day
                                                 lized  that of C (2–338 mg pot−1 day−1 ) as indicated by the increased C/N ratio (Figure 2a).
                                                  than treatments.
                                                  The decrease in with
                                                       Consistent          the DW, N continuously
                                                                     N concentration     also occurred accumulated
                                                                                                           in roots from in  shoots
                                                                                                                           day  20 to and
                                                                                                                                       day roots   under
                                                                                                                                            80 (Table       all
                                                                                                                                                        2) but
                                                 treatments,
                                                  was followed  with
                                                                   bysignificantly
                                                                      a significant (p
                                                                                     (p
Agriculture 2021, 11, 870                                                                                                                                                                                                                                                                                              8 of 18

                                                                                                                 in the control treatment increased by 51% and consequently decreased net N release in
         Agriculture 2021, 11, 870                                                                                                                                                         9 of 19
                                                                                                                 all fertilized treatments. The net N release on day 100 was 96.9 ± 5.8%, 68.5  ± 0.3%, and
                                                                                                                 78.8 ± 0.4% in CAN, PS, and LFD treatment.

                                                            70                                                                                                                                                  70
                                                                                (a) Control-incubation                                                                                                                                           (b) Control-pot
             Plant-available N (mg kg-1 DW)

                                                                                                                                                                      Plant-available N (mg kg-1 DW)
                                                            60                                                                                                                                                  60

                                                            50                                                                                                                                                  50

                                                            40                                        NH4+-N
                                                                                                                           NO3  – -N         Total                                                              40                                            Soil                Uptake              Total

                                                            30                                                                                                                                                  30

                                                            20                                                                                                                                                  20

                                                            10                                                                                                                                                  10

                                                                       0                                                                                                                                                         0
                                                                            0               20          40                60           80     100             120                                                                        0             20            40           60             80     100      120
                                                                                                                 Incubation days                                                                                                                                             Growing days

                                                                                                                                                                                                               70
                                                                70
                                                                                (c) CAN-incubation                                                                                                                                           (d) CAN-pot
                                                                                                                                                                     Plant-available N (mg kg-1 DW)
                                                                60                                                                                                                                             60
                  Plant-available N (mg kg-1 DW)

                                                                50                                                                                                                                             50

                                                                40                                                                                                                                             40                                                Soil                  Uptake         Total

                                                                30                                                                                                                                             30

                                                                20                                          NH4+-N               NO3– -N             Total
                                                                                                                                                                                                               20
                                                                10
                                                                                                                                                                                                               10
                                                                       0
                                                                                                                                                                                                                            0
                                                                            0               20              40            60           80      100            120
                                                                                                                                                                                                                                         0            20             40           60            80     100      120
                                                                                                                  Incubation days
                                                                                                                                                                                                                                                                             Growing days

                                                                       70                                                                                                                                                        70
                                                                                    (e) PS-incubation                                                                                                                                            (f) PS-pot
                                                                                                                                                                                     Plant-available N (mg kg-1 DW)

                                                                       60                                                                                                                                                        60
                                      Plant-available N (mg kg-1 DW)

                                                                       50                                                                                                                                                        50
                                                                                                                                                                                                                                                                      Soil              Uptake          Total
                                                                       40                                                                                                                                                        40

                                                                       30                                                                                                                                                        30

                                                                       20                                    NH4    +-N                              Total                                                                       20
                                                                                                                                  NO3– -N

                                                                       10                                                                                                                                                        10

                                                                        0                                                                                                                                                            0
                                                                                0            20             40            60           80      100            120                                                                            0         20            40           60            80     100      120
                                                                                                                 Incubation days                                                                                                                                             Growing days

                                                                           70                                                                                                                                                    70
                                                                                        (g) LFD-incubation                                                                                                                                       (h) LFD-pot
                                                                                                                                                                                                Plant-available N (mg kg-1 DW)

                                                                           60                                                                                                                                                    60
                                    Plant-available N (mg kg-1 DW)

                                                                           50                                                                                                                                                    50                             Soil               Uptake             Total

                                                                           40                                                                                                                                                    40

                                                                           30                                                                                                                                                    30

                                                                           20                                                                                                                                                    20
                                                                                                        NH4+-N                   NO3– -N              Total
                                                                           10                                                                                                                                                    10

                                                                            0                                                                                                                                                        0
                                                                                    0            20          40            60           80      100            120                                                                           0          20            40         60             80     100      120
                                                                                                                 Incubation days                                                                                                                                             Growing days

      Figure 3. Dynamics of plant-available N (mg kg−1 dry weight (DW), mean ± standard deviation; n = 4) in the soil of
      incubation (a,c,e,g) and maize-growing pot (b,d,f,h) in 100 days. No N fertilizer-control (a,b), calcium ammonium nitrate—
      CAN (c,d), pig slurry—PS (e,f), and liquid fraction of digestate—LFD (g,h). Data at t = 0 were estimations according to
      measurements in the control and the fertilizer application rate. In maize-growing pots, total plant-available N was calculated
      as the sum of mineral N in the soil and N uptake in the roots and shoots.
Agriculture 2021, 11, 870                                                                                                                                                         10 of 19

        Figure 3. Dynamics of plant-available N (mg kg−1 dry weight (DW), mean ± standard deviation; n = 4) in the soil of incu-
 Agriculture 2021, 11, 870                                                                                                         9 of 18
        bation (a,c,e,g) and maize-growing pot (b,d,f,h) in 100 days. No N fertilizer-control (a,b), calcium ammonium nitrate—
        CAN (c,d), pig slurry—PS (e,f), and liquid fraction of digestate—LFD (g,h). Data at t = 0 were estimations according to
        measurements in the control and the fertilizer application rate. In maize-growing pots, total plant-available N was calcu-
        lated as the sum of mineral N in the soil and N uptake in the roots and shoots.

                                                                  120
                                                                            (a) CAN
                                                                  100

                                                                  80
                                                  Nrel, net (%)
                                                                  60

                                                                  40

                                                                  20
                                                                                        Incubation                                     Pot

                                                                   0
                                                                        0        20     40           60                         80           100   120
                                                                                                 Days

                     120                                                                                                  120
                               (b) PS                                                                                                (c) LFD
                     100                                                                                                  100

                     80                                                                                                   80
     Nrel, net (%)

                                                                                                          Nrel, net (%)

                     60                                                                                                   60

                     40                                                                                                   40

                     20                                                                                                   20
                                          Incubation                             Pot
                                                                                                                                                   Incubation         Pot
                      0                                                                                                    0
                           0        20   40       60                        80    100     120                                   0            20    40       60   80         100    120
                                                Days                                                                                                      Days

        Figure
         Figure4.4.Net
                   NetNNrelease
                           release(%,
                                    (%,mean
                                         mean±±standard
                                                  standarddeviation;
                                                             deviation;nn==4)4)ininlaboratory
                                                                                    laboratoryincubation
                                                                                                 incubation(solid
                                                                                                                (solidline)
                                                                                                                         line)and
                                                                                                                               andininmaize-growing
                                                                                                                                      maize-growing
        pots
         pots (dotted line) under fertilization for 100 days. The red line indicated the values of the initial mineralNNtotototal
             (dotted line) under   fertilization for  100 days. The  red line indicated    the  values   of the  initial  mineral        totalNNratio.
                                                                                                                                                 ratio.
        Values  observed   above  the  line indicate  net N mineralization,    while    values  below   the  line  indicate   net
         Values observed above the line indicate net N mineralization, while values below the line indicate net N immobilization. N  immobilization.
        CAN
         CAN==calcium
                 calciumammonium
                          ammoniumnitratenitrate(a),
                                                 (a),PS
                                                      PS==pig
                                                           pigslurry
                                                               slurry(b),
                                                                       (b),LFD
                                                                            LFD==liquid
                                                                                     liquidfraction
                                                                                             fractionofofdigestate
                                                                                                          digestate(c).(c).

                                                    InInsoil
                                                         soilwith
                                                               withmaize
                                                                       maizegrowing,
                                                                                 growing,the    theNHNH44+-N+ -Nconcentrations
                                                                                                                  concentrationsininfertilized
                                                                                                                                           fertilizedtreatments
                                                                                                                                                         treatmentsde-   de-
                                              clined   while    the   NO    −−-N concentrations increased significantly (p < 0.05) in the first 20
                                               clined while the NO3 -N concentrations increased significantly (p < 0.05) in the first 20 days
                                                                           3

                                              days
                                               (data(data   not shown),
                                                       not shown),        which which     is consistent
                                                                                   is consistent       withwith     the nitrification
                                                                                                               the nitrification          happening
                                                                                                                                    happening              in incubated
                                                                                                                                                      in incubated      soil
                                              soil without
                                               without         plant
                                                           plant       growing.
                                                                   growing.        AtAtthetheearly
                                                                                                earlygrowing
                                                                                                        growingstagestage(0–20
                                                                                                                            (0–20days),
                                                                                                                                   days), the N uptake uptake of ofmaize
                                                                                                                                                                     maize
                                              plants
                                               plantswere
                                                        were less than 11%    11%of ofthetheapplied
                                                                                               appliedamount
                                                                                                           amount      (Figure
                                                                                                                    (Figure       3b,d,f,h),
                                                                                                                              3b,d,f,h),   whichwhich
                                                                                                                                                    led led
                                                                                                                                                          to a to  a high
                                                                                                                                                                high   accu-
                                              accumulation
                                               mulation of mineralof mineral N inNfertilized
                                                                                     in fertilizedsoil soil  compared
                                                                                                        compared            to unfertilized
                                                                                                                       to unfertilized           treatment.
                                                                                                                                            treatment.           Surpris-
                                                                                                                                                            Surprisingly,
                                              ingly,  a significant
                                               a significant            (p < 0.05)
                                                                 (p < 0.05)          decrease
                                                                                decrease            of mineral
                                                                                              of mineral     N was N was    observed
                                                                                                                      observed           in soil
                                                                                                                                   in soil   under under
                                                                                                                                                       CAN  CAN(39%)(39%)
                                                                                                                                                                        and
                                              and
                                               LFD  LFD   (27%)
                                                      (27%)        treatment
                                                              treatment           in the
                                                                               in the  firstfirst
                                                                                               20 20   days,
                                                                                                   days,  butbut    only
                                                                                                                 only   7%7%   and
                                                                                                                             and    6%,
                                                                                                                                  6%,      respectively,
                                                                                                                                        respectively,       ofof  appliedN
                                                                                                                                                               applied
                                              Nwas
                                                 wastaken
                                                       takenup upby  bymaize
                                                                          maizeplants
                                                                                   plants(Figure
                                                                                              (Figure3d,h).
                                                                                                         3d,h). From day 40 to day    day 60, 60, maize
                                                                                                                                                   maizeplants
                                                                                                                                                             plantsin inall
                                                                                                                                                                         all
                                               treatmentswent
                                              treatments      wentthrough
                                                                       throughaarapid rapidgrowth
                                                                                                growthstage.
                                                                                                          stage.Consequently,
                                                                                                                    Consequently,62–81% 62–81%ofofthe   theNNin  inshoots
                                                                                                                                                                    shoots
                                               androots
                                              and    rootswaswastaken
                                                                    taken upup    during
                                                                                during        these
                                                                                           these   4040   days.
                                                                                                       days.   TheThe    calculated
                                                                                                                     calculated    Nrel,N
                                                                                                                                        net (%)
                                                                                                                                          rel,     (%)
                                                                                                                                               netin     in planted
                                                                                                                                                      planted           soil
                                                                                                                                                                 soil was
                                               was   lower    than    the  initial  mineral       N   to total   N  ratio  (presented
                                              lower than the initial mineral N to total N ratio (presented as red lines in Figure 4), indi-as  red   lines   in Figure    4),
                                               indicating    a  net  N   immobilization         effect  under    vegetation.
                                              cating a net N immobilization effect under vegetation. The three-way ANOVA showed aThe  three-way       ANOVA        showed
                                               a significant
                                              significant         difference
                                                            difference      (p
Agriculture 2021, 11, 870                                                                                                                              10 of 18

                                    3.3. Nitrogen
Agriculture 2021, 11, x FOR PEER REVIEW               Mass Balance                                                                                 11 of 19

                                          In the N mass balance of incubation and pot experiment, respectively (Figure 5), the
                                    original soil mineral N supply was measured as 12 mg N kg−1 soil DW, which was the same
                                    in all in
                                   same    theall
                                               treatments.      By dayBy100,
                                                   the treatments.         daythe mineralized
                                                                                100,               N fromN
                                                                                      the mineralized      SOMfrom inSOM
                                                                                                                      incubation    was calculated
                                                                                                                             in incubation   was
                                    as 13 mg N
                                   calculated   askg 13−mg
                                                         1 soil
                                                             N DW,
                                                                 kg−1 which
                                                                      soil DW,was  higher
                                                                                 which    wasthan  that than
                                                                                                higher  in maize-growing        pots (3 mgpots
                                                                                                              that in maize-growing         N kg(3−1
                                    soilNDW).
                                   mg       kg−1 With    fertilizers
                                                  soil DW).     With applied,
                                                                      fertilizersmineral
                                                                                  applied,Nmineral
                                                                                                releasedNfrom     added
                                                                                                            released   fromCAN,    PS, CAN,
                                                                                                                               added   and LFDPS, to
                                    plant-available
                                   and                    N pool of N
                                        LFD to plant-available         incubation    experiment
                                                                          pool of incubation         was 15, 7,was
                                                                                                  experiment       and15,207,mg
                                                                                                                              andN20kgmg−1 N
                                                                                                                                           soil
                                                                                                                                             kgDW−1

                                    higher
                                   soil DWthanhigher thethan
                                                          fertilizer N supply
                                                               the fertilizer    in the pot
                                                                              N supply         experiment.
                                                                                           in the             Consequently,
                                                                                                   pot experiment.                the unmeasured
                                                                                                                       Consequently,      the un-
                                    N was 18,N18,
                                   measured          wasand18,2518,
                                                                 mg and  kg−
                                                                      N 25    1 soil
                                                                             mg  N kg DW    in CAN,
                                                                                        −1 soil  DW inPS,   and PS,
                                                                                                         CAN,     LFD   treatment,
                                                                                                                      and             respectively,
                                                                                                                            LFD treatment,    re-
                                    counting for
                                   spectively,        51%, 51%,
                                                  counting     for and
                                                                    51%,71%
                                                                          51%,ofand
                                                                                 the 71%
                                                                                      total of
                                                                                             N applied.
                                                                                                 the total This  unmeasured
                                                                                                           N applied.              N was assumed
                                                                                                                          This unmeasured       N
                                    to be
                                   was      immobilized
                                        assumed               by soil microbes
                                                      to be immobilized      by soilormicrobes
                                                                                       lost via pathways       like NH3 like
                                                                                                  or lost via pathways      volatilization,  NO3 −
                                                                                                                                 NH3 volatiliza-
                                    leaning,
                                   tion, NO3−and      denitrification.
                                                leaning,    and denitrification.
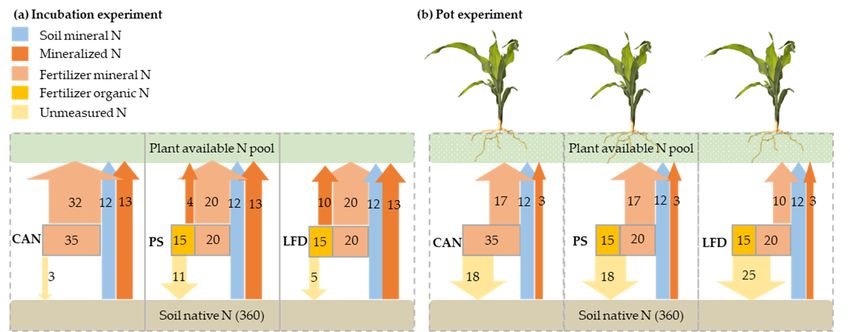
      Figure
      Figure 5.
             5. Mass
                Mass balance
                       balanceof
                               ofNNflow
                                    flowininincubation
                                              incubationexperiment
                                                          experiment(a) (a)and
                                                                            andmaize-growing
                                                                                  maize-growingpot     potexperiment
                                                                                                            experiment (b)(b)
                                                                                                                            onon
                                                                                                                               day 100.
                                                                                                                                 day    The
                                                                                                                                     100. The
      numbers represent the mean value of N concentration (mg N kg−1−soil    1    dry weight (DW)). The soil native N was measured
      numbers represent   the mean  value  of N  concentration  (mg  N   kg     soil dry  weight   (DW)).   The soil native   N was measured
      as 360 mg N kg−1−1soil DW. The soil mineral N was the mineral N in soil before fertilization, while the mineralized N from
      as 360
      soil   mg
           was   N kg soil
               calculated fromDW.
                               theThe  soil mineral
                                   difference        N was
                                               of mineral  N the mineral
                                                              content      N in soil
                                                                      in control   andbefore   fertilization,
                                                                                        fertilizer  treatmentswhile  the mineralized
                                                                                                                between    day 100 andNday
                                                                                                                                         from
      soil
      0.   was=calculated
         CAN              from the difference
                calcium ammonium     nitrate, PSof=mineral N content
                                                   pig slurry,         in control
                                                               LFD = liquid         and of
                                                                               fraction  fertilizer  treatments between day 100 and day 0.
                                                                                            digestate.
      CAN = calcium ammonium nitrate, PS = pig slurry, LFD = liquid fraction of digestate.
                                   3.4. Link of N Availability between Vegetation and Non-Vegetation
                                    3.4. The
                                          Linkresult
                                                of N Availability
                                                        of the linear    between    Vegetation
                                                                            regression      (Figureand6)Non-Vegetation
                                                                                                          indicated that there was a significant (p
                                   < 0.001)The result of the linear regression (Figure incubation
                                              relationship       between      plant-available       N  in  6) indicated  and    maize-growing
                                                                                                                             that                    pot. The
                                                                                                                                   there was a significant
                                   adjusted     R 2 value was 0.85, indicating that this model (y = 0.49x + 3.48) could explain 85%
                                    (p < 0.001) relationship between plant-available N in incubation and maize-growing pot.
                                   of
                                    Thetheadjusted
                                            prediction      of the was
                                                      R2 value         actual   N indicating
                                                                            0.85,   value of applied
                                                                                                   that thisfertilizers
                                                                                                               model (yin=the      planted
                                                                                                                               0.49x  + 3.48)pot   based
                                                                                                                                                could       on
                                                                                                                                                         explain
                                   mineral
                                    85% of the N release
                                                    predictionin laboratory
                                                                     of the actualincubation.
                                                                                        N valueHowever,
                                                                                                    of appliedthe     model estimated
                                                                                                                   fertilizers                that for
                                                                                                                                 in the planted      poteach
                                                                                                                                                          based
                                   unit  (mg N kg
                                    on mineral
                                                      −1 DW) of the plant-available N released in incubation, there was only 0.49
                                                     N release       in laboratory incubation. However, the model estimated that for
                                   mg
                                    eachN unit
                                            kg (mg
                                               −1 DW N  increase
                                                             kg−1 DW)  in theofplant-available
                                                                                 the plant-available pool N of released
                                                                                                               maize-growing         pot.
                                                                                                                            in incubation,     there was only
                                         Apart     from
                                                      −  1  the   results    in  this  study,    we   also
                                    0.49 mg N kg DW increase in the plant-available pool of maize-growing    compiled       data  from    other   published
                                                                                                                                               pot.
                                   studies Apart from the results in this study, we also compiled data from otherand
                                              (Table   3)   to  compare       the  estimated      N  availability    from     incubation,    pot,        field
                                                                                                                                                     published
                                   experiments.      Linear      regression       was   used    to  estimate    the  relationships
                                    studies (Table 3) to compare the estimated N availability from incubation, pot, and field          between      the  min-
                                   eral  N to totalLinear
                                    experiments.        N ratio       of biobased
                                                                  regression      was fertilizers     and thethe
                                                                                         used to estimate         Nrel, net determined
                                                                                                                    relationships           by incubation
                                                                                                                                       between     the mineral
                                   method
                                    N to total or NANR
                                                     ratiodetermined
                                                              of biobasedby         plant experiments
                                                                                fertilizers   and the Nrel,(pot     or field). Significant
                                                                                                                    determined       by          (p < 0.001)
                                                                                                                                         incubation     method
                                                                                                                net
                                   linear
                                    or ANR determined by plant experiments (pot or field). Significant (p < 0.001) N
                                            regressions      were     found    in  all three   estimation     methods      (Figure   7). The   value   of linear
                                                                                                                                                             rel,

                                   net determined      in   incubation      experiments        showed      the  highest    coefficient
                                    regressions were found in all three estimation methods (Figure 7). The value of Nrel, net            (y =  0.87x   + 0.11)
                                   with   the mineral
                                    determined              N to total Nexperiments
                                                     in incubation             ratio of biobased
                                                                                               showed fertilizers,   followed
                                                                                                           the highest            by ANR
                                                                                                                             coefficient   (y from   pot+(y0.11)
                                                                                                                                               = 0.87x        =
                                   0.56x   + 0.01)  and    field   (y  = 0.40x   + 0.04).  These    models    indicated
                                    with the mineral N to total N ratio of biobased fertilizers, followed by ANR from pot    that the estimated      N  avail-
                                   ability   of biobased
                                    (y = 0.56x    + 0.01) and  fertilizers
                                                                     field (ybased
                                                                                = 0.40x on +the  mineral
                                                                                              0.04).   These N models
                                                                                                                to total N     ratio was
                                                                                                                            indicated       higher
                                                                                                                                         that         in non-
                                                                                                                                                the estimated
                                   vegetated incubation than plant experiments (pot or field), consistent with the observation
                                   in this study.
Agriculture 2021, 11, 870                                                                                                                                                      11 of 18

                                     N availability of biobased fertilizers based on the mineral N to total N ratio was higher
Agriculture 2021, 11, x FOR PEER REVIEW                                                                               12 of 19
                                     in non-vegetated incubation than plant experiments (pot or field), consistent with the
                                     observation in this study.

                                                                              60

                                      Plant-available N in pot (mg kg−1 DW)
                                                                                         Control
                                                                              50
                                                                                         CAN

                                                                              40         PS

                                                                                         LFD
                                                                              30

                                                                              20

                                                                                                                         y = 0.49x + 3.48
                                                                              10
                                                                                                                        adjusted R² = 0.85

                                                                               0
                                                                                   0          10          20          30            40           50   60
                                                                                              Plant-available N in incubation (mg   kg−1   DW)

                                     Figure 6. Regression of the mean concentrations of plant-available N (mg kg−1 DW) in incubation
                                   Figure 6. Regression of the mean concentrations of plant-available N (mg kg−1 DW) in incubation
                                     and maize-growing pot. The linear line in red indicates the expected correlation while the linear line
                                   and maize-growing pot. The linear line in red indicates the expected correlation while the linear line
                                     in blue indicates the actual correlation. Control = no N fertilizer, CAN = calcium ammonium nitrate,
                                   in blue indicates the actual correlation. Control = no N fertilizer, CAN = calcium ammonium nitrate,
                                   PSPS  = pig
                                       = pig   slurry,LFD
                                             slurry,   LFD= = liquid
                                                            liquid   fraction
                                                                   fraction ofof digestate.
                                                                               digestate.

                 Literaturedata
       Table3.3.Literature
     Table                  datasource
                                  sourcefor
                                         forFigure
                                             Figure7 7referring
                                                         referringtotothe
                                                                       theestimation
                                                                           estimationofofthe
                                                                                          theNNvalue
                                                                                                valueofofbiobased
                                                                                                          biobasedfertilizer
                                                                                                                    fertilizervia
                                                                                                                               vialaboratory
                                                                                                                                    laboratory
       incubationsand
     incubations     andplant
                         plantexperiments
                                experiments(field
                                              (fieldororpot).
                                                         pot).

Estimation
    Estimation Method                                                                               Biobased Fertilizers                                   Duration   References
                                                                                         Biobased Fertilizers                                               Duration References
 Method                                                                       Pig slurry, digested pig slurry, and digested cattle slurry                  70 days       [34]
                           Pig slurry, digested pig slurry,        and digested
                                                          Dairy cattle     slurry     cattle slurry             8470  days
                                                                                                                    days                                                 [34]
                                                                                                                                                                         [35]
                                Pig slurry, cattleDairy
                                                   slurry,cattle
                                                           farmyard      cattle manure, and composted
                                                                    slurry                                         84 days                                               [35]
                                                                                                                107 days                                                 [36]
                                                       farmyard cattle manure
              Pig slurry, cattle slurry, farmyard cattle manure, and composted farmyard cattle
   Laboratory incubation
Laboratory                           Pig manure, digestate, liquid fraction of digestate, and                     107  days                                              [36]
                                                         manure                                                 120  days                                                [37]
incubation                                               mineral     concentrate
                 Pig manure, digestate, liquid   Pigfraction
                                                     slurry, andof digestate,
                                                                    digested pig  and  mineral concentrate
                                                                                    slurry                      56120  days
                                                                                                                    days                                                 [37]
                                                                                                                                                                         [38]
                                            Pig  slurry  and   liquid   fraction
                                        Pig slurry, and digested pig slurry       of digestate                  100  days
                                                                                                                   56 days                                            This study
                                                                                                                                                                        [38]
                                    Pig slurry
                            Unseparated          and and
                                          digestate,  liquid
                                                           liquidfraction
                                                                    fraction ofand
                                                                                digestate
                                                                                    solid fraction of digestate   100 days                                            This study
            Pot                                                                                                  56 days                                                 [39]
              Unseparated digestate, and  derived
                                             liquid from  animaland
                                                      fraction       manure
                                                                         solidorfraction
                                                                                   energy crops
                                                                                           of digestate derived
    Pot experiment                          Pig slurry and liquid fraction of digestate                         10056days
                                                                                                                      days                                              [39]
                                                                                                                                                                      This study
                                      from animal manure or energy crops
experiment
                                    Pig slurry and liquid Pig         slurryof digestate
                                                                 fraction                                        3100
                                                                                                                   years
                                                                                                                       days                                           This[40]
                                                                                                                                                                           study
                                              Raw or digested liquid swine manure                                3 years                                                  [41]
                                                        Pig slurry
                                              Raw or digested liquid swine manure
                                                                                                                   3 years
                                                                                                                 3 years
                                                                                                                                                                         [40]
                                                                                                                                                                          [42]
                                      Raw   or digested     liquid     swine   manure
                                   Raw dairy manure slurry and anaerobically digested slurry                       3 years
                                                                                                                 3 years                                                 [41]
                                                                                                                                                                          [43]
                            Raw liquidRaw   or digested
                                        swine               liquid
                                                manure, solid          swine
                                                                  fraction   ofmanure
                                                                                swine manure, and digestate        3 years                                               [42]
           Field                                                                                                 3 years                                                  [44]
                         Raw   dairy  manure    slurry   and swine    manure
                                                                anaerobically       digested   slurry              3 years                                               [43]
        experiment
                                                Pig slurry and mineral concentrate                               2 years                                                  [3]
                Raw liquid swine manure, solid fraction of swine manure, and digestate swine
   Field                     Raw cattle slurry, unseparated digestate, and liquid fraction and solid               3 years                                               [44]
                                                         manure                                                  3 years                                                 [45]
experiment                                               fraction    of digestate
                                       Pig slurry
                                   Digestate derivedandfrommineral
                                                              food wasteconcentrate
                                                                              or municipal solid waste             2 years
                                                                                                                 2 years                                                 [3]
                                                                                                                                                                         [46]
                                                   Liquid   fraction    of pig  manure
              Raw cattle slurry, unseparated digestate, and liquid fraction and solid fraction of                2 years                                                 [47]
                                                                                                                   3 years                                               [45]
                                                        digestate
                         Digestate derived from food waste or municipal solid waste                                2 years                                               [46]
                                          Liquid fraction of pig manure                                            2 years                                               [47]
Agriculture 2021, 11, x FOR PEER REVIEW                                                                                                          13 of 19
Agriculture 2021, 11, 870                                                                                                                         12 of 18

                                                     1
                                                                                                                           y = 0.87x + 0.11    Incubation
                                                                                                                          Adjusted R2 = 0.72   Nrel, net
                                                                                                                              p < 0.001
                                                                                                                               (n = 32)
                                                    0.8

                                                                                                                           y = 0.56x + 0.01
                                                                                                                                               Pot ANR
                                                                                                                          Adjusted R2 = 0.57
                                                    0.6
                                  Nrel,net or ANR

                                                                                                                              p < 0.001
                                                                                                                                (n = 18)

                                                                                                                           y = 0.40x + 0.04
                                                    0.4                                                                                        Field ANR
                                                                                                                          Adjusted R2 = 0.33
                                                                                                                              p < 0.001
                                                                                                                               (n = 101)

                                                    0.2

                                                     0
                                                          0   0.2      0.4            0.6             0.8             1

                                                                         Mineral N to total N ratio

                                 Figure 7. Regressions of the N net determined by incubation method or ANR determined by plant
                                 Figure 7. Regressions of the Nrel,
                                                                 rel, net determined by incubation method or ANR determined by plant
                                 experiments (field
                                 experiments   (field or
                                                      or pot)
                                                         pot) against
                                                              against thethe mineral
                                                                             mineral N
                                                                                     N to
                                                                                       to total
                                                                                          total N
                                                                                                N ratio
                                                                                                  ratio of
                                                                                                        of biobased
                                                                                                           biobased fertilizers.
                                                                                                                    fertilizers. The
                                                                                                                                 The dotted
                                                                                                                                     dotted
                                 lines indicate their relationship estimated by linear regression. Data were collected from published
                                 lines indicate their relationship  estimated   by linear regression. Data  were collected  from  published
                                 studies and this study (see Table 3).
                                 studies

                                 4. Discussion
                                    Discussion
                                 4.1. Effect
                                      Effect of
                                             of Vegetation
                                                Vegetation on N Mineralization
                                        In this
                                       In  this study,
                                                 study, aadirect
                                                             directcomparison
                                                                       comparisonofofNNdynamics
                                                                                             dynamicsbetweenbetween   conditions
                                                                                                                        conditions  with
                                                                                                                                       withand  without
                                                                                                                                              and  with-
                                 vegetation     was    achieved      through    synchronous       investigation       using
                                 out vegetation was achieved through synchronous investigation using laboratory incuba-      laboratory     incubation
                                 and and
                                 tion  maize-growing
                                            maize-growing    pots.pots.
                                                                     It ended   up with
                                                                           It ended        net Nnet
                                                                                      up with      mineralization
                                                                                                       N mineralization(in PS(inandPSLFDandtreatments)
                                                                                                                                             LFD treat-
                                 or equilibrium
                                 ments)              (in CAN(in
                                           or equilibrium          treatment)    in unplanted
                                                                     CAN treatment)               incubation
                                                                                           in unplanted           but net Nbut
                                                                                                              incubation       immobilization
                                                                                                                                  net N immobiliza- in all
                                 fertilized
                                 tion  in all treatments      of the maize-growing
                                               fertilized treatments                       pot (Figurepot
                                                                            of the maize-growing           4). This   indicated
                                                                                                                (Figure   4). Thisa indicated
                                                                                                                                     relatively alow    N
                                                                                                                                                     rela-
                                 recovery    from    fertilizers    to  plants  (Figure   6), which     is in line with   the
                                 tively low N recovery from fertilizers to plants (Figure 6), which is in line with the rela-   relatively   low  N    use
                                 efficiency
                                 tively  low globally      (approximately
                                               N use efficiency        globally40%     on average) [48].
                                                                                  (approximately       40% on This   was further
                                                                                                                  average)           confirmed
                                                                                                                              [48]. This           in the
                                                                                                                                            was further
                                 literature    data   (Figure     7)  as the  ANRs     calculated     in  plant   experiments
                                 confirmed in the literature data (Figure 7) as the ANRs calculated in plant experiments           are   mostly   lower
                                 thanmostly
                                 are    0.6 (except
                                                 lowerone thandataset    collected
                                                                  0.6 (except     onefrom   fieldcollected
                                                                                       dataset     application     of liquid
                                                                                                                from            swine manure).
                                                                                                                       field application              The
                                                                                                                                               of liquid
                                 incubation     method      indicated     relatively   higher   N   values   at  most
                                 swine manure). The incubation method indicated relatively higher N values at most min- mineral    N  to  total N  ratios
                                 thanNthe
                                 eral     topot
                                             totaland   field experiments.
                                                    N ratios     than the pot The and differences      of estimated
                                                                                        field experiments.              N availability
                                                                                                                  The differences          between the
                                                                                                                                        of estimated    N
                                 methods     mentioned        above     can   be attributed    to  the  higher
                                 availability between the methods mentioned above can be attributed to the higher potential    of N   loss  under    field
                                                                                                                                                 poten-
                                 (uncontrolled, with vegetation) conditions than pot trials (controlled, with vegetation) and
                                 tial of N loss under field (uncontrolled, with vegetation) conditions than pot trials (con-
                                 the least in incubation experiments (controlled, without vegetation). As shown by the N
                                 trolled, with vegetation) and the least in incubation experiments (controlled, without veg-
                                 mass balance (Figure 5), a higher amount of N from fertilizers remained unmeasured in
                                 etation). As shown by the N mass balance (Figure 5), a higher amount of N from fertilizers
                                 the pot rather than in incubation, which indicated the possibility of higher fertilizer N loss
                                 remained unmeasured in the pot rather than in incubation, which indicated the possibility
                                 under vegetation. Therefore, it suggested that the mineral N to total N ratio or unplanted
                                 of higher fertilizer N loss under vegetation. Therefore, it suggested that the mineral N to
                                 soil incubation method may not be a realistic predictor for quantitative estimation on the
                                 total N ratio or unplanted soil incubation method may not be a realistic predictor for quan-
                                 N value of biobased fertilizers (and synthetic mineral N fertilizers) in plant experiments
                                 titative estimation on the N value of biobased fertilizers (and synthetic mineral N fertiliz-
                                 (field or pot).
                                 ers) in plant experiments (field or pot).
                                        In a short-term investigation as this experiment, the main pathways for plant-available
                                       In a short-term investigation as this experiment, the main pathways for plant-availa-
                                 N loss can include NO3 − leaching, NH3 volatilization, denitrification, and microbial immo-
                                 ble N loss can include NO3− leaching, NH3 volatilization, denitrification, and microbial
                                 bilization. In the case of this experiment, no N leaching occurred in either incubation or pot
                                 immobilization.
                                 setups. The NH3Involatilization
                                                           the case of this     experiment,
                                                                             loss  was assumed  no N toleaching     occurred
                                                                                                         be negligible    due in to either  incubation
                                                                                                                                    the homogenous
                                 or pot   setups.   The   NH   3 volatilization loss was assumed to be negligible due to the homog-
                                 mixing of fertilizers and soil [10,49] and the high soil moisture (70% WHC) [50]. However,
                                 enous    mixingofofmaize
                                 the presence            fertilizers
                                                               plantsand mightsoilhave
                                                                                   [10,49]   and the
                                                                                         increased    thehigh    soilvia
                                                                                                            losses     moisture
                                                                                                                         microbial (70%     WHC) [50].
                                                                                                                                       immobilization
Agriculture 2021, 11, 870                                                                                          13 of 18

                            and denitrification. It was reported that the contribution of immobilization to N loss might
                            account for 15–21% of applied N from PS as reported in field application by Sørensen and
                            Amato [51]. Their study also demonstrated by parallel incubation that the N immobiliza-
                            tion mainly occurs within the first two weeks after application. Using the 15 N isotopic
                            labeling technique, Qian et al. [25] found in a maize-growing experiment that on average,
                            23% of the 15 N (applied as 15 NH4 15 NO3 ) remaining in unplanted soil was assimilated in
                            microbial biomass, with another 13% as non-biomass organic N resulted from the NMIT
                            process; these rates were 16% and 82% in planted soil. This suggested the presence of
                            maize plant enhanced the NMIT rate and resulted in higher microbial immobilization.
                            In the same experiment, increased denitrification losses by 19–57% were also observed
                            under vegetation [25] during early growth stages when the release of root-derived C was
                            the highest. Similarly, Malique et al. [52] observed up to 5.3-fold higher denitrification
                            rates in planted soil than unplanted soil, which was most pronounced on day 10 after
                            transplantation. This is consistent with the high mineral N reductions in maize-growing
                            pots during the first 20 days in this study (Figure 3d,f,h), where the favorable conditions
                            (70% WHC, ~20 ◦ C) together with the high availability of soil NO3 and low uptake by
                            young maize plant may have further promoted the microbial metabolism [53] and deni-
                            trification [54,55]. In addition, the rewetting of the air-dried soil at the beginning of this
                            experiment might have reactivated the soil microbial metabolism [56,57] and thus resulted
                            in increased N immobilization under vegetation. Therefore, most of the fertilizer N that
                            remained unmeasured in maize-growing pots (Figure 5b) could be a result of the combined
                            effect of microbial immobilization and denitrification under vegetation. However, it is
                            difficult to conclude the relative contributions of immobilization and denitrification. The
                            mechanism underlying is not fully understood, and more effort is needed to investigate
                            the plant-microorganism interactions on soil N cycle at the root level.

                            4.2. Effect of Fertilization on N Mineralization
                                  As expected, by the end of incubation, CAN treatment reached the highest Nrel, net
                            (%) as 96.9 ± 5.8%, meaning no significant net N mineralization or immobilization effect.
                            However, the Nrel, net (%) of PS and LFD were higher than the initial mineral N to total
                            N ratio, indicating net N mineralization. These observations are in the range of reported
                            Nrel, net (44–94% of total N) in other studies [10,36,37,58]. The higher Nrel, net (%) of LFD
                            compared to PS can be attributed to the more recalcitrant organic matter presented in LFD
                            due to the decomposition and stabilization of organic matter in the anaerobic digestion
                            process [59]. Dilly [60] suggested that the input of readily decomposable organic matter
                            to soil can increase the proportion of fast-growing microorganisms (r-strategists) that
                            tend to utilize labile C and mineral N to meet their requirements [61,62]. Kirchmann
                            and Lundvall [34] also demonstrated this correlation, concluding that fatty acids acted as
                            an easily decomposable C source for microorganisms, stimulating assimilation of N upon
                            application to soil. Conversely, the input of recalcitrant organic matter can stimulate the
                            growth of slow-growing microorganisms (K-strategists), which increase the decomposition
                            rate of organic matter [63]. Therefore, in the case of incubation, PS might have led to
                            a higher proportion of r-strategists than in LFD treatment, resulting in more mineral N
                            assimilated in microbial biomass.
                                  In the case under vegetation, CAN treatment reached the highest Nrel, net (%) as
                            49.4 ± 10.7% by the end of the experiment. However, in contrast to incubation, PS treatment
                            under vegetation reached a comparable Nrel, net (%) (49.3 ± 3.6%) to CAN but higher than
                            LFD (30.6 ± 10.2%) (Figure 4). A possible explanation is that root exudates appeared to be
                            a labile C source more favorable for microorganisms than the SOM or added organic matters
                            via fertilizers [20]. Therefore, the easily degradable organic matter from PS performed as an
                            N source and provided more N for microorganisms and plants in the later growth stages,
                            which resulted in higher N uptake in PS treatment than LFD treatment (Figure 3). Overall,
                            as discussed above, the plant-available N in fertilized pots decreased in the initial 20 days.
                            This is consistent with the observation by Alburquerque et al. [10], Abubaker et al. [64], and
Agriculture 2021, 11, 870                                                                                            14 of 18

                            Kirchmann and Lundvall [34], who reported it as the potential microbial assimilation or
                            denitrification loss due to high microbial activities. Therefore, it is suggested to postpone
                            the application of fertilizers with high mineral N (e.g., CAN in this experiment) to avoid
                            high denitrification loss in the early stages and to better synchronize with the plant N
                            demand [65]. However, in the case of microbial N immobilization, the assimilated N in the
                            initial phase can also benefit by reducing the potential long-term NO3 leaching losses from
                            mineralized N and the residual fertilizer-N effects in the years after application [66].

                            4.3. Effect of N Deficiency on Plant Growth and N Dynamics
                                  As shown in Section 3.1, pale or drying symptoms starting from leave tips were
                            observed in the maize-growing pot experiment from day 70, which may indicate N defi-
                            ciency [67]. As proposed by Plénet and Lemaire [68], the critical N concentration required
                            to produce the maximum aerial biomass should reach 3.40% when DW yield is lower than
                            1 t ha−1 or 3.40 × (DW)−0.37 when DW yield is in the range of 1–22 t ha−1 . If converting
                            the unit of DW yields (g plant−1 ) of maize plant in this experiment into kg ha−1 based
                            on the occupied soil surface (0.008 m2 per plant), the critical N concentrations for this
                            experiment can be calculated (data not shown). It indicated that the shoot N concentrations
                            in all treatments (Table 2) were lower than the calculated critical N concentrations since
                            day 60. These low N concentrations indicated that all the maize plants suffered from N
                            deficiency in the following growth stages. In the unfertilized control treatment, as indicated
                            by the significantly lower N uptake since day 40 (Table 2), the required N for maize plant
                            growth was never met by the released N from the decomposition of SOM from day 20. For
                            fertilized treatments, though a rate of 150 kg total N ha−1 was applied as recommended
                            by the Belgian Soil Service, the total amount of N available for each maize plant in the
                            pot (maximum 235.4 mg in CAN treatment) was less than what might be received in the
                            field (1875–2500 mg calculated from 6–8 plants m−2 ) due to the less occupied surface area
                            (0.008 m2 ) in the pot compared to the 0.125–0.167 m2 in the field.
                                  Moreover, there was a possibility that a non-synchronized timing of N mineralization
                            and crop N demand happened due to the N immobilization or denitrification at the early
                            stage when the N uptake was low. Therefore, shortly after day 40, the soil N in this pot
                            experiment was insufficient to support the optimal growth of the maize plant. Therefore,
                            N deficiency and its potential impact on the soil N dynamics suggested that the results
                            from the pot-scale experiment should be taken with caution when transferring to open
                            field practice.
                                  Uptake of mineral nutrients by roots strongly influences the vegetative and reproduc-
                            tive development of the shoots. Usually, nutrient uptake is regulated in response to the
                            demand of shoots [69]. However, when a nutrient is deficient compared to the root uptake
                            capacity, the uptake rate is governed by the nutrient supply rather than by the ability of
                            plants to take up nutrients [70]. Suffering from severe N deficiency, most maize leaves
                            became completely yellow or dried out which resulted in no significant change in FW
                            biomass yields from day 80 to day 100 while the DW yields significantly (p < 0.05) increased
                            (Table 2). Compared to shoots, plant roots exhibit considerable plasticity to the changes
                            in nutrient availability [71] by modifying root growth [72] or root physiological traits [73].
                            When soil N supply is limited, the length of primary roots, seminal roots, and nodal roots
                            increased to explore a larger soil volume, thus increasing spatial N availability [74]. This
                            was verified by the rapid increase of root FW and DW in control treatment from germina-
                            tion to day 60 (Table 2). As the N-deficient condition becomes severe, the roots focus more
                            on the enhanced growth in primary and nodal roots rather than the elongation of lateral
                            root [75,76]. This resulted in increased assimilation of nutrients in roots, as indicated by the
                            negligible increase of DW (Table 2) but increased N concentrations and significant drops in
                            C/N ratio (Figure 2b) from day 80 to the end.
You can also read