ASIA-PACIFIC MIGRATION DATA REPORT 2020 - COVER TBD - ReliefWeb

 
CONTINUE READING
ASIA-PACIFIC MIGRATION DATA REPORT 2020 - COVER TBD - ReliefWeb
ASIA–PACIFIC
MIGRATION DATA
REPORT 2020
IOM ASIA–PACIFIC REGIONAL DATA HUB

                              COVER TBD
ASIA-PACIFIC MIGRATION DATA REPORT 2020 - COVER TBD - ReliefWeb
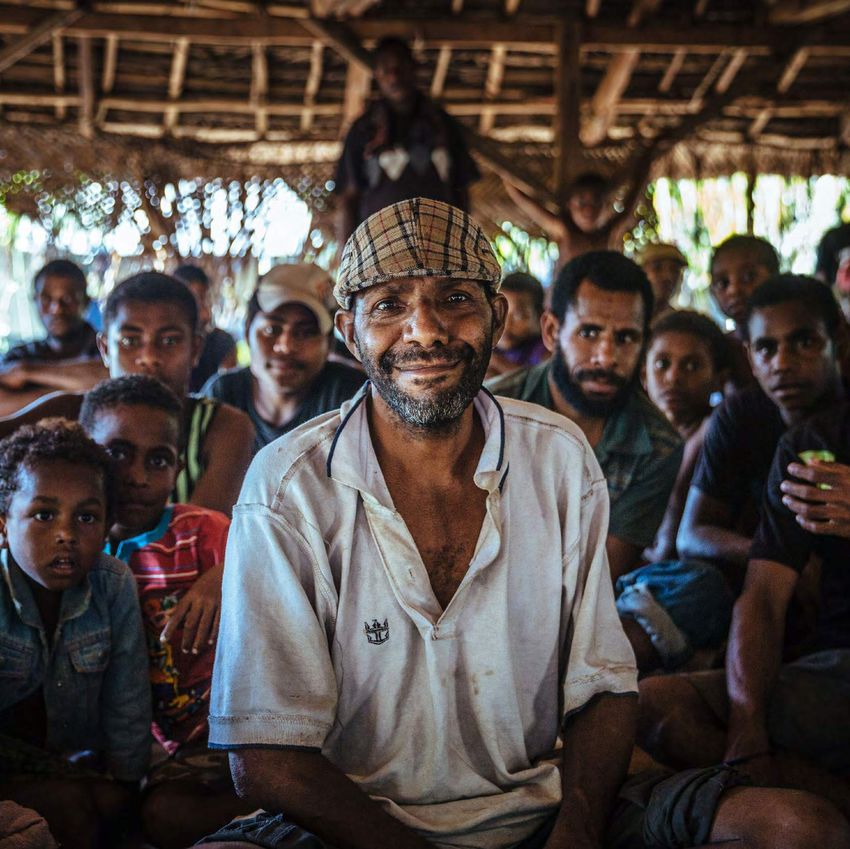
The opinions expressed in the report are those of the authors and do not necessarily reflect the views of the International Organization for

                                                                                                                                                  ASIA–PACIFIC
Migration (IOM). The designations employed and the presentation of material throughout the report do not imply the expression of any
opinion whatsoever on the part of IOM concerning the legal status of any country, territory, city or area, or of its authorities, or concerning
its frontiers or boundaries.

IOM is committed to the principle that humane and orderly migration benefits migrants and society. As an intergovernmental organization,

                                                                                                                                                  MIGRATION DATA
IOM acts with its partners in the international community to: assist in meeting the operational challenges of migration; advance understanding
of migration issues; encourage social and economic development through migration; and uphold the human dignity and well-being of
migrants.

ACKNOWLEDGEMENTS
The IOM Regional Office for Asia and the Pacific (ROAP) Regional Data Hub (RDH) team would like to extend special thanks to ROAP
Director Dr. Maria Nenette Motus, Regional Thematic Specialists and other IOM colleagues for their constructive feedback on the draft
                                                                                                                                                  REPORT 2020
chapters, including Andrea Milan, Andrew Lind, Donato Colucci, Itayi Viriri, Julia Black, Kate Dearden, Maria Moita, Maria Veger, Nikki
Herwanger, Pablo Rojas Coppari, Patrick Duigan, Peppi Kiviniemi-Siddiq, Roberto Roca, Tomas Martin Ernst, Vivianne Van de Vorst and
Yunxian Jiang. The RDH team also thanks Valerie Hagger and the IOM Publication Team for their contribution in finalizing this report.
                                                                                                                                                  IOM ASIA–PACIFIC REGIONAL DATA HUB
RDH team: Chandan Nayak, Anny Yip-Ching Yu, Gabriela Alvarez Sánchez, Emanuele Albarosa, Venkatesh Balaji, Bridgette Hogan and
Zikria Takamul.

This project has received funding from Migration Resource Allocation Committee (MiRAC).

This publication has been issued without formal editing by IOM.

International Organization for Migration (IOM)
Regional Office for Asia and the Pacific
18th Floor, Rajanakarn Building
3 South Sathorn Road
Bangkok 10120
Thailand
Tel: +66 2 343 9400
Email: robangkok@iom.int
Web: www.iom.int/asia-and-pacific

Regional Data Hub

Email: rdhroap@iom.int
twitter: https://twitter.com/RDHAsiaPacific

© IOM 2021

Some rights reserved. This work is made available under the Creative Commons Attribution-NonCommercial-NoDerivs 3.0 IGO
License (CC BY-NC-ND 3.0 IGO).

For further specifications please see the Copyright and Terms of Use.

This publication should not be used, published or redistributed for purposes primarily intended for or directed towards commercial advantage
or monetary compensation, with the exception of educational purposes e.g. to be included in textbooks.

Permissions: Requests for commercial use or further rights and licensing should be submitted to publications@iom.int

PUB2021/119/R

                                                                                                                                                                                       ƐŝĂĂŶĚƚŚĞWĂĐŝĮĐ
ASIA-PACIFIC MIGRATION DATA REPORT 2020 - COVER TBD - ReliefWeb
Due to massive internal migration in Mongolia, almost half of the population lives in the capital city of Ulaanbaatar,
     leaving rural Mongolia deserted | © IOM 2021/B. BYAMBAOCHIR
                                                                                                                              FOREWORD

                                                                                                                              For several decades, countries in the Asia–Pacific region have been characterized as the places of origin, destination, and
                                                                                                                              transit for millions of migrants. Migration to, from and within the region has been motivated by economic opportunities,
                                                                                                                              labour demand from abroad, emerging threats and conflicts, natural disasters, and the effects of unsustainable development.

                                                                                                                              However, in 2020, these drivers of migration were heavily disrupted by the global pandemic. COVID-19 influenced most
                                                                                                                              migration movements, as border closures and movement restrictions reduced mobility worldwide.

                                                                                                                              Well into the middle of 2021, COVID-19 has continued to disrupt and affect migration and displacement. Notably, however,
                                                                                                                              the response to the pandemic has also highlighted stories of migrant resilience and their immense contributions to societies
                                                                                                                              across the region and world. It is, therefore, imperative that improved and up-to-date information is made available to
                                                                                                                              better understand migration pathways, drivers, and decision-making as well as to design effective and comprehensive
                                                                                                                              policies.

                                                                                                                              In July 2020, the Regional Data Hub for Asia and the Pacific adopted its objectives, in line with IOM’s Global Migration
                                                                                                                              Data Strategy and guided by IOM Strategic Vision 2019–2023 as well as the Asia Pacific Regional Strategy 2020–2024 to
                                                                                                                              strengthen the regional evidence base on migration, enhance IOM’s data collection and analysis capabilities and to ensure
                                                                                                                              more evidence-based IOM, UN-wide and government engagement on migration issues.

                                                                                                                              I am pleased that the Asia–Pacific Migration Data Report 2020 represents a significant step towards meeting these
IV

                                                                                                                                                                                                                                                                V
                                                                                                                              objectives. Based on data availability, the report brings out the main elements of migration dynamics in the region and
                                                                                                                              their interaction with associate policies vis-à-vis the influence of COVID-19 and serves as a guide to understand the main
                                                                                                                              regional migration dynamics in the region and beyond.

                                                                                                                              In line with Objective 1 of the Global Compact for Safe, Orderly and Regular Migration to “collect and utilize accurate
                                                                                                                              and disaggregated data as a basis for evidence-based policies”, the Report captures the consequences of COVID-19 on
                                                                                                                              migration and on migrants’ lives across the Asia–Pacific region.

                                                                                                                              Notably, the Report provides a significant set of recommendations to improve data collection activities in the region in
                                                                                                                              various areas including migration statistics, types of migration, migration policy, vulnerabilities, and development, which are
                                                                                                                              intended for consideration by partners, stakeholders, and government counterparts in the region.

                                                                                                                              It is with this in mind, that I look forward to the Asia–Pacific Migration Data Report 2020 richly contributing to discussions
                                                                                                                              on and better understanding of migration, as well as fostering regional collaboration that facilitates orderly, safe, and
                                                                                                                              responsible migration and mobility of people, including through implementation of planned and well-managed migration
                                                                                                                              policies.

                                                                                                                                                                                                             Dr. Maria Nenette Motus
                                                                                                                                                                                                             Regional Director,
                                                                                                                                                                                                             IOM Regional Office for Asia and the Pacific

     IOM Asia–Pacific Regional Data Hub                                                                                       IOM Asia–Pacific Regional Data Hub
ASIA-PACIFIC MIGRATION DATA REPORT 2020 - COVER TBD - ReliefWeb
ACRONYMS

      ACAPS                    Assessment Capacities Project

      ADB                      Asian Development Bank

      ASEAN                    Association of Southeast Asian Nations

      CTDC                     Counter-Trafficking Data Collaborative

      DTM                      Displacement Tracking Matrix

      ECOSOC                   United Nations Economic and Social Council

      EU                       European Union

      GCC                      Gulf Cooperation Council

      IDMC                     Internal Displacement Monitoring Centre

      IDPs                     Internally Displaced Persons

      ILO                      International Labour Organization

      IOM                      International Organization for Migration
VI

      MGI                      Migration Governance Indicators

      OECD                     Organisation for Economic Co-operation and Development

      SDG                      Sustainable Development Goals

      RDH                      Regional Data Hub

      ROAP                     Regional Office for Asia and the Pacific

      UN                       United Nations

      UN DESA                  United Nations Department of Economic and Social Affairs

      UNHCR                    United Nations High Commissioner for Refugees

      UNICEF                   United Nations Children’s Fund

      UNODC                    United Nations Office on Drugs and Crime

      UN OCHA                  United Nations Office for the Coordination of Humanitarian Affairs

      WHO                      World Health Organization

                                                                                                    A village girl poses in her traditional clothing in Killerton, Papua New Guinea | © IOM 2016/Muse MOHAMMED

     IOM Asia–Pacific Regional Data Hub
ASIA-PACIFIC MIGRATION DATA REPORT 2020 - COVER TBD - ReliefWeb
Asia–Pacific Migration
                                                                                                                                                                                                                                                                 Data Report 2020

       TERMINOLOGY

        Asia–Pacific / Asia       In this document, the referral of countries within the Asia–Pacific region follows IOM’s definition         Migrant smuggling         “The procurement, in order to obtain, directly or indirectly, a financial or other material benefit, of
        and the Pacific           and includes the following countries: Afghanistan, Australia, Bangladesh, Brunei Darussalam, Bhutan,                                  the illegal entry of a person into a State Party of which the person is not a national or a permanent
                                  Cambodia, China, Cook Islands, Democratic People’s Republic of Korea, Fiji, Federated States of                                       resident.”2
                                  Micronesia, India, Indonesia, Islamic Republic of Iran, Japan, Kiribati, Republic of Korea, Lao People’s
                                  Democratic Republic, Malaysia, Maldives, Marshall Islands, Mongolia, Myanmar, Nauru, Nepal, New             Migrant stock             Migrant stock refers to, for statistical purposes, “the total number of international migrants
                                  Zealand, Pakistan, Palau, Papua New Guinea, the Philippines, Samoa, Singapore, Solomon Islands,                                       present in a given country at a particular point in time who have ever changed their country of
                                  Sri Lanka, Thailand, Timor-Leste, Tonga, Tuvalu, Viet Nam and Vanuatu.                                                                usual residence.”2

        Asylum seeker             ”A person who seeks safety from persecution or serious harm in a country other than his or her              Non-refoulement           The principle of non-refoulement refers to the “prohibition for States to extradite, deport, expel
                                  own and awaits a decision on the application for refugee status under relevant international and                                      or otherwise return a person to a country where his or her life or freedom would be threatened,
                                  national instruments. In case of a negative decision, the person must leave the country and may be                                    or where there are substantial grounds for believing that he or she would risk being subjected to
                                  expelled, as may any non-national in an irregular or unlawful situation, unless permission to stay is                                 torture or other cruel, inhuman and degrading treatment or punishment, or would be in danger of
                                  provided on humanitarian or other related grounds.”1                                                                                  being subjected to enforced disappearance, or of suffering another irreparable harm.”2

        East Asia                 The East Asia subregion under IOM definition includes China, Democratic People’s Republic of                Refugee                   ”A person who, owing to a well-founded fear of persecution for reasons of race, religion,
                                  Korea, Japan and Republic of Korea.                                                                                                   nationality, membership of a particular social group or political opinions, is outside the country of
                                                                                                                                                                        his nationality and is unable or, owing to such fear, is unwilling to avail himself of the protection
        Forced migration          Forced migration is “a migratory movement which, although the drivers can be diverse, involves                                        of that country (Art. 1(A)(2), Convention relating to the Status of Refugees, Art. 1 A(2), 1951 as
                                  force, compulsion, or coercion.”1 The definition includes a note that clarifies that, “(w)hile not                                    modified by the 1967 Protocol).”2
                                  an international legal concept, this term has been used to describe the movements of refugees,
VIII

                                                                                                                                                                                                                                                                                       IX
                                  displaced persons (including those displaced by disasters or development projects), and, in some            Remittances               ”Personal monetary transfers, cross border or within the same country, made by migrants to
                                  instances, victims of trafficking. At the international level, the use of this term is debated because                                individuals or communities with whom the migrant has links.”2
                                  of the widespread recognition that a continuum of agency exists rather than a voluntary/forced
                                  dichotomy and that it might undermine the existing legal international protection regime.”1                 South Asia                The South Asia subregion under IOM definition includes Bangladesh, Bhutan, India, Maldives, Nepal
                                                                                                                                                                        and Sri Lanka.
        International migrant     “Any person who is outside a State of which he or she is a citizen or national, or, in the case of a
                                  stateless person, his or her State of birth or habitual residence. The term includes migrants who           South-East Asia           The South-East Asia subregion under IOM definition includes Brunei Darussalam, Cambodia,
                                  intend to move permanently or temporarily, and those who move in a regular or documented                                              Indonesia, Lao People’s Democratic Republic, Malaysia, Myanmar, the Philippines, Singapore,
                                  manner as well as migrants in irregular situations.”1                                                                                 Thailand, Timor-Leste and Viet Nam.

        Internally displaced      ”Persons or groups of persons who have been forced or obliged to flee or to leave their homes               South-West Asia           The South-West Asia subregion under IOM definition includes Afghanistan, Pakistan and Islamic
        persons (IDPs)            or places of habitual residence, in particular as a result of or in order to avoid the effects of armed                               Republic of Iran.
                                  conflict, situations of generalized violence, violations of human rights or natural or human-made
                                  disasters, and who have not crossed an internationally recognized State border.”1                           The Pacific               The Pacific subregion under IOM definition includes Australia, Cook Islands, Fiji, Federated States
                                                                                                                                                                        of Micronesia, Kiribati, Marshall Islands, Nauru, New Zealand, Palau, Papua New Guinea, Samoa,
        Irregular migration       ”Movement of persons that takes place outside the laws, regulations, or international agreements                                      Solomon Islands, Tonga, Tuvalu and Vanuatu.
                                  governing the entry into or exit from the State of origin, transit or destination.”  1

                                                                                                                                              Trafficking in persons    Trafficking in persons refers to “(t)he recruitment, transportation, transfer, harbouring or receipt
                                                                                                                                              / Human trafficking       of persons, by means of the threat or use of force or other forms of coercion, of abduction, of
        Labour migrant /          ”A person who is to be engaged, is engaged or has been engaged in a remunerated activity in a
        Migrant worker            State of which he or she is not a national.”1                                                                                         fraud, of deception, of the abuse of power or of a position of vulnerability or of the giving or
                                                                                                                                                                        receiving of payments or benefits to achieve the consent of a person having control over another
                                                                                                                                                                        person, for the purpose of exploitation.”2

       1. International Organization for Migration, Glossary on Migration (2019).                                                            2. Ibid.

       IOM Asia–Pacific Regional Data Hub                                                                                                    IOM Asia–Pacific Regional Data Hub
ASIA-PACIFIC MIGRATION DATA REPORT 2020 - COVER TBD - ReliefWeb
Asia–Pacific Migration
                                                                                                                                                                                                                    Data Report 2020

TABLE OF
CONTENTS
            Executive Summary                                                                         XVI                3.4 Irregular Migration                                                                          83

            Introduction                                                                               01                          3.4.1 Document Falsification                                                           83
                                                                                                                                   3.4.2 Migrant Smuggling                                                                84

01          Migration Policy                                                                           05
                                                                                                                                   3.4.3 Discussion                                                                       86

            1.1 Policy and Governance                                                                  07    04          Migration and Vulnerability                                                                      89
                       1.1.1 Mobility Restrictions and Containment Measures in Response to COVID-19    07
            		                   1.1.1.1 Border Management and Governance                              08                4.1 Emergencies                                                                                  92

            		                   1.1.1.2 Internal Restrictions                                         11                          4.1.1 Vulnerabilities Related to COVID-19                                              92

            		                   1.1.1.3 Discussion                                                    17                		                      4.1.1.1 Health                                                           92

02
                                                                                                                         		                      4.1.1.2 Food Security                                                    94
            Migration Statistics                                                                       21                		                      4.1.1.3 Employment                                                       95
                                                                                                                         		                      4.1.1.4 Social Impact                                                   100
            2.1 Migrant Stock                                                                          23
                                                                                                                         		                      4.1.1.5 Discussion                                                      102
                       2.1.1 Emigration                                                                24
                                                                                                                                   4.1.2 Vulnerabilities Related to Forced Displacement                                  105
                       2.1.2 Immigration                                                               33
                                                                                                                         		                      4.1.2.1 Emergencies and Forced Displacement                             105
                       2.1.3 Discussion                                                                35
                                                                                                                         		                      4.1.2.2 COVID-19, Climate Change and Internally Displaced Persons       110

03          Types of Migration                                                                         39
                                                                                                                         		                      4.1.2.3 Discussion
                                                                                                                         4.2 Trafficking in Persons
                                                                                                                                                                                                                         111
                                                                                                                                                                                                                         115

            3.1 Labour Migration                                                                       41                          4.2.1. Discussion                                                                     121

                       3.1.1 Regional Overview of International Labour Migration                       43                4.3 Migrant Deaths and Disappearances                                                           123

                       3.1.2 Specific Labour Migration Corridors                                       45                          4.3.1 Discussion                                                                      132

                       3.1.3 Discussion                                                                51
            3.2 Forced Migration
                       3.2.1 Refugees, Asylum Seekers and Internally Displaced Persons
                                                                                                       55
                                                                                                       55
                                                                                                            05           Migration and Development                                                                      135

            		                   3.2.1.1 Refugees and Asylum Seekers                                   56                5.1 Remittances                                                                                 137
            		                   3.2.1.2 Internally Displaced Persons                                  59                   5.1.1 Discussion                                                                             145
                       3.2.2 Refugee Resettlement                                                      62
                       3.2.3 Discussion                                                                64
                                                                                                            Conclusion and Recommendations                                                                              149
            3.3 Return Migration                                                                       67
                       3.3.1 Stranded Migrants                                                         68   Annex I: Sustainable Development Goals Indicators with Reference to Migration                               157
                       3.3.2 Voluntary Return                                                          70   Annex II: Global Compact for Safe, Orderly and Regular Migration Objectives                                 158
            		                   3.3.2.1 Assisted Voluntary Return                                     70
                                                                                                            Annex III: Migration Governance Indicators                                                                  159
            		                   3.3.2.2 Voluntary Repatriation                                        73
                       3.3.3 Forced Return                                                             75
                       3.3.4 The Link between COVID-19 and Return Migration                            79
                       3.3.5 Discussion                                                                81

IOM Asia–Pacific Regional Data Hub                                                                          IOM Asia–Pacific Regional Data Hub
ASIA-PACIFIC MIGRATION DATA REPORT 2020 - COVER TBD - ReliefWeb
Asia–Pacific Migration
                                                                                                                                                                                                                                                       Data Report 2020

      LIST OF TABLES
      AND FIGURES

       Tables                                                                                                                          Figure 11                Admission of asylum seekers in Asia–Pacific countries (April–October 2020)

       Table 1                  Labour Mobility Schemes in the Pacific Region                                                          Figure 12                International migration stock between 1990 and mid-2020

       Table 2                  Pacific workers in destination countries by May 2020                                                   Figure 13                Distribution of emigration stock in Asia and the Pacific by subregion by mid-2020

       Table 3                  Largest disaster displacement events in the Asia–Pacific region in 2020                                Figure 14                Percentage change in emigration stock between 2019 and mid-2020 in Asia and the Pacific

       Table 4                  Summary of health-related vulnerabilities                                                              Figure 15                Top 10 countries of origin for migration in Asia and the Pacific by mid-2020

       Table 5                  Income and livelihood related vulnerabilities                                                          Figure 16                Migration flows from the Asia–Pacific region by mid-2020

       Table 6                  Female migrant workers’ vulnerabilities and risks                                                      Figure 17                Gender distribution of the emigrant population in Asia and the Pacific by mid-2020

       Table 7                  Average costs of remitting USD 200 as a share of total transfer sent from Thailand (Q4 2020)           Figure 18                Female emigration and immigration share in Asia and the Pacific by mid-2020

       Table 8                  Sustainable Development Goals indicators with explicit reference to migration                          Figure 19                Distribution of immigration stock in Asia and the Pacific by subregion by mid-2020

       Table 9                  Global Compact for Migration objectives                                                                Figure 20                Percentage change in immigration stock between 2019 and mid-2020 in Asia and the Pacific

       Table 10                 Migration Governance Indicators                                                                        Figure 21                Top 10 countries of destination for migrants in Asia and the Pacific by mid-2020

                                                                                                                                       Figure 22                Gender composition of immigrants in Asia and the Pacific by mid-2020
XII

                                                                                                                                                                                                                                                                             XIII
       Figures                                                                                                                         Figure 23                Percentage of the international migration stock in Asia and the Pacific by age groups by mid-2020

       Figure 1                 Regional Data Hub thematic pillars                                                                     Figure 24                Relative change in outflow of workers by country of origin (2019–2020); (January=100)

       Figure 2                 Mobility restrictions and conditions for authorized entry by type (10 March–29 December 2020)          Figure 25                Relative change in inflow of foreign workers by country/area of destination (2019–2020);
                                                                                                                                                                (January=100)
       Figure 3                 Entry restrictions versus conditions for authorized entry – overview for the Asia–Pacific region       Figure 26                Main refugee populations from the Asia–Pacific region in 2020
                                (March 2020–February 2021)
       Figure 4                 Changes in operational status of PoEs in the Asia–Pacific region (April–December 2020)                 Figure 27                Main destinations of refugees from the Asia–Pacific region in 2020

       Figure 5                 Notable policy updates on movement restrictions in the Asia–Pacific region (April–December 2020)       Figure 28                Main host regions or countries of asylum seekers from Asia and the Pacific in 2020

       Figure 6                 Number and type of restrictions in areas of interest by IOM region (March 2020–January 2021)           Figure 29                Number of asylum applications made by migrants from Asia and the Pacific from 2015 to 2020

       Figure 7                 Government Response Stringency Index in Asia and the Pacific (16 April 2020)                           Figure 30                Stock of conflict-induced IDPs as of December 2020

       Figure 8                 Government Response Stringency Index in Asia and the Pacific (31 December 2020)                        Figure 31                New displacements of IDPs as of December 2020

       Figure 9                 Asia–Pacific countries with the largest relative change in Government Response Stringency Index (16    Figure 32                Top 10 Asia–Pacific countries of departure for IOM-assisted resettlement by sex of resettled
                                April–31 December 2020)                                                                                                         persons (2020)
       Figure 10                Global and regional averages of Government Response Stringency Index, and Asia–Pacific countries       Figure 33                Age distribution of IOM-assisted resettled persons from top 10 Asia–Pacific countries of departure
                                with the most stringent measures as of 31 December 2020                                                                         (2020)
                                                                                                                                       Figure 34                Top 10 destination countries of IOM-assisted resettlement from Asia and the Pacific by sex of
                                                                                                                                                                resettled persons (2020)

      IOM Asia–Pacific Regional Data Hub                                                                                              IOM Asia–Pacific Regional Data Hub
ASIA-PACIFIC MIGRATION DATA REPORT 2020 - COVER TBD - ReliefWeb
LIST OF TABLES AND FIGURES                                                                                                                                                                                                                     Asia–Pacific Migration
                                                                                                                                                                                                                                                        Data Report 2020

       Figure 35                Various types of return migration by location, nature and means of implementation                       Figure 59                Region of exploitation for IOM-assisted human trafficking victims in the Asia–Pacific region (2020);
                                                                                                                                                                 (N=409)
       Figure 36                Number of IOM-assisted voluntary returns hosted in the Asia–Pacific region by type, gender and          Figure 60                Major countries of exploitation for IOM-assisted human trafficking victims in the Asia–Pacific region
                                age (2020)                                                                                                                       (2020); (N=285)
       Figure 37                Top 5 Asia–Pacific host countries of IOM-assisted voluntary returns by type of returnees and            Figure 61                Heat map of reported cases of migrant deaths and disappearances in the Asia–Pacific region (2020)
                                COVID-19 related voluntary return hosted in India by country of origin (2020)
       Figure 38                COVID-19 related returns as a share of all IOM-assisted voluntary returns to Asia–Pacific countries     Figure 62                Number of reported cases of deaths and disappearances in the Asia–Pacific region (2020)
                                (2020); (N=6,440)
       Figure 39                Distribution of COVID-19 related voluntary returns to Asia–Pacific countries by type of returnees       Figure 63                Sex and age composition of all reported cases of migrant deaths and disappearances in the Asia–
                                (2020); (N=309)                                                                                                                  Pacific region (2020)
       Figure 40                Top 5 Asia–Pacific countries of origin of IOM-assisted voluntary returns by type of returnees (2020)    Figure 64                Reported number of incidents related to natural disasters and conflict in Afghanistan by province
                                                                                                                                                                 (2020)
       Figure 41                Intraregional voluntary returns as a share of all IOM-assisted voluntary returns (2020)                 Figure 65                Reported number of fatalities related to natural disasters and conflict in Afghanistan by province
                                                                                                                                                                 (2020)
       Figure 42                Major host countries of intraregional voluntary assisted returns (2020); (N=621)                        Figure 66                Reported number of natural disaster incidents at interviewed host settlements in Afghanistan (2020)

       Figure 43                Country of previous residence prior to voluntary repatriation of registered Afghan refugees (2020);     Figure 67                Reported number of security incidents at interviewed host settlements in Afghanistan (2020)
                                (N=2,147)
       Figure 44                Monthly trends of voluntary repatriation of registered Afghan refugees by country of previous           Figure 68                Estimated changes in global and subregional remittance flows (2019–2020) projected by World Bank
                                residence (2020)                                                                                                                 and ADB
       Figure 45                Enforced returns originating from Asia–Pacific region from 14 European countries (2019 Q1–2020          Figure 69                Remittance inflows to and outflows from the Asia–Pacific region in 2020
                                Q3)
       Figure 46                European host countries of enforced returns originating from Asia–Pacific countries (Q1–Q3 2020);       Figure 70                Top 7 Asia–Pacific countries receiving the largest remittance inflows in 2020
                                (N=8,740)
XIV

                                                                                                                                                                                                                                                                              XV
       Figure 47                Top 5 countries of citizenship of enforced returnees from 14 European countries (2019 Q1–2020           Figure 71                Top 7 Asia–Pacific countries with the largest remittance outflows in 2020
                                Q3)
       Figure 48                Returnees from EU with Asia–Pacific countries as country of citizenship by type of return (2019)        Figure 72                Top 7 Asia–Pacific countries with the highest remittance inflow as a share of GDP in 2020

       Figure 49                Top 6 Asia–Pacific countries of citizenship for enforced return from EU (2019); (N=12,175)              Figure 73                Reported annual remittance inflows in 2020 from Central Banks and percentage changes from 2019

       Figure 50                Cumulative count of recorded inflow of deported Afghans by country or region of departure (Q1–          Figure 74                Annual remittance inflows as percentage of GDP and percentage point difference (2019–2020)
                                Q4 2020)
       Figure 51                Number of respondents and the share of female respondents by country                                    Figure 75                Quarterly remittance inflows in USD millions (Q1–Q4 2020)

       Figure 52                Main reasons for return in relation to COVID-19 (multiple answers possible except for Myanmar)          Figure 76                Relative contribution by quarter to annual remittance inflows in USD millions (Q1–Q4 2020)

       Figure 53                Intention to remigrate as soon as the COVID-19 pandemic or related travel restrictions end among        Figure 77                Average costs of remitting USD 200 as a share of total transfer sent by location of receipt (2018–
                                interviewees                                                                                                                     2020)
       Figure 54                Number of passport checks from Verifier T&B system by result                                            Figure 78                Average costs of remitting USD 200 as a share of total transfer sent, by location of receipt and type
                                                                                                                                                                 of transfer (2020)
       Figure 55                Tier ranking in counter-trafficking efforts in the Asia–Pacific region (April 2019–March 2020)

       Figure 56                Number of IOM-assisted human trafficking victims from and/or exploited in the Asia–Pacific region                 Navigating the report
                                (2020)                                                                                                            In this report, two colors are used to highlight texts with different indications:
       Figure 57                Major countries of origin for IOM-assisted human trafficking victims from the Asia–Pacific region
                                (2020); (N=409)
       Figure 58                Type of exploitation for IOM-assisted human trafficking victims from the Asia–Pacific region (2020);              Reference to SDG, MGI or                         Texts with external link to the source,
                                (N=409)                                                                                                           Global Compact for Migration                     or link to another section in the report

      IOM Asia–Pacific Regional Data Hub                                                                                               IOM Asia–Pacific Regional Data Hub
ASIA-PACIFIC MIGRATION DATA REPORT 2020 - COVER TBD - ReliefWeb
Asia–Pacific Migration
                                                                                                                                                                                                                                                     Data Report 2020

      EXECUTIVE
      SUMMARY                                                                                                                                      MIGRATION STATISTICS

      The Migration Data Report 2020 of the Asia–Pacific Regional          migration trends in 2020 through the lens of the COVID-19
      Data Hub (RDH) presents the latest evidence on migration             crisis and begins with how governments’ responses to the
      dynamics in Asia and the Pacific in 2020. It offers evidence-        pandemic have influenced the evolution of international and        By mid-2020, 83 million people from the Asia–          The male and female population of immigrants in the region
      based insights to better guide the governance of migration,          internal migration.                                                Pacific region were living outside their countries     was roughly balanced, at 50 and 49 per cent respectively. At
      which constitutes an essential step on the road towards the                                                                             of birth, that is, almost 30 per cent of the world’s   the country level, in Nepal, women represented 70 per cent
      Sustainable Development Goals (SDGs). The report focuses             As the origin of more than 83 million and the destination of
                                                                                                                                              international migrant stock.                           of total immigrant population in the country. This trend was
      especially on how the coronavirus disease (COVID-19)                 42 million international migrants, Asia and the Pacific are a
                                                                                                                                                                                                     similar in China and Singapore.
      pandemic affected migration dynamics in the region, allowing         relevant region to the study of global migration trends. This
      to draw implications about the potential role of migrants and        report portrays the situation of migrants in the region in all                                                                              NEPAL
                                                                                                                                              South Asia and South-East Asia constituted the
      migration-related policies in the recovery from the current          its complexity, delving into the analysis of migration trends
                                                                                                                                              principal subregions of origin for emigrants from                                                      49%       51%
      global crisis. The report also highlights the main areas of data     and the main types of migration – major labour migration
                                                                                                                                              the region.
      gaps, shedding light on potential avenues to strengthening           corridors in and outside the region, return migration flows,                                                                    70%
      regional migration data collection.                                  international and internal displacements and irregular                                                                          FEMALES                                   THE REGION
                                                                           migration The current challenges that migrants and displaced
      The COVID-19 pandemic has caused many drastic changes in             populations face (from human trafficking and the dangers
                                                                                                                                                                                                     International immigrants were concentrated in prime working
      our societies. However, only few of these changes have been          of migrant smuggling to health, social and economic risks)
                                                                                                                                                                                                     ages, with 73 per cent (or close to 31 million) aged 20 to 64
      as disruptive and far-reaching as the impact on migration.           are reviewed and discussed, indications for better policy
                                                                                                                                                                                                     years in 2020. However, the Islamic Republic of Iran displayed
      Extensive travel restrictions and stricter border control            responses are also provided. Finally, the report reviews

                                                                                                                                                      44%
                                                                                                                                                                                                     the largest population of migrant children. The country
      policies were among the first responses that governments             how remittances intertwine with the social and economic                                             OF EMIGRANTS          hosted 1.2 million migrant children, that is, 46 per cent of the
      took to slow down the spread of the virus. The profound              development of Asia and the Pacific region, especially in the
                                                                                                                                                                               ARE WOMEN             total immigrant population in the country.
      economic crisis that followed left millions of people in great       context of the COVID-19 pandemic.
      financial and social distress, especially groups that were already                                                                               FROM ASIA AND THE PACIFIC IN 2020
                                                                           While the collection and availability of data on migration in

                                                                                                                                                                                                                                                                           XVII
XVI

      in vulnerable situations – particularly migrants. Difficult or
                                                                           Asia and the Pacific still have many limitations, the accessible

                                                                                                                                                                                                                            39
      lack of access to health care, lack of jobs and economic                                                                                                                     THAILAND
      security, and the impact of strict national lockdowns are            information allows us to investigate many relevant aspects                                              61%                                                    MILLION
      all consequences of the pandemic to which migrants are               of the issues at the core of this study. Below are the main
                                                                           findings of this report:                                           FEMALE EMIGRATION
                                                                                                                                                                                   MALAYSIA
                                                                                                                                                                                   57%
                                                                                                                                                                                                       42%                                EMIGRANTS
      especially vulnerable. For this reason, this report analyses
                                                                                                                                              WAS CONSIDERABLY                     LAO’S PEOPLE
                                                                                                                                              HIGHER IN SOME                       DEMOCRATIC
                                                                                                                                              COUNTRIES:                           REPUBLIC          OF ALL EMIGRANTS MOVED TO OTHER
                                                                                                                                                                                   56%               COUNTRIES IN THE REGION
          MOBILITY RESTRICTIONS IN RESPONSES TO COVID-19
                                                                                                                                              Women constituted nearly 44 per cent of
                                                                                                                                              emigrants from Asia and the Pacific in 2020.
                                                                                                                                              However, female migration was considerably
                                                                                                                                              higher in some countries including Thailand (61%),

                                                                       29/40                                       15/32                      Malaysia (57%) and Lao’s People Democratic
                                                                                                                                              Republic (56%).
                                                                            COUNTRIES                                    COUNTRIES
                                                                                                                                              The region hosted 42.6 million immigrants from all
                                                                                                                                              around the world, representing 15 per cent of the      82%        OF THE FOREIGN-BORN POPULATIONS
                                                                                                                                                                                                                CAME FROM WITHIN THE REGION.
      By the end of 2020, the Asia–Pacific          Internal movement restrictions were          The region also showed a high level          global international migrant stock.
      region was among the top three regions        observed in 29 out of 40 countries,          of stringency regarding mobility                                                                    The bulk of migration was intraregional. Almost 39 million
      in the world with the highest number          territories and areas from the Asia–         restrictions. By the end of December                                                                emigrants from Asia–Pacific countries moved to other
      of entry restrictions. From April to          Pacific region.                              2020, 15 out of 32 countries and areas                                                              countries in the region (42% of all emigrants from the region)
                                                                                                                                              South-East Asia hosted the largest stock of
      December 2020, the number of fully                                                         assessed in the Asia–Pacific region                                                                 while 82 per cent of the foreign-born populations came from
                                                                                                                                              immigrants followed by the Pacific and East Asia.
      closed Points of Entry assessed with                                                       scored higher than the global average                                                               within the region.
      known operational status in the region                                                     in terms of government response
      decreased from 43 to 19 per cent.                                                          stringency.

      IOM Asia–Pacific Regional Data Hub                                                                                                      IOM Asia–Pacific Regional Data Hub
ASIA-PACIFIC MIGRATION DATA REPORT 2020 - COVER TBD - ReliefWeb
EXECUTIVE SUMMARY                                                                                                                                                                                                                       Asia–Pacific Migration
                                                                                                                                                                                                                                                   Data Report 2020

                                                                                                                                      FORCED MIGRATION
            TYPES OF MIGRATION
                                                                                                                                      By the end of 2020 about 4.7 million refugees and 742,469      Regarding internal displacement, disasters accounted for the
                                                                                                                                      asylums seekers from countries in the Asia–Pacific region      major cause of new displacement in the region by the end
        LABOUR MIGRATION                                                                                                              were forcibly displaced. The majority (75%) were hosted        of 2020. The Asia–Pacific region reached 21.3 million new
                                                                                                                                      within the region.                                             disaster-induced displacements.

        Available data on labour migration flows suggested the       Countries from the Greater Mekong Subregion (GMS)
                                                                                                                                                                                                                    THE ASIA–PACIFIC REGION REACHED
        contraction of prominent labour migration corridors in the   showed a decline in labour migration outflows and inflows.                         4.7 MILLION            742,469
                                                                                                                                                        REFUGEES               ASYLUMS SEEKERS                     21.3 MILLION
        Asia–Pacific region.                                         By December 2020, Thailand, a main regional migration hub

                                                                                                                                                                               75%
                                                                     within the GMS, observed a decline of 18 per cent in the                                                                                       NEW DISASTER-INDUCED DISPLACEMENTS
                                                                     number of registered migrant workers coming mainly from
                                                                                                                                           HOSTED WITHIN THE REGION
                                                                     Myanmar, Cambodia, Lao People’s Democratic Republic and
                                                                     Viet Nam.                                                                                                                       Cyclone Amphan, the largest natural hazard in the region in
                                                                                                                                      Around 55 per cent of refugees and 32 per cent of asylum       2020, triggered around 5 million new displacements.
                                                                                                                                      seekers came from Afghanistan. This makes Afghanistan
                                                                     A clear reduction in the number of inflows of foreign workers    the country with the highest number of cross-border
                                                                     was observed in Gulf Cooperation Council countries,              displacements due to conflict and violence.                    In 2020, international resettlement programmes around the
                                                                     particularly the Kingdom of Saudi Arabia, a major host                                                                          world faced interruptions due to the COVID-19 pandemic.
                                                                     country of migrant workers, from South Asia in particular.                                                                      Despite the difficulties in achieving durable solutions, the
                                                                     The number of visas issued by Saudi Arabia in the second         Pakistan, Bangladesh and the Islamic Republic of Iran were     International Organization for Migration (IOM) supported
                                                                     half of 2020 dropped by 91 per cent compared to the same         the main countries of asylum for refugees from the region.     the resettlement of 11,963 individuals from 17 Asia–Pacific
                                                                     period in 2019.                                                  On the other hand, Turkey and the Unites States of America     countries. Over half of these beneficiaries resettled in the
                                                                                                                                      received 41 per cent of asylum seekers from the region.        United States of America, followed by Canada, Australia and
                                                                                                                                                                                                     Sweden.
                                                                     Labour migration schemes in Australia and New Zealand
                                                                     supported the deployment of almost 3,500 migrant workers
                                                                     in 2020 from several Pacific countries particularly from Fiji,

                                                                                                                                                                                                                                                                         XIX
XVIII

                                                                     Tonga, Tuvalu and Vanuatu.
                                                                                                                                      RETURN MIGRATION

                                                                                                                                      One of the most direct effects of the COVID-19 pandemic        IOM assisted a total of 1,217 voluntary returnees hosted
                                                                                                                                      on international migration was the unprecedented scale of      in or returned from 22 Asia–Pacific countries. One third of
                                                                         TONGA                        TUVALU
                                                                                                                                      and challenges to return migration.                            the beneficiaries were female. Most cases were hosted in
                                                     FIJI
                                                                                                                                                                                                     Australia, India and Indonesia. On the other hand, a total of
                                                                                                             VANUATU
                                                                                                                                                                                                     6,440 voluntary assisted returnees originating from 21 Asia–
                                                                            3,500                                                     As of 13 July 2020, 976,869 migrants from around the world     Pacific countries returned to their countries from abroad.
                                                                     MIGRANT WORKERS                                                  were recorded to be stranded within the Asia–Pacific region.   Bangladesh, Pakistan and Afghanistan were the three major
                                                                         DEPLOYED                                                                                                                    origin countries of these assisted voluntary returnees in the
                                                                                                                                                                                                     region.

                                                                                                                                                976,869
                                                                                                                                                MIGRANTS                                             Regarding voluntary repatriation, 2,147 registered Afghan
                                                                                                                                                STRANDED FROM
                                                                     THROUGH LABOUR                                                             AROUND THE WORLD                                     refugees, mostly residing in Pakistan and the Islamic
                                                                     MIGRATION SCHEMES                                                                                                               Republic of Iran, were recorded by the United Nations High
                                             AUSTRALIA
                                                                                                                                                                                                     Commissioner for Refugees (UNHCR) to be voluntarily
                                                                                                                                                                       THE ASIA–PACIFIC REGION
                                                                                                                                                                                                     repatriated between January and December 2020.
                                                                                                NEW ZEALAND

                                                                                                                                      Assessments conducted in Bangladesh, Cambodia,                 A total of 8,740 migrants from Asia–Pacific countries were
                                                                                                                                      Lao People’s Democratic Republic, Myanmar and the              forcibly returned from 14 European countries between
                                                                                                                                      Philippines in 2020 revealed that most return migrants         January and September 2020. Most of these returnees came
                                                                                                                                      interviewed attributed their return either directly or         from Pakistan and Afghanistan, collectively accounting for
                                                                                                                                      indirectly to the COVID-19 pandemic.                           more than 60 per cent of all such cases.

        IOM Asia–Pacific Regional Data Hub                                                                                            IOM Asia–Pacific Regional Data Hub
EXECUTIVE SUMMARY                                                                                                                                                                                                                                Asia–Pacific Migration
                                                                                                                                                                                                                                                         Data Report 2020

     IRREGULAR MIGRATION                                                                                                                TRAFFICKING IN PERSONS                                            MIGRANT DEATHS AND DISAPPEARANCES

     Data collected from the IOM Document Examination                  Migrants in Afghanistan, India, Indonesia and Malaysia report    Out of 38 Asia–Pacific countries, territories and areas           The IOM Missing Migrants Project observed a decrease in
     Support Center (DESC) Initiative show a dramatic decrease         that smuggling routes have moved to more dangerous areas         assessed against government efforts in counter trafficking,       the recorded cases of migrant deaths and disappearances by
     in the number of secondary inspections of passport travel         in response to border closures and increased controls.           the United States Department of State ranked nearly 70 per        21 per cent between 2019 and 2020, which is likely related
     documents in 18 Asia–Pacific countries between 2019 and                                                                            cent under Tier 2 or Tier 2 watch list.                           to the impact of the COVID-19 pandemic on data collection
     2020. However, the share of observed frauds among total                                                                                                                                              and availability, and the ability to monitor specific migration
     inspections remained approximately constant around 10 per         As migrants’ need for smuggling services increased, so did                                                                         routes.
     cent.                                                                                                                                                  38 ASIA–PACIFIC COUNTRIES,
                                                                       their dependency on smugglers. Interviewed migrants                                  TERRITORIES AND AREAS
                                                                       reported that smugglers are amongst the groups most likely                           ASSESSED AGAINST GOVERNMENT
                                                                       to commit violent acts against migrants.                                             EFFORTS IN COUNTER TRAFFICKING,               Eighty-five per cent of recorded cases of migrant deaths and
     Over 40 per cent of interviewed Afghan refugees and
                                                                                                                                                        70%
                                                                                                                                                                                                          disappearances in the Asia–Pacific region occurred in the
                                                                                                                                                                              UNDER TIER 2 OR
     returnees reported that demand for smugglers during                                                                                                                     TIER 2 WATCH LIST.           South-East Asia subregion; Rohingya refugees were the main
     the pandemic increased in Afghanistan. Migrants in India,                                                                                                                                            group of victims in South-East Asia (84%).
     Indonesia and Malaysia, however, did not report the same.
                                                                                                                                        A total of 793 IOM-assisted cases of human trafficking victims
                                                                                                                                        originating from or exploited in the Asia–Pacific region were
                                                                                                                                        recorded. Men represented slightly more than half of the
         MIGRATION AND VULNERABILITIES                                                                                                  cases.

     VULNERABILITIES RELATED TO COVID-19 AND FORCED DISPLACEMENT                                                                        Around 86 per cent of these IOM-assisted victims of human
                                                                                                                                        trafficking came from Bangladesh, Indonesia, Myanmar, the
                                                                                                                                                                                                                                                          85%
                                                                                                                                        Philippines and Sri Lanka; the main type of exploitation was                                     OF MIGRANT DEATHS OR
     Available data on migrants’ experiences during COVID-19 has       Migrants have been exposed to negative views and xenophobic                                                                                                       DISAPPEARANCES OCCURED
                                                                                                                                        forced labour.
     revealed a concerning scenario regarding migrant’s inability to   attitudes since the COVID-19 outbreak. Unfounded public                                                                                                           IN THE SOUTH-EAST ASIA
                                                                                                                                                                                                                                         SUBREGION
     access adequate health care in destination countries.             perceptions and misinformation about migrants being carriers                                                       BANGLADESH
                                                                       of the virus have disseminated across the region.
                                                                                                                                                                                          INDONESIA
XX

                                                                                                                                                                                                                                                                               XXI
     Overcrowded and unsanitary living conditions have put migrants                                                                                                                       MYANMAR
     from the Asia–Pacific at a heightened risk of contracting                                                                                                                            PHILIPPINES
     COVID-19.
                                                                                                                                                                                          SRI LANKA
                                                                        UNFOUNDED PUBLIC
                                                                        PERCEPTIONS AND
                                      RISK OF COVID-19 SPREAD           MISINFORMATION ABOUT
                                      IN OVERCROWDED LIVING             MIGRANTS CARRYING                                                                                                                 As for cases in the South Asia subregion, 38 per cent were
                                      CONDITIONS                        COVID-19                                                                                                                          reported deaths at the Iran-Afghanistan border.

                                                                                                                                             86%
                                                                                                                                                                OF HUMAN
     COVID-19 has reduced migrants’ capacity to afford and             Forcibly displaced populations – particularly Afghan refugees
                                                                                                                                                                TRAFFICKING
     access food supplies.                                             and Rohingya refugees in Cox Bazar – have also faced                                     VICTIMS
                                                                       challenges when accessing health care in 2020. Lack of
                                                                                                                                               MAINLY FORCED LABOUR
     Containment measures and the global economic recession            health insurance coverage, inadequate infrastructure and                    EXPLOITATION
     have affected migrant workers livelihoods and well-being in       reluctance to attend medical centres due to cultural beliefs
     destination countries.                                            and misconceptions are some of the identified barriers.

                                                                                                                                        While 65 per cent of minors who were identified victims from
                                                                                                                                        the region were exploited for the purpose of forced labour,
     National lockdowns triggered the mass exodus of thousands         COVID-19 mobility restrictions complicated the delivery of       slightly below one-fifth were so for sexual exploitation.
     of internal migrants from urban centres to home villages.         aid to internally displaced persons (IDPs) affected by several
                                                                       disasters that occurred in some Asia–Pacific subregions,         Concerning the place of exploitation of IOM-assisted human
                                                                       including the Pacific and South Asia.                            trafficking victims originating from Asia–Pacific countries, 66
     Available data suggest that migrant workers from the Asia–                                                                         per cent were exploited within the region, whereas 29 per
     Pacific region faced exploitative working conditions and were                                                                      cent were exploited in Middle East and North Africa.
     unable to refuse to work, coerced and threatened with
     dismissal or violence by their employers.

     IOM Asia–Pacific Regional Data Hub                                                                                                 IOM Asia–Pacific Regional Data Hub
EXECUTIVE SUMMARY

           MIGRATION AND DEVELOPMENT

       REMITTANCES

       World Bank data suggested that the volume of remittance
       inflows to the Asia–Pacific region decreased by 1.1 per cent
       from 302,273 million United States dollars (USD) in 2019
       to USD 298,928 million in 2020. The volume of remittance
       outflows from the region decreased by 12.3 per cent from
       USD 82,102 million in 2019 to USD 71,980 million in 2020.

       Resilience in remittance flows shows in the
       fact that 17 out of 32 Asia–Pacific countries
       experienced growth in remittance inflows in
       2020 from the previous year.

         17/32 COUNTRIES
         EXPERIENCED GROWTH IN              20
         REMITTANCE INFLOW                    20
xxii

       Data collected from 12 Central Banks of Asia–Pacific
       countries further revealed an increase either in the absolute
       amount of remittance inflows or in the amount of remittance
       inflows as a share of gross domestic product (GDP).

       Comparing the remittance costs in the fourth quarter of 2019
       and 2020, there was a common downward trend worldwide
       and at the subregional level of Asia and the Pacific. However,
       gap remains from SDG Target 10.c that the remittance cost
       should stand at less than 3 per cent of the total amount of
       transfer.

                                                                        IOM staff members travel by boat between islands on the Carteret Islands, Papua New Guinea | © IOM 2016/Muse MOHAMMED

       IOM Asia–Pacific Regional Data Hub
Asia–Pacific Migration
                                                                                                                                                                                                                                                                 Data Report 2020

    INTRODUCTION

    International migration is a fundamental component of            In a time of dramatic social and economic changes as those          Target 17.18 of the SDG calling for increasing the availability     To achieve these objectives, this report gathers 2020 data
    social dynamics in Asia and the Pacific. Out of the 282          we experienced since 2020, few social phenomena have been           of “high-quality, timely and reliable data disaggregated by         from diverse sources, including publicly available global and
    million international migrants in the world, about one in        as deeply affected by the COVID-19 pandemic as migration.           income, gender, age, race, ethnicity and migratory status”. In      regional data identified in the RDH Regional Secondary
    three comes from the region and one in seven lives there         As almost every country in the world introduced new and             this spirit, the Asia–Pacific RDH seeks to understand how           Data Review, national data, IOM data, as well as media
    (UN DESA, 2020). In 2020, Asia and the Pacific received 42       often strict travel and mobility restrictions, the current          the COVID-19 pandemic has altered the migration landscape           reporting. Data availability is the prerequisite of thematic
    per cent of global remittances (World Bank, 2021), which         economic crisis has put millions of people in a situation of        in the region in 2020, to identify lessons learnt and ways          coverage in this report. In subthemes where data are
    in many countries represent a significant share of families’     financial vulnerability and distress – especially individuals who   forward, especially towards building stronger migration             sufficient, additional regional, subregional and/or national
    livelihoods. Millions of refugees and asylum seekers come        were already marginalized. For these and many other reasons,        governance, facilitating orderly, safe, and responsible migration   analyses are presented. In addition, the report focuses on
    from this region, which in the last years has also witnessed     migrants’ livelihoods and prospects have been greatly affected      and optimizing the impact of migration on development. The          the influences of the COVID-19 pandemic on mobilities and
    an unprecedented number of individuals forcibly displaced        by the social and economic turmoil COVID-19 has caused.             SDGs, the Global Compact for Migration and the Migration            vulnerabilities, wherein the interlinkages between COVID-19
    by disasters and conflicts. This report explores the complex                                                                         Governance Indicators (MGI) are seen in this report as the          and migration were particularly apparent. The interlinkages
    and multifaceted aspects of migration in Asia and the Pacific    To date, estimates concerning the COVID-19 impact on global         main benchmarks for international, regional and national            between various migration themes will also be highlighted in
    to provide evidence and guidance to improve the social           development, especially on migration in Asia and the Pacific        development. The main objectives of the Asia–Pacific RDH            the discussion of each theme by cross-referencing to other
    conditions of people living in the region and to highlight the   region, have often relied on assumptions and forecasting,           Migration Data Report 2020 are threefold:                           relevant subsections in the report.
    main areas where updated relevant information on migration       while data availability has only recently begun to catch up.
                                                                                                                                         1.    To consolidate available international, regional and
    trends is still missing or needs improvement.                    Migration data quality and comprehensiveness, however,                                                                                  The structure of this report is built upon the RDH thematic
                                                                                                                                               national data and identify migration dynamics in the
                                                                     is still limited because the pandemic has exacerbated pre-                                                                              pillars (Figure 1): (1) Migration Statistics, (2) Types of Migration,
                                                                                                                                               region in 2020, especially in the context of the COVID-19
1

                                                                                                                                                                                                                                                                                       2
    By the end of 2020, there have been 82,659,128 confirmed         existing challenges to migration data collection and hindered             pandemic.                                                     (3) Migration Policy, (4) Migration and Vulnerabilities, and
    cases of COVID-19, including 1,871,783 deaths, reported by       many related activities (IOM Migration Data Portal, 2021;                                                                               (5) Migration and Development. The report will begin with
    the World Health Organization (WHO) (2021). Eighteen per         World Bank, 2020b). The limited statistical information             2.    To monitor the region’s progress towards achieving the        outlining the migration policy landscape as influenced by
                                                                                                                                               SDGs and the objectives of the Global Compact for
    cent of confirmed cases and 15 per cent of deaths worldwide      available is a challenge to the understanding of regional                                                                               COVID-19, which shapes the context for the development
                                                                                                                                               Migration and MGI.
    occurred in Asia and the Pacific region. WHO declared            migration dynamics in 2020, which also needs to consider the                                                                            of all other migration dynamics. Under each thematic pillar,
    COVID-19 global pandemic on 11 March 2020, which                 interconnectedness between various themes of migration,             3.    To provide policy recommendations on RDH migration            sub-themes with adequate data availability will be presented,
    had repercussions at an unforeseen and unprecedented             and the potential heterogeneity of the effects of COVID-19                themes.                                                       concluding with discussions and recommendations. All data
    magnitude. COVID-19 is no longer only regarded as a              across the region. These consequences are subject to a                                                                                  and discussions presented in this report were updated as of
    public health emergency but as a multifaceted crisis, with       multitude of national and local variations such as infection                                                                            21 June 2021.
    complex political, social, economic, and other implications.     levels, government responses and pre-crisis conditions.
                                                                                                                                         FIGURE 1:
    The ongoing pandemic triggered what is thought to be the                                                                             RDH THEMATIC PILLARS
    most severe global recession since the end of World War II       The planning, formulation and adaptation of effective policy
    (World Bank, 2020a) and reversed decades of progress on          responses to recent developments in regional migration
    poverty, healthcare and education (United Nations, 2020a).       dynamics requires a reliable, nuanced and harmonized
    The consequences of such economic and social rupture have        evidence base that is in line with the emphases of Objective
    been severe across the Asia–Pacific region (ADB, 2020),          1 of the Global Compact for Safe, Orderly and Regular
    which was not on track to achieve the 17 SDGs even before        Migration calling for collection and utilization of accurate and
    the crisis (UN ESCAP, 2021).                                     disaggregated data as a basis for evidence-based policies and
                                                                                                                                              MIGRATION                        TYPES OF              MIGRATION                MIGRATION AND                 MIGRATION AND
                                                                                                                                              STATISTICS                      MIGRATION                POLICY                 VULNERABILITY                  DEVELOPMENT

    IOM Asia–Pacific Regional Data Hub                                                                                                   IOM Asia–Pacific Regional Data Hub
INTRODUCTION                                                                                                                                                                              Asia–Pacific Migration
                                                                                                                                                                                                 Data Report 2020

     REFERENCES

    Asian Development Bank (ADB)

    2020        Asian Development Outlook 2020 – Online presentation. ADB, Manila.

    2021        Asian Economic Integration Report 2021: Making Digital Platforms Work.
                ADB, Manila

    IOM Migration Data Portal

    2021        Are migrants left behind? How COVID-19 hinders better migration data.

    United Nations (UN)

    2020a       The Sustainable Development Goals Report 2020. UN, New York.

    2020b       UN Research Roadmap for the COVID-19 Recovery: Leveraging the Power of
                Science for a More Equitable, Resilient and Sustainable Future. UN, New York.

    United Nations Economic and Social Commission for Asia and the Pacific
    (UN ESCAP)
    2021        Asia and the Pacific SDG Progress Report 2021. UN ESCAP, Bangkok.

    United Nations Economic and Social Council (ECOSOC)

    2021        ECOSOC’s response to COVID-19. ECOSOC.
3

    United Nations Department of Economic and Social Affairs
    (UN DESA), Population Division

    2020        International Migration Stock 2020. UN DESA, Population Division, New York.
                (accessed 1 March 2021).

    World Bank

    2020a       Global Economic Prospects, June 2020. World Bank, Washington D.C.

    2020b       Survey of National Statistical Offices (NSOs) during COVID-19.
                Brief, World Bank.

    2021        Annual Remittances Data (accessed 15 June 2021).

    World Health Organization (WHO)

    2021        WHO Coronavirus (COVID-19) Dashboard (accessed 21 June 2021). WHO.

                                                                                                                                     A woman walks past her makeshift shelter situated on an embankment in one of the
                                                                                                                                          Cyclone Aila hit areas in Dacope, Bangladesh | © IOM 2010/ Abir ABDULLAH
    IOM Asia–Pacific Regional Data Hub                                                          IOM Asia–Pacific Regional Data Hub
01
MIGRATION
POLICY
            A woman crosses a river during the dry season in Udayapur, Nepal, one of the regions in the country vulnerable to
                                                              the impacts of climate change | © IOM 2016/Amanda NERO
01
    01: MIGRATION POLICY

    1.1
                                  MIGRATION
                                  POLICY
                                                                                                                                                                                                                                                                                     Asia–Pacific Migration
                                                                                                                                                                                                                                                                                        Data Report 2020

    POLICY AND GOVERNANCE

      SDG                                         Global Compact for Migration                   MGI
      Target                                      Objectives                                     Dimensions

      10.7                                        5 and 11                                       3 and 6
      Facilitate orderly, safe, regular and       Enhance availability and flexibility of        Partnerships
      responsible migration and mobility          pathways for regular migration
      of people, including through the
                                                                                                 Safe, orderly and dignified migration
      implementation of planned and well-         Manage borders in an integrated, secure
      managed migration policies.                 and coordinated manner
                                                                                                                                                                                                         Children and their parents are the sole family living on the tiny island of Huene, Papua New Guinea.
7

                                                                                                                                                                                                                                                                                                                8
                                                                                                                                                                                Originally linked to a nearby island, the island has been slowly shrinking over the years | © IOM 2016/Muse MOHAMMED

    1.1.1
    Mobility Restrictions and Containment
    Measures in Response to COVID-19                                                                                                       1.1.1.1 BORDER MANAGEMENT AND
                                                                                                                                           GOVERNANCE

                                                                                                                                           As of 29 December 2020, a total of 110,324 movement                             imposed has sharply reduced since their peak level – from
    The escalation of containment measures in response to                 mobility restriction measures in different parts of the world.
                                                                                                                                           restrictions, including entry restrictions , conditions for
                                                                                                                                                                                             3                             almost 100 per cent at the peak periods to below 10 per
    the pandemic has affected international mobilities as well            These policies set the context for migration dynamics by
                                                                                                                                           authorized entry, and other restrictions were imposed in
                                                                                                                                                               4                                                           cent towards the end of the year in Central and North
    as internal movements within national borders. As of 31               directly affecting various forms of migration and mobilities
                                                                                                                                           227 countries, territories and areas around the world (Figure                   America, the Caribbean, and Central and West Africa (ibid.).
    March 2020, at least 91 per cent of the global population             (Section 3) as well as interacting with conditions in the
                                                                                                                                           2). About 25 per cent involved total entry restrictions for                     In Asia and the Pacific region, even after the peak in April,
    were living in countries with international travel restrictions,      countries of destination and origin – ultimately enhancing,
                                                                                                                                           passengers of a given country, territory or area, including                     the imposition of entry restrictions has remained a core
    and 39 per cent in countries with complete border closures            mitigating or reducing the effects of migration on development
                                                                                                                                           complete border closure, nationality bans, suspension of                        component of pandemic control measures (Figure 3). By the
    (Pew Research Center, 2020). According to 4mi data of the             (Section 4 and Section 5). Considering the complexities and
                                                                                                                                           visa issuance, and suspension of flights (IOM, 2021a). Over                     end of 2020, the Asia–Pacific region was among the top three
    Mixed Migration Centre (2021a), nearly 15 per cent out                influences of these migration policies, border management in
                                                                                                                                           time, the imposition of entry restrictions has seen a general                   regions in the world with the highest number of imposed
    of 1,655 migrants interviewed in Asia from April through              an integrated, secure and coordinated manner, as called for
                                                                                                                                           downward trend worldwide, though to a lesser extent in Asia                     entry restrictions alongside the European Economic Area
    December 2020 reported facing increased difficulty to cross           in Objective 11 of the Global Compact for Migration, and
                                                                                                                                           and the Pacific region. In other regions of the world, entry                    and South-Eastern Europe, Eastern Europe and Central Asia.
    borders and about 29 per cent indicated that mobility within          facilitating orderly, safe, regular, and responsible migration
                                                                                                                                           restrictions as a share of all types of movement restrictions
    countries was affected.                                               and mobility of people including through implementation of
                                                                          planned and well-managed migration policies, as called for in
                                                                                                                                           3. Entry restrictions refer to “total restrictions which do not allow the entry of passengers of a given country, territory, or area (C/T/A).
    The policy landscape rapidly evolved with changes in local            SDG Target 10.7, has emerged as an issue of unprecedented           These include a complete border closure, nationality ban, suspension of visa issuances, and suspension of flights, etc.” (IOM, 2021).
    epidemic situations, leading to different policies concerning         urgency.                                                         4. Conditions for authorized entry refer to “partial restrictions in the form of specific requirements upon which entry is incumbent.
                                                                                                                                              These conditions include medical measures, new requirements on visa/travel documents or other specific requirements for entry. Partial
                                                                                                                                              restrictions may be applicable to all passengers or exempt groups such as specific nationalities or immigration status.” (IOM, 2021).

    IOM Asia–Pacific Regional Data Hub                                                                                                     IOM Asia–Pacific Regional Data Hub
01: MIGRATION POLICY                                                                                                                                                                                                                                                                                                                                    Asia–Pacific Migration
                                                                                                                                                                                                                                                                                                                                                                Data Report 2020

     FIGURE 2:                                                                                                                                                                                                           FIGURE 4:
     MOBILITY RESTRICTIONS AND CONDITIONS FOR AUTHORIZED ENTRY WORLDWIDE (10 MARCH–29 DECEMBER 2020)                                                                                                                     CHANGES IN OPERATIONAL STATUS OF POES IN THE ASIA–PACIFIC REGION (APRIL–DECEMBER 2020)

                             80,000

                                                                                                                                                                                                                         665
                                                                                                                                                                                                                                                                                                  Apr 38%
                             70,000

                             60,000                                                                                                                                                                                                                                                               May 51%
    Number of restrictions

                             50,000                                                                                                                                                                                      UNIQUE POINTS OF ENTRY MAPPED                                            Jun   51%

                             40,000                                                                                                                                                                                                                                                               Jul   51%

                             30,000                                                                                                                                                                                                                                                               Aug 53%

                             20,000                                                                                                                                                                                                                                                               Sep   53%

                             10,000                                                                                                                                                                                         241                        177                        247             Oct 52%
                                                                                                                                                                                                                            AIRPORTS                  LAND BORDERS                BLUE BORDERS
                                0                                                                                                                                                                                                                                                                 Nov 50%

                                                                                                                                                                                                                                                                                                                                                                              38%
                                      10 Mar

                                                          10 Apr

                                                                         10 May

                                                                                         10 Jun

                                                                                                           10 Jul

                                                                                                                             10 Aug

                                                                                                                                               10 Sep

                                                                                                                                                                   10 Oct

                                                                                                                                                                                     10 Nov

                                                                                                                                                                                                       10 Dec
                                                                                                                                                                                                                                                                                                  Dec 40%

                                                                                                                                                                                                                          4,000
                                                  Entry Restrctions               Medical Measures                   Other Conditions                            Other Restrictions
                                                                                                                                                                                                                          3,000                                                                    Operational

                                                                                                                                                                                                                                                                                                                        14%
                                          Note: As changes in the restrictions were monitored on biweekly and weekly intervals, and the dynamics of the measures was at times changing
                                                                                                                                                                                                                          2,000                                                                    Status of
                                          more frequently, the graph cannot be indicative of the exact date of change in travel restriction policies, as stated in Methodology Note.

                                                                                                                                                                                                                                                                                                                              20%

                                                                                                                                                                                                                                                                                                                                                              29%
                                                                                                                                                                                                                                                                                                   Assessed PoEs

                                                                                                                                                                                                                                                                                                                                                                    29%

                                                                                                                                                                                                                                                                                                                                                                           31%
                                                                                                                                                                                                                                                                                                                    20%

                                                                                                                                                                                                                                                                                                                                      20%

                                                                                                                                                                                                                                                                                                                                                 20%
                                                                                                                                                                                                                          1,000

                                                                                                                                                                                                                                                                                                                                                       22%
                                          Source: Compiled from IOM DTM COVID-19 Travel Restrictions Monitoring Database (2021b).

                                                                                                                                                                                                                              0
                                                                                                                                                                                                                                  Apr   May     Jun    Jul    Aug     Sep   Oct     Nov   Dec
                                                                                                                                                                                                                                                                                                        27%

                                                                                                                                                                                                                                                                                                                        %
                                                                                                                                                                                                                                                                                                                    20
     FIGURE 3:
     ENTRY RESTRICTIONS VERSUS CONDITIONS FOR AUTHORIZED ENTRY – OVERVIEW FOR THE ASIA–PACIFIC REGION                                                                                                                        Number of PoE status changes monitored

                                                                                                                                                                                                                                                                                                                              %
                                                                                                                                                                                                                                                                                                                          14
                                                                                                                                                                                                                                                                                                        10%
     (MARCH–DECEMBER 2020)                                                                                                                                                                                                   Number of PoEs monitored

                                                                                                                                                                                                                                                                                                                                  %
9

                                                                                                                                                                                                                                                                                                                                                                                      10
                                                                                                                                                                                                                                                                                                                               13
                                                                                                                                                                                                                                                                                                        14%
    100

                                                                                                                                                                                                                                                                                                                                      %
                                                                                                                                                                                                                                                                                                                                    15
                                                                                                                                                                                                                                                                                                        14%
                                                                                                                                                                                                                                                                                                                                          %
                                                                                                                                                                                                                                                                                                                                      12
                                                                                                                                                                                                                                                                                                        10%
                                                                                                                                                                                                                                                                                                                                              %
                                                                                                                                                                                                                                                                                                                                            11
              50                                                                                                                                                                                                                                                                                        9%

                                                                                                                                                                                                                                                                                                                                                             %
                                                                                                                                                                                                                                                                                                                                                             11
                                                                                                                                                                                                                                                                                                                                                   %
                                                                                                                                                                                                                                                                                                                                                 11
                                                                                                                                                                                                                            Note: For more information about how the database was constructed,          9%
                                                                                                                                                                                                                            please refer to Methodology Note.
                                                                                                                                                                                                                                                                                                        1%         6%
                                                                                                                                                                                                                            Source: Compiled from IOM Points of Entry Global Reference Database
                       0
                                                                                                                                                                                                                            (2021c).
                                                                                                                                                                                              Nov 23

                                                                                                                                                                                                                Dec 21
                                                                      May 07
                                      Mar 10

                                                                                                                    Aug 03

                                                                                                                                                                            Oct 26
                                                         Apr 08

                                                                                                                                      Sep 01

                                                                                                                                                        Sep 28
                                                                                    Jun 04

                                                                                                  Jul 02

                                                                                                                                                                                                                                                                                                        12%

                                               Entry Restrictions     Entry Conditions
                                       Source: Compiled from IOM COVID-19 Travel Restrictions Output — 22 February 2021 (2021a).

     Three out of the top six countries, territories or areas in the                                                 In addition to movement restriction policies, national border                                       the region with the third highest numbers of PoE closures                with the partial resumption of international travel in some
     world issuing the highest number of additional requirements                                                     management policies can be assessed from the operational                                            worldwide (IOM, 2020) – only 13 per cent of 428 assessed                 countries, despite a growing number of new COVID-19
     for authorized entry were from the Asia–Pacific region                                                          statuses and restrictions at Points of Entry (PoE) which include                                    PoEs with known operational status were fully operational                cases from April onwards and continued presence of entry
     – Singapore (53), the Philippines (44), and Hong Kong                                                           airports, blue border crossing points on sea, river or lake, and                                    and 43 per cent were fully closed (IOM, 2021c).                          restrictions and conditions in the region. Figure 5 shows
     Special Administrative Region (SAR), China (32) (ibid.). The                                                    land border crossing points including rail. This information                                                                                                                 some of the notable policy updates on mobility restrictions
     most common additional conditions for authorized entry                                                          is available in the IOM Points of Entry Global Reference                                            However, by November 2020, only 22 per cent of 527 assessed              during different stages of the pandemic.
     were quarantine, health declaration forms and medical                                                           Database which collects data at various types of PoEs. From                                         PoEs with known operational status were fully closed. As
     certificates of negative COVID-19 test results. Asia and                                                        April through December 2020, a total of 666 PoEs in Asia                                            well, 78 per cent of assessed PoEs were either partially (55%)
     the Pacific adopted some of the world’s tightest movement                                                       and the Pacific region were assessed (IOM, 2021c). Figure 4                                         or fully operational (22%) (ibid.). Despite a rise in the number
     restrictions in response to the pandemic, considering both                                                      illustrates the high level of mobility restrictions at the onset                                    of PoEs with unknown operational status in December, a
     their prevalence and intensity.                                                                                 of the pandemic in the Asia–Pacific region, which was then                                          consistent pattern was observed. These changes were in line

     IOM Asia–Pacific Regional Data Hub                                                                                                                                                                                  IOM Asia–Pacific Regional Data Hub
You can also read