ASCENDAS REIT Morgan Stanley Virtual Hong Kong Summit 29 - 30 March 2021
←
→
Page content transcription
If your browser does not render page correctly, please read the page content below
ASCENDAS REIT
Morgan Stanley Virtual Hong Kong Summit
29 – 30 March 2021
Disclaimers
•   This presentation may contain forward-looking statements. Actual future performance, outcomes and results may differ materially from
    those expressed in forward-looking statements as a result of a number of risks, uncertainties and assumptions. Representative examples
    of these factors include (without limitation) general industry and economic conditions, interest rate trends, cost of capital and capital
    availability, availability of real estate properties, competition from other developments or companies, shifts in customer demands, shifts in
    expected levels of occupancy rate, property rental income, charge out collections, changes in operating expenses (including
    employee wages, benefits and training, property operating expenses), governmental and public policy changes and the continued
    availability of financing in the amounts and the terms necessary to support future business.

•   You are cautioned not to place undue reliance on these forward-looking statements, which are based on the current view of
    management regarding future events. No representation or warranty express or implied is made as to, and no reliance should be
    placed on, the fairness, accuracy, completeness or correctness of the information or opinions contained in this presentation. Neither
    Ascendas Funds Management (S) Ltd (“Manager”) nor any of its affiliates, advisers or representatives shall have any liability whatsoever
    (in negligence or otherwise) for any loss howsoever arising, whether directly or indirectly, from any use of, reliance on or distribution of this
    presentation or its contents or otherwise arising in connection with this presentation.

•   The past performance of Ascendas Reit is not indicative of future performance. The listing of the units in the Ascendas Reit (“Units”) on
    the Singapore Exchange Securities Trading Limited (the “SGX-ST”) does not guarantee a liquid market for the Units. The value of the Units
    and the income derived from them may fall as well as rise. Units are not obligations of, deposits in, or guaranteed by, the Manager. An
    investment in the Units is subject to investment risks, including the possible loss of the principal amount invested. Investors have no right to
    request that the Manager redeem or purchase their Units while the Units are listed on the SGX-ST. It is intended that holders of Units may
    only deal in their Units through trading on the SGX-ST.

•   This presentation is for information only and does not constitute an invitation or offer to acquire, purchase or subscribe for the Units.

                                                                                                                                                        2
Agenda

Acquisition of 11 Data Centres in Europe   4

FY2020 Financial Results                   38

                                                3
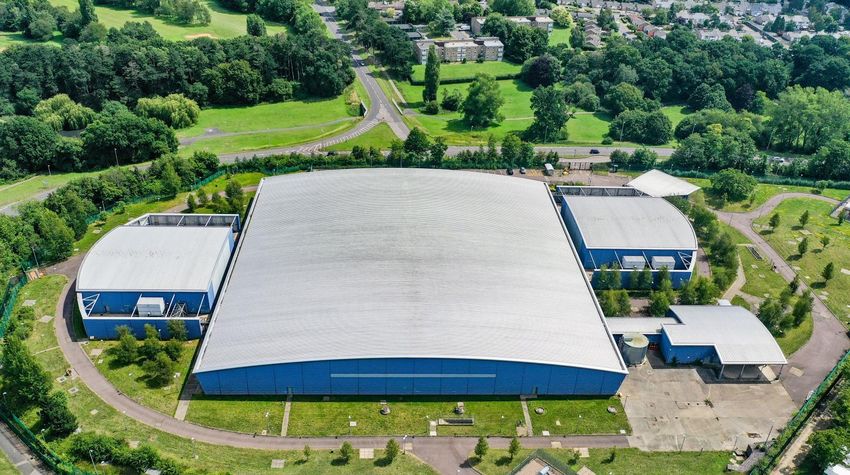
Welwyn Garden City, London, United Kingdom

Acquisition of 11 Data
Centres in Europe
Well-located in Tier 1 cities in Europe
                                                                             LONDON, UK
                                                                              1   Welwyn Garden City
                                                                              2   Cressex Business Park
                                                                              3   Croydon
                                                                             MANCHESTER, UK
                                                                              4   Reynolds House
               Manchester, UK
                                  4
                                       1
                                         2        6
                                                      7    Amsterdam,
                                                           Netherlands
                                                                             AMSTERDAM, NETHERLANDS
                    London, UK         3              5                      5    Cateringweg
                                                                             6    Gyroscoopweg
                                                                             7    Paul van Vlissingenstraat
                                         8    9
                       Paris, France         10                 Geneva,
                                                               Switzerland   PARIS, FRANCE
                                                      11                     8    Montigny-le-Bretonneux
                                                                             9    Bièvres
                                                                             10   Saclay

                                                                             GENEVA, SWITZERLAND
                                                                             11   Chemin de L’Epinglier

  Triple net powered shells        Colocation
                                                                                                              5
Acquisition Overview
    Portfolio                                                                                                                                         11 Data Centres
                                                                                                      S$904.6 m
    Total Consideration (1)                                                                           4 data centres in UK: £250.25 m
                                                                                                      7 data centres in Netherlands/France/Switzerland: €276.85 m
    Acquisition Fee (2), Stamp Duty and Other Transaction Costs                                       S$55.4 m
    Total Acquisition Cost                                                                            S$960.0 m
    Vendor                                                                                            Subsidiaries of Digital Realty Trust, Inc.
                                                                                                      S$905.0 m
    Valuation (3)                                                                                     4 data centres in UK: £250.25 m
                                                                                                      7 data centres in Netherlands/France/Switzerland: €277.10 m
                                                                                                      6 data centres: freehold(4)
    Land Tenure
                                                                                                      5 data centres: leasehold with weighted average land lease expiry of 42.9 years
    Land Area                                                                                         136,816 sqm
    Net lettable area (NLA)                                                                           61,637 sqm
    Net Property Income (NPI)                                                                         S$54.5 m
    NPI Yield                                                                                         6.0% (Pre-Cost), 5.7% (Post-Cost)
    Occupancy Rate                                                                                    97.9%
    Weighted Average Lease to Expiry (WALE) (by rental income as at
                                                                                                      4.6 years (4.2 years to break)
    31 Dec 2020
    Asset Type                                                                                        8 triple net powered shells and 3 colocation assets
    No. of customers                                                                                  14
(1) Illustrative exchange rates of £1.0000: S$1.8395 and €1.0000: S$1.6047 have been used for all conversions from Pounds Sterling and Euro amounts into Singapore Dollar respectively in this presentation.
(2) In accordance with Ascendas Reit’s Trust Deed, the Manager is entitled to receive an acquisition fee of 1.0% of the Total Consideration, which will be paid by cash.
(3) The valuations dated October 2020/February 2021, were commissioned by HSBC Institutional Trust Services (Singapore) Limited (in its capacity as trustee of Ascendas Reit), and were carried out by Newmark Knight
    Frank Valuation & Advisory, LLC, using the using the sales comparison and income capitalisation approaches. Please refer to the announcement titled “Proposed Acquisition of a Portfolio of 11 Data Centres in
                                                                                                                                                                                                                  6
    Europe” dated 17 March 2021 for the exact dates of the valuations.
Portfolio Breakdown
                                            By Asset Type                                                                    By Country

Colocation                                                                                   Netherlands                     Switzerland    Netherlands             Switzerland
   45%                                           Colocation                                     26%                              4%            28%                      4%
                                                    37%

                   Total                                            NPI                                          Total                                      NPI
                                                                                              France
               Consideration                                      S$54.5m                       19%          Consideration            France              S$54.5m
                S$904.6m                                                                                      S$904.6m                  18%

                                                                               Triple Net                                       UK                                    UK
                                          Triple Net
                                                                             Powered Shell                                     51%                                   50%
                                        Powered Shell
                                              55%                                  63%

                                                       Triple Net Powered Shell                        Colocation                                         Total
 No. of Properties                                                8                                         3                                              11
 NLA                                                          48,393 sqm                               13,244 sqm                                   61,637 sqm
 Occupancy Rate                                                 100%                                       90.4%                                          97.9%

 WALE (as at 31 Dec 2020)                                         5.5                                       3.6                                            4.6
 Land Tenure                                           4 freeholds, 4 leaseholds             2 freeholds, 1 leasehold                      6 freeholds, 5 leaseholds(1)

(1) Includes two properties on perpetual leasehold basis.
                                                                                                                                                                        7
Key Merits of the
Investment

                    1,3 & 5 Changi Business Park Crescent, Singapore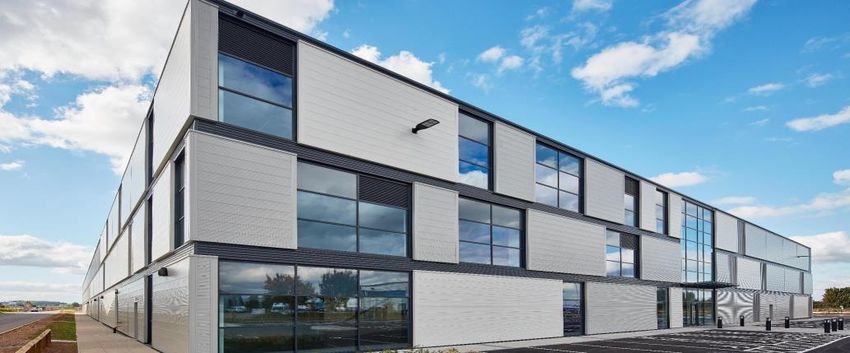
Key Merits

       In line with Ascendas Reit’s investment and acquisition growth strategy

  Enlarges          93% of the Portfolio   Strong capacity    Provides stable   Diversified and
  Ascendas Reit’s   is located in key      growth driven by   and sustainable   high-quality
  exposure to the   European data          robust take-up     income stream     customer base
  resilient data    centre markets         levels
  centre asset
  class

                                                                                                  9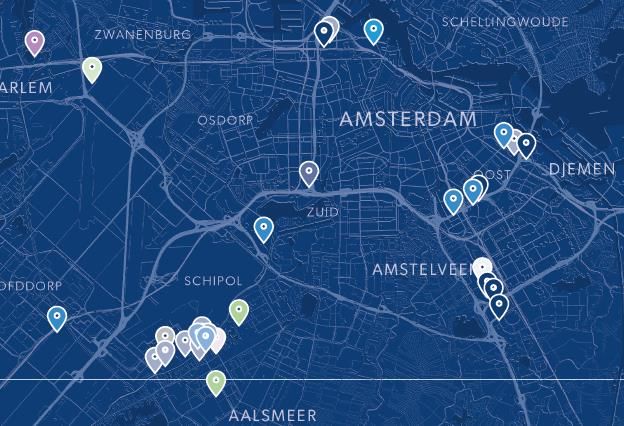
Key Merits:
Enlarges Ascendas Reit’s exposure to the resilient data centre asset class

•     Demand is expected to grow due to increasing reliance on data/online applications and
      accelerating digitisation across industries:

                 Increasing adoption of cloud computing e.g. on-          Growing number of internet users, mobile
                 demand computing services -- from applications           devices, data storage requirements
                 to storage and processing power

                                                                          Data sovereignty requirements e.g. EU’s
                 Fast-growing technology trends such as big data
                                                                          General Data Protection Regulation is
                 analytics, Internet of Things (IoT), Industry 4.0, 5G
                                                                          expected to drive demand for more EU
                 network, e-commerce, streaming video services
                                                                          located data centres as organisations seek to
                 etc.
                                                                          store data locally

 •    High barriers to entry include power availability, connectivity, high infrastructure costs etc.

                Complements Ascendas Reit’s data centre portfolio in Singapore, expanding the segment’s
                contribution from 4% (S$0.5b) to 10% (S$1.5b) (1)

(1)   Pro forma as at 31 Dec 2020
                                                                                                                  10
Key Merits:
93% of the Portfolio is located in key European data centre markets
• 9 out of 11 data centres (or 93% by asset value) are strategically located in London (3 data centres), Amsterdam (3 data
centres) and Paris (3 data centres)
• London, Amsterdam and Paris are ranked 1st, 3rd and 4th largest colocation markets in Europe with a combined market size of
~1,383 MW (as at 31 Dec 2020)
• FLAP markets (Frankfurt, London, Amsterdam and Paris) are the top tier data centre markets in Europe that benefit from being
close to large population centres and have the connectivity and infrastructure to attract data centre providers
FLAP(1) Market Size (by MW) Growth of FLAP(1) Markets (MW)
2,500
London Frankfurt Amsterdam Paris
Paris,
France 25% Frankfurt, Germany 2,000
13%
1,500
London,
1,843 MW United Kingdom
1,000
23%
500
Amsterdam, 39%
0
Netherlands 2011 2012 2013 2014 2015 2016 2017 2018 2019 2020 2021F
(1) “FLAP” refers to the four largest colocation markets in Europe: Frankfurt, London, Amsterdam and Paris.
Source: CBRE Research, Q4 2020. Data is for carrier-neutral colocation market in each city. 11Key Merits:
Strong capacity growth driven by robust take-up levels
• Take up (201 MW) of colocation data centres FLAP Colocation Markets: Total Market Size and Take-Up
outstripped new supply (174 MW) in 2020
➢ Demand driven by companies embarking on their 2,500 10-year average take up = 118 MW 400
10-year average supply = 135 MW
digital transformation plans e.g. increasing their 350
415
2,000
consumption of cloud services, in turn driving
FLAP Market Size (MW)
300
Take-Up (MW)
colocation demand from cloud providers 1,500 250
200
➢ Colocation is also increasingly being used to satisfy
1,843
1,000
1,670
150
companies IT requirements which are growing in
1,351
1,160
100
scale and complexity
958
500
827
771
695
646
544
50
• FLAP markets’ vacancy rate improved to 19% (from 21% 0 0
in 2019) 2011 2012 2013 2014 2015 2016 2017 2018 2019 2020 2021F
Market Size Take Up
• Market absorption, which is the number of years it would
take for current vacant supply to be fully let (1) was 2.4 Positive Outlook for FLAP Markets in 2021
years as at 31 Dec 2020 (down from 3.0 years in 2019)
New supply: 415 MW(2) Take up: 370MW
• The outlook for 2021 is positive: FLAP markets’ vacancy
(+139%) (+84%)
rate and market absorption are expected to improve to
17% and 2.3 years respectively 2020: 174 MW 2020: 201 MW
Vacancy rate: 17% Market absorption: 2.3 years
(1) Based on the fixed average take-up of the previous five years (i.e. not including take-up in the current
year). (-2% points) (-0.1 years)
(2) COVID-19 led to supply delays across the industry, impacting access to sites and supply chains across
Europe. In January 2020, CBRE expected to see 234 MW come online across FLAP but the actual was 2020: 19% 2020: 2.4 years
estimated at 174 MW.
Source: CBRE Research, Q4 2020. Data is for carrier-neutral colocation market in each city. 12Key Merits:
Provides stable and sustainable income stream
97.9 % 1.0 – 3.0% p.a.
Rent escalations from
High occupancy rate 83% of the Portfolio
(by rental income)
4.6 years 58%
WALE Triple net leases
(by rental income)
Data as at 31 Dec 2020
13Key Merits:
Diversified and high quality customers
Top 10 customers (by rental income)
1 HSBC Bank • 14 high-quality and established customers
2 Entserv UK
3 Bouygues Telecom
• The customers operate in a range of industries
European subsidiary of one of the largest telecommunications
such as financial services, telecommunications,
4
providers in the US(1) information technology, retail (supermarkets)
and education and are leasing the properties for
their data centre requirements
IT services provider; subsidiary of US-listed technology and
5
consulting company(1)
6 British Telecommunications
7 Equinix
IT services provider, listed company
8
with market cap of ~US$5 b(1)
9 euNetworks Data Centres B.V.
Interoute Managed Services
10
Switzerland Sarl
(1) Due to confidentiality clauses in the lease agreements, customer names cannot be disclosed.
14Key Merits:
Long lease expiry
• WALE of 4.6 years (by rental income) Breakdown of expiring leases
• 9.5% of the portfolio’s rental income is due for expiry in FY2021 London
88%
FY2021
Manchester
12%
Amsterdam
79%
FY2022
Manchester
21%
Data as at 31 Dec 2020
15Welwyn Garden City, London, United Kingdom Asset Management
Asset Management
• An European DC team (under the Sponsor) will
  oversee operations, manage customer
  relationships and grow the portfolio

• To ensure a smooth transition, Digital Realty is
  providing 1-year of property and facilities
  management services for the 11 data centres post
  acquisition
                                                       Cressex Business Park, UK
• External Property Manager and Facility Manager
  will be appointed to take over from Digital Realty
  after the 1-year transition service ends

                                                             Croydon, UK
                                                                                   17
Welwyn Garden City, London, United Kingdom Funding and Forex Risk Management
Funding and Forex Risk Management

                                                                                                               • Total acquisition cost of S$960.0 m will be
                                                           Debt                                                  funded by:
                                                           36.2%                                                        •    S$612.5 m of gross proceeds from the Equity
                                                                                                                             Fund Raising completed on 9 Dec 2020(1)
                                                                                                                        •    S$347.5 m via debt and/or internal cash
                                                                                                                             resources

                                  Total Acquisition
                                        Cost                                                                   • Forex currency management
                                     S$960.0 m                                                                          • EUR and GBP debt will be entered into to
                                                                                                                          eventually achieve a high level of natural
                                                                                                                          hedge to minimize adverse effects of
                                                                                                                          exchange rate fluctuations.

                                 EFR Proceeds
                                     63.8%

(1)   Please refer to the “Launch of Equity Fund Raising to Raise Gross Proceeds of Approximately S$1,200 million” announcement dated 10 Nov 2020.

                                                                                                                                                                       19
Welwyn Garden City, London, United Kingdom Pro Forma Financial & Portfolio Impact
Financial Impact:
  A DPU Accretive Acquisition

                                                                                                                        Pro Forma Financial Impact

      DPU Impact (1)                                                                                                                       0.189
      (pro forma annualised impact)                                                                                                   Singapore cents
                                                                                                                                           +1.3%

      Net Property Income Yield – 1st Year (2)
      Pre-transaction cost                                                                                                                       6.0%
      Post-transaction cost                                                                                                                      5.7%

(1)    The annualised pro forma DPU impact is calculated based on the following assumptions a) Ascendas Reit had completed the Proposed Acquisition on 1 Jan 2020, held and operated the Properties through 31
       Dec 2020, b) the Proposed Acquisition is funded by equity of approximately S$612.5 m (approximately 63.8% of Total Acquisition Cost) and additional borrowings of S$347.5 m (36.2%) and, c) the Manager
       elects to receive its base fee 80% in cash and 20% in units.
(2)    The Net Property Income (NPI) Yield is derived using the estimated NPI expected in the first year of acquisition.

                                                                                                                                                                                                             21
Portfolio Impact:
More Geographically Diversified
Overseas exposure will increase to 40% (from 36%) of total asset value
Before Acquisition After Acquisition
United States, 15%
United States, 14%
Singapore, 64% Singapore, 60%
Australia, 15%
By Asset Value By Asset Value Australia, 14%
S$14.0 b(1) S$15.0 b(2)
United Kingdom, 6% +6.8%
United Kingdom/
Europe, 12%
In line with strategy to remain Singapore-centric with the overseas assets in developed markets
accounting for 30% – 40% of portfolio value over time
(1) As at 31 Dec 2020, assuming the acquisition of 1-5 Thomas Halt Drive in Sydney, Australia was completed on 31 Dec 2020.
(2) As at 31 Dec 2020, assuming the Proposed Acquisition of 11 data centres and the acquisition of 1-5 Thomas Halt Drive in Sydney, Australia was completed on 31 Dec 2020.
22Portfolio Impact:
More Data Centres
Data centres will make up 10% of total asset value (from 4%)
Before Acquisition After Acquisition
Data Centre, 4% Data Centre, 10%
(1) (1)
Business Space, 50% Business Space, 47%
By Asset Value By Asset Value
Logistics, 24% Logistics, 22%
S$14.0 b(2) S$15.0 b(3)
Industrial , 22% Industrial , 21%
(1) Business Space includes Business & Science Park properties, Suburban Offices and Offices.
(2) As at 31 Dec 2020, assuming the acquisition of 1-5 Thomas Halt Drive in Sydney, Australia was completed on 31 Dec 2020.
(3) As at 31 Dec 2020, assuming the Proposed Acquisition of 11 data centres and the acquisition of 1-5 Thomas Halt Drive in Sydney, Australia was completed on 31 Dec 2020.
23Portfolio Impact:
More Freehold Properties
Proportion of freehold properties will increase to 37.5% (from 35.4%)
Before Acquisition After Acquisition
Freehold
35.4% Freehold
37.5%
By Asset Value By Asset Value
S$14.0 b(1) S$15.0 b(2)
Leasehold(3)
62.5%
Leasehold
64.6%
(1) As at 31 Dec 2020, assuming the acquisition of 1-5 Thomas Halt Drive in Sydney, Australia was completed on 31 Dec 2020.
(2) As at 31 Dec 2020, assuming the Proposed Acquisition of 11 data centres and the acquisition of 1-5 Thomas Halt Drive in Sydney, Australia was completed on 31 Dec 2020.
(3) Includes 2 data centres on perpetual leasehold basis.
24Portfolio Impact:
Lease Expiry Profile Remains Well Spread
UK/Europe Portfolio Lease Expiry Profile WALE (as at 31 Dec 2020)
% of Ascendas Reit UK/Europe
8.8 years
Portfolio’s Rental Income
Before Acquisition (1)
After Acquisition (2) 46.9%
6.3 years
23.5% 22.5% 23.0%
17.8%
5.5%7.9% 8.3% 7.9%5.5% 7.6% 8.1%
2.4% 3.1% 3.7%3.0% 3.3%
FY21 FY22 FY23 FY24 FY25 FY26 FY27 FY28 >FY28
Total Portfolio Lease Expiry Profile
Portfolio’s Rental Income
21.2% 4.1 years
% of Ascendas Reit
19.9% 19.4% 20.1%
16.1% 15.7% 4.1 years
14.5% 14.0%
9.2% 8.6%8.1%
7.1% 7.9%
6.7%
3.7%3.6%
2.2%2.1%
Before Acquisition (1)
FY21 FY22 FY23 FY24 FY25 FY26 FY27 FY28 >FY28 After Acquisition (2)
(1) As at 31 Dec 2020, assuming the Acquisitions of 1-5 Thomas Halt Drive in Sydney, Australia was completed on 31 Dec 2020.
(2) As at 31 Dec 2020, assuming the Proposed Acquisition of 11 data centres and the acquisition of 1-5 Thomas Halt Drive in Sydney, Australia was completed on 31 Dec 2020. 25Portfolio Impact: Higher contributions from Data Centre customers (1) As at 31 Dec 2020. By monthly rental income. Assuming the acquisition of 1-5 Thomas Halt Drive in Sydney, Australia was completed on 31 Dec 2020. (2) As at 31 Dec 2020, assuming the Proposed Acquisition of 11 data centres and the acquisition of 1-5 Thomas Halt Drive in Sydney, Australia was completed on 31 Dec 2020. 26
Welwyn Garden City, London, United Kingdom

Benefits to Ascendas Reit
& Unitholders
Benefits to Ascendas Reit & Unitholders
• DPU accretive with sustainable returns
      • Expects 1st year post-transaction cost NPI yield of 5.7%(1)
      • DPU accretion of 1.3%(2)
• Merits of the Properties
      • Enlarges Ascendas Reit’s exposure to the resilient data centre asset class
      • 9 out of 11 assets (93% by asset value) located in key European data centre (FLAP) markets
      • Strong capacity growth driven by robust demand
      • Attractive contractual terms, providing stable income stream
               ➢ WALE of 4.6 years by rental income
               ➢ 58% on triple net lease structure by rental income
               ➢ Majority of leases with rent escalation of 1-3% per annum (by rental income)
      • 97.9% occupied by high quality tenants
• Strengthens Ascendas Reit’s portfolio (3)
      • Increases proportion of freehold land from 35.4% to 37.5% of asset value
      • Diversified by Geography: Singapore 60%, US 14%, Australia 14% and UK/Europe 12% of asset value
      • Diversified by Asset Class: Business Space 47%, Logistics 22%, Industrial 21% and Data Centre 10%

 (1) The Net Property Income (NPI) Yield is derived using the estimated NPI expected in the first year of acquisition.
 (2) The annualised pro forma DPU impact is calculated based on the following assumptions a) Ascendas Reit had completed the Proposed Acquisition on 1 Jan 2020, held and operated the Properties
      through 31 Dec 2020, b) the Proposed Acquisition is funded by equity of approximately S$612.5 m (approximately 63.8% of Total Acquisition Cost) and additional borrowings of S$347.5 m (36.2%) and, c) the
      Manager elects to receive its base fee 80% in cash and 20% in units.
 (3) Pro Forma Impact as at 31 Dec 2020.                                                                                                                                                                        28
Welwyn Garden City, London, United Kingdom Appendix: • Property Details
London, United Kingdom
  Largest and most mature colocation data centre market in Europe
London Properties                                                                                 Key Data Centre Locations
 No. of properties:                   3
 NLA:                                 17,627 sqm
 Occupancy:                           92.8%
 Asset type:                          1 Triple Net, 2 Colocation

Key Market Highlights

                                  Market                                              2021F New
      Market Size:                                        Vacancy Rate:
                                Absorption:                                            Supply:
        729 MW                   3.0 years                     21.0%
                                                                                        115 MW
                                                                                                                                       London

 •   Largest colocation market in Europe with 40% of FLAP market supply
 •   Demand is supported by strong financial services and media/telco
     sectors
 •   London is experiencing more local cloud adoption and an influx of
     Hyperscale demand
 •   Challenges in the market include access to suitable land sites and
     power supply for data centres
                                                                                                      London Properties       Other data centres
Source: CBRE Research, Q4 2020. Data as at 31 Dec 2020 for carrier-neutral colocation market.                                                      30
London, United Kingdom
Triple Net Powered Shell Colocation Colocation
Property Welwyn Garden City Cressex Business Park Croydon
Address Hertfordshire Data Centre, Mundellst, Cressex Business Park, 1 Coronation Road, Unit B, Beddington Lane, Croydon CR0 4TD, UK
Welwyn Garden City, AL71GE, UK High Wycombe HP12 3TA, UK
Description • Built-to-suit single-storey data centre • Comprises a single-storey industrial unit • Two-storey data centre
• ~35 km north of Central London and a two-storey office converted into a • Located 19 km south of Central London on
• Transport into London’s King Cross and data centre in 2008/2009 the Prologis industrial estate
Moorgate Station takes ~ 60 minutes • ~49 km north west from the City of London, • 0.6km from Beddington Lane tram station , 30
with fastest train duration into Central km south east of London Heathrow
London in about 30 minutes International Airport and 30 km due north of
• 200 m from High Wycombe substation London Gatwick International Airport
Valuation S$120.52 million (£65.52 million) S$65.28 million (£35.49 million) S$249.42 million (£135.59 million)
Land Tenure Freehold Freehold Freehold
Land Area 37,636 sqm 9,750 sqm 12,190 sqm
NLA 10,541 sqm 1,953 sqm 5,133 sqm
Occupancy 100% 62.4% 89.5%
31Manchester, United Kingdom
UK’s 2nd largest data centre market after London
Key Market Highlights Manchester Property
Triple Net Powered Shell
New Supply
Market Size : Vacancy Rate:
(U/C & planned):
26 MW 8%
33 MW
Property Reynolds House
• 2nd largest data centre market in the UK outside London
• Since 2012, Manchester has been home to a local hub of the London Address Plot C1, Birley Fields, Hulme, Manchester
Internet Exchange (LINX). The exchange is one of the busiest
exchanges in Europe Description • Three-storey building converted to a data centre in
Key Data Centre Locations 2003
• Located 13km from Manchester International
Airport and 290km north west of London
Manchester Valuation S$25.11 million (£13.65 million)
Land Tenure Leasehold (104 years remaining)
Land Area 6,810 sqm
NLA 3,532 sqm
Occupancy 100%
Manchester Property Other data centres
Source: DC Byte/VIPA Digital (Market data for colocation and Enterprise as at 3Q 2020. Market size refers to Built IT Power) 32
CBRE Research (for data centre locations)Amsterdam, The Netherlands
Hosts two of the Top 10 largest internet exchanges in the world
Amsterdam Properties Key Data Centre Locations
No. of properties: 3
NLA: 17,095 sqm
Occupancy: 100%
Asset type: 2 Triple Net, 1 Colocation
Amsterdam
Key Market Highlights
Market 2021F New
Market Size: Vacancy Rate:
Absorption: Supply:
422 MW 3.2 years 26.4%
72 MW
• 3rd largest colocation market in Europe after London and
Frankfurt, representing 23% of total supply across FLAP markets
• Hosts two of the top10 largest internet exchanges in the world (1)
AMS IX (2nd) and NL-IX (7th)
Amsterdam Properties Other data centres
• Supply slowed in 2020 due to a temporary moratorium on new
build activity which was subsequently lifted in 2Q 2020
(1) Measured by gigabytes of traffic 33
Source: CBRE Research, Q4 2020. Data as at 31 Dec 2020 for carrier-neutral colocation market.Amsterdam, The Netherlands
Triple Net Powered Shell Triple Net Powered Shell Colocation
Property Cateringweg Gyroscoopweg Paul van Vlissingenstraat
Address Cateringweg 5, 1118 AM Schiphol, the Gyroscoopweg 2E and 2F, 1042 AB, Paul van Vlissingenstraat 16, 1076 EE and
Netherlands Amsterdam, the Netherlands Johann Siegerstraat 9, 1096 BH
Amsterdam, the Netherlands
Description • Two-storey data centre building of • Comprises two separate three-storey • Three-storey data centre
steel portal frame construction 20 km building of brick construction with • 6 km from the centre of Amsterdam, with
south west of central Amsterdam, in metal cladding on the upper floors a train time of 14 mins into Amsterdam
close proximity to Schiphol Airport and • 7 km north west of central Amsterdam Central, Schiphol Airport is located 18 km
a motorway heading south towards in close proximity to the east and to the east with a journey time of 15 mins
The Hague and Rotterdam Schiphol airport is located ~17 km to via car
the south west
Valuation S$109.12 million (€68.00 million) S$30.00 million (€18.70 million) S$93.07 million (€58.00 million)
Land Tenure Leasehold (39 years remaining) Perpetual Leasehold (50-year terms Perpetual leasehold (50-year terms with
with next expiry on 1 Jan 2042) next expiry on 15 April 2054)
Land Area 10,390 sqm 5,228 sqm 6,183sqm
NLA 5,683 sqm 5,254 sqm 6,158 sqm
Occupancy 100% 100% 100%
34Paris, France
4th Largest colocation market in Europe with increasing hyperscale and enterprise interest
Paris Properties Key Data Centre Locations
No. of properties: 3
NLA: 17,269 sqm
Occupancy: 100%
Asset type: 3 Triple Net
Key Market Highlights
Market 2021F New
Market Size: Vacancy Rate:
Absorption: Supply:
232MW 2.1 years 13.8%
93 MW
Paris
• France offers resilient, low-latency network connections to all major
Internet hubs. Its central geographical location makes France an
obligatory passage point for data traffic to Spain, Italy and Portugal
• French companies are moving to the cloud and this is driving
colocation demand
• Traditionally serving domestic enterprise companies but there is a
heightened demand from hyperscale cloud providers seeking more
capacity in the city Paris Properties Other data centres
Source: CBRE Research, Q4 2020. Data as at 31 Dec 2020 for carrier-neutral colocation market. 35Paris, France
Triple Net Powered Shell Triple Net Powered Shell Triple Net Powered Shell
Property Montigny-le-Bretonneux Saclay Bièvres
Address 1 Rue Jean Pierre Timbaud, 78180 Route de Bièvres & Route Nationale 127 Rue de Paris, 91570 Bièvres, Paris,
Montigny le Bretonneux, Paris, France 306, 91400 Saclay, Paris, France France
Description • Two-storey data centre with an • Comprises two two-storey buildings • Comprises a four-storey office building
adjoining three storey office building with a total of 4 IT rooms and a one-storey data centre
• 23km south west of Paris, in close • 19km south west of central Paris, • 13km south west of central Paris,
proximity to a busy intersection where adjacent to the N118 motorway adjacent to the N118 and N306
the N12 and A12 motorways meet heading north towards Paris and 14km motorways
west of Aeroport de Paris-Orly
Valuation S$113.93 million (€71.00 million) S$16.69 million (€10.40 million) S$41.72 million (€26.00 million)
Land Tenure Freehold Freehold Freehold
Land Area 16,136 sqm 5,734 sqm 14,797 sqm
NLA 9,714 sqm 1,982 sqm 5,573 sqm
Occupancy 100% 100% 100%
36Geneva, Switzerland
One of Europe’s fastest growing tier 2 markets
Key Market Highlights Geneva Property
Triple Net Powered Shell
New Supply
Market Size: Vacancy Rate:
(U/C & planned):
37 MW 7%
20 MW
Property Chemin de L’Epinglier
• Fertile ground for data centre industry supported by strong ecosystem of
Address Chemin de L’Epinglier 2, 1217 Satigny
financial institutions, international organisations, life science industry, luxury
industry and international HQs of global multinationals (e.g. Procter & Description • Three-storey modern concrete facility, 8 data
Gamble, Oracle, HP etc.) rooms
Key Data Centre Locations • Located in Geneva-Meyrin, in close proximity to
Geneva’s CBD, located 7 km to the east
• Adjacent to the Swiss/French border and 5 km
from Geneva Airport
Valuation S$40.12 million (€25.00 million)
Geneva
Land Tenure Leasehold (53 years remaining)
Land Area 11,962 sqm
NLA 6,114 sqm
Occupancy 100%
Geneva Property Other data centres
Source: DC Byte/VIPA Digital (Market data for colocation and Enterprise as at 3Q 2020. Market size refers to Built IT Power) 37
CBRE Research (for data centre locations)FY2020 Financial Results
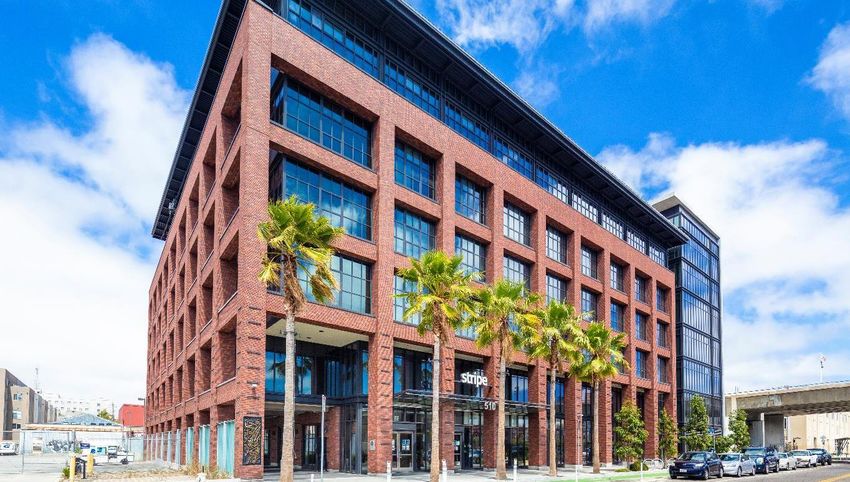
510 Townsend Street, San Francisco, USKey Highlights for FY2020
Distributable Income Distribution per Unit Total Assets
S$538.4 m 14.688 cents S$15.1 b
+6.7% y-o-y -6.1% y-o-y
Mainly attributable to newly Excluding the one-off Acquired S$973.2m of
acquired properties in United distribution of rollover properties across the
States, Australia and adjustments from prior years, United States, Australia
Singapore. DPU would have decreased and Singapore.
by 4.5% y-o-y
Stable Portfolio Positive Portfolio Lower Aggregate Stable Same-store
Occupancy Rental Reversion# Leverage to Valuation
91.7 % +3.8% 32.8% S$12.83 b
As at 31 Dec 2020 From 36.1% as at 30 Jun 2020 (vs. S$12.70 b as at 31 Dec 2019)
# Percentage change of the average gross rent over the lease period of the renewed leases against the preceding average gross rent from lease start date. Takes into account renewed
leases in multi-tenant buildings that were signed in FY2020 and average gross rents are weighted by area renewed. 39Investment
Management
254 Wellington, Melbourne, AustraliaInvestment Highlights: Acquisitions
▪ Completed S$973.2 m worth of acquisitions in FY2020.
▪ An additional S$535.2 m worth of investments to be completed within the next two years
Purchase Consideration / Completion
FY2020 City/Country Sub-segment
Land & Development Cost (S$m) Date
Completed Acquisitions 973.2
Galaxis (25% stake) Singapore Business Park 104.6 31 Mar 2020
254 Wellington Road Melbourne, Australia Suburban Office 100.6(1) 11 Sep 2020
505 Brannan Street San Francisco, US Office 269.4(2) 21 Nov 2020
510 Townsend Street San Francisco, US Office 498.6(2) 21 Nov 2020
Proposed Acquisitions 535.2
1-5 Thomas Holt Drive,
Sydney, Australia Suburban Office 284.0(3) 13 Jan 2021
Macquarie Park
Lot 7, Kiora Crescent, Yennora
Sydney, Australia Logistics 21.1(4) 3Q 2021 (est.)
(under development)
500 Green Road, Crestmead
Brisbane, Australia Logistics 69.1(3) 4Q 2021 (est.)
(under development)
MQX4, Macquarie Park
Sydney, Australia Suburban Office 161.0(5) Mid 2022 (est.)
(under development)
TOTAL : 1,508.4
(1) Based on exchange rate of A$1.000: S$0.9628 as at 31 Jul 2020
(2) Based on exchange rate of US$1.000: S$1.37088 as at 30 Sep 2020
(3) Based on exchange rate of A$1.000: S$0.9830 as at 30 Sep 2020 41
(4) Based on exchange rate of A$1.00: S$0.89957 as at 31 May 2020
(5) Based on exchange rate of A$1.000: S$0.9628 as at 31 Jul 2020Investment Highlights: Asset Enhancements
▪ Completed seven asset enhancement initiatives for total cost of S$34.2 m
Total Cost Completion
FY2020 City/Country Sub-segment
(S$m) Date
Asset Enhancement Initiatives 34.2
The Capricorn Singapore Business & Science Park 6.0 20 Feb 2020
Plaza 8 Singapore Business & Science Park 8.5 5 Mar 2020
The Galen Singapore Business & Science Park 7.0 6 Apr 2020
484-490 & 494-500 Great Western
Sydney, Australia Logistics 1.4 (1) 29 Apr 2020
Highway
52 & 53 Serangoon North Avenue 4 Singapore Light Industrial 8.5 22 Jul 2020
197 – 201 Coward Street Sydney, Australia Suburban Office 1.6 (2) 30 Sep 2020
Integrated
Aperia Singapore Development Amenities 1.2 25 Oct 2020
and Retail
(1) Based on exchange rate of A$1.00: S$0.92791 as at 31 Dec 2019
(2) Based on exchange rate of A$1.000: S$0.9830 as at 30 Sep 2020
42Investment Highlights: Divestments
▪ Divested three properties in Singapore for total sales proceeds of S$125.3 m
Completion
FY2020 Country Sub-segment Sale Price (S$m)
Date
Divestments 125.3
High-Specifications
Wisma Gulab Singapore 88.0 23 Jan 2020
Industrial
202 Kallang Bahru Singapore Light Industrial 17.0 4 Feb 2020
25 Changi South Street 1 Singapore Light Industrial 20.3 6 Mar 2020
43Capital Management
1,3 & 5 Changi Business Park Crescent, SingaporeHealthy Balance Sheet
▪ Aggregate leverage is healthy at 32.8% (1)(2)
▪ Available debt headroom of ~S$5.0 b (1)(2) to reach 50.0% aggregate leverage
▪ Total assets include cash and fixed deposits of ~S$278 m to meet current financial and operational
obligations
As at As at As at
31 Dec 2020 30 Jun 2020 31 Dec 2019
Total Debt (S$m) (1)(3) 4,784 (2) 4,963 (2) 4,653
Total Assets (S$m) (1) 14,568 (2) 13,739 (2) 13,246
Aggregate Leverage (1) 32.8% (2) 36.1% (2) 35.1%
Unitholders' Funds (S$m) 8,892 7,956 7,810
Net Asset Value (NAV) per Unit 221 cents 220 cents 216 cents
Adjusted NAV per Unit (4) 220 cents 213 cents 213 cents
Units in Issue (m) 4,021 3,620 3,613
(1) Excludes the effects of FRS 116.
(2) Includes interests in JV.
(3) Excludes fair value changes and amortised costs. Borrowings denominated in foreign currencies are translated at the prevailing exchange rates except for JPY/HKD-denominated debt issues, which are
translated at the cross-currency swap rates that Ascendas Reit has committed to.
(4) Adjusted for the amount to be distributed for the relevant period after the reporting date.
45Well-spread Debt Maturity Profile
▪ Well-spread debt maturity with the longest debt maturing in FY2030
▪ Average debt maturity stable at 3.7 years
▪ Refinanced and termed out a A$282 m (S$277 m) loan
▪ S$200 m of committed and ~S$2.1 b of uncommitted facilities are unutilised
1000 5%
868 868 7%
900 833
800 154 41%
700 200 325
621
S$ (million)
600 531
500 377 47%
350 357
400 325 254
300 227 633
543
200 192
337 357 100
271 277
100 227
132 100
0 - - - - - -- -- - -
FY2020 FY2021 FY2022 FY2023 FY2024 FY2025 FY2026 FY2027 FY2028 FY2029 FY2030
Revolving Credit Facilities Committed Revolving Credit Facilities
Term Loan Facilities Medium Term Notes and Euro Medium Term Notes 46Key Funding Indicators
▪ Robust financial metrics that exceed bank loan covenants by a healthy margin
▪ A3 credit rating facilitates good access to wider funding options at competitive rates
As at As at
31 Dec 2020 30 Jun 2020
Aggregate Leverage (1)(2)(3) 32.8% 36.1%
Unencumbered Properties as % of Total Investment
91.7% 92.0%
Properties (4)
Interest Cover Ratio (5) 4.3 x 4.2 x
Net Debt (6) / EBITDA 7.3 x 7.6 x
Weighted Average Tenure of Debt (years) 3.7 3.6
Fixed rate debt as % of total debt 78.1% 80.9%
Weighted Average all-in Debt Cost 2.7% 2.9%
Issuer Rating by Moody’s A3 A3
(1) Based on total gross borrowings divided by total assets. Correspondingly, the ratio of total gross borrowings (including perpetual securities) to unitholders’ funds is 54.8%.
(2) Exclude the effects of FRS 116.
(3) Computation includes interests in JV.
(4) Total investment properties exclude properties reported as finance lease receivable.
(5) Based on the trailing 12 months EBITDA (excluding effects of any fair value changes of derivatives and investment properties, and foreign exchange translation), divided by the trailing 12 months interest
expense and borrowing-related fees.
(6) Net debt includes lease liabilities arising from FRS 116, 50% of perpetual securities, offset by cash and fixed deposits.
47High Natural Hedge
▪ Maintained high level of natural hedge for Australia (~70%), the United Kingdom (~100%) and United
States (~60%) to minimise the effects of adverse exchange rate fluctuations
AUD GBP USD
Natural Hedge Natural Hedge Natural Hedge
2.5 ~70% ~100% ~60%
US$1.5 b
A$1.9 b (S$ 2.1 b)
2.0 (S$ 1.8 b)
S$ (billion)
A$1.3 b US$0.9 b
1.5
(S$ 1.3 b) (S$ 1.3 b)
£0.4 b £0.4 b
1.0 (S$ 0.8 b)
(S$ 0.8 b)
0.5
0.0
Total Australia Total Australia Total United Total United Total United States Total United States
Assets Borrowings Kingdom Assets Kingdom Assets Borrowings
Borrowings
48Annual Property Revaluation
• Total valuation of 197 investment properties(1) was S$13.70 b
• Stable same-store valuation for 194 properties(2) at S$12.83 b (vs. S$12.70 b @ 31 Dec 2019)
As at 31 Dec 2020 Valuation (S$b) Weighted Average Cap Rates Cap Rates Range
Singapore portfolio (93 properties) 9.02 6.01% 5.25% - 7.25%
Business & Science Parks(3) 4.14 5.77% 5.25% - 6.00%
High-Specifications/Data Centres 2.11 6.30% 5.75% - 6.90%
Light Industrial/Flatted Factories (4) 0.88 6.33% 6.00% - 7.25%
Logistics & Distribution Centres 1.17 6.14% 5.75% - 6.75%
Integrated Development, Amenities & Retail 0.72 5.90% 5.25% - 6.50%
United States portfolio (30 properties) (5) 2.08 5.79% 4.75% - 7.25%
Australia portfolio (36 properties)(6) 1.82 5.62% 4.75% - 6.75%
Suburban Offices 0.45 5.96% 5.75% - 6.50%
Logistics & Distribution Centres 1.37 5.51% 4.75% - 6.75%
United Kingdom portfolio (38 properties) (7) 0.78 5.81%(8) 4.26% - 7.50%(8)
Total Portfolio (197 properties) 13.70
(1) Excludes 25 & 27 Ubi Road 4 and iQuest@IBP which are under redevelopment
(2) Excludes 3 Singapore properties which were divested in FY2020 (Wisma Gulab, 202 Kallang Bahru and 25 Changi South Street 1), 3 properties under redevelopment (25 Ubi Road 4, 27 Ubi Road 4 and iQuest@IBP) and 3
properties acquired in FY2020 (254 Wellington Road, 510 Townsend Street and 505 Brannan Street).
(3) Excludes iQuest which is under redevelopment.
(4) Excludes 25 Ubi Road 4 and 27 Ubi Road 4 which are under redevelopment.
(5) All S$ amount based on exchange rate of US$1.00: S$1.34786 as at 31 Dec 2020. Valuation for 510 Townsend Street and 505 Brannan Street are as at 15 October 2020.
(6) All S$ amount based on exchange rate of A$1.00: S$0.98003 as at 31 Dec 2020.
(7) All S$ amount based on exchange rate of £1.00: S$1.77775 as at 31 Dec 2020.
(8) Refers to equivalent yield, which reflects the current level of return on property investments in the United Kingdom.
49Asset
Management
Infineon Building , SingaporeOverview of Portfolio Occupancy
97.4% 97.5% 97.4% 97.5% 97.5% 97.7%
92.9% 92.0% 93.9% 91.7% 91.9% 90.9%
88.4% 88.8% 87.2%
Singapore United States Australia United Kingdom Total
Dec-20 Sep-20 Dec-19
Gross Floor
3,001,293 357,065 828,197 (2) 509,908 (3) 4,696,463
Area (sqm) (1)
(1) Gross Floor Area as at 31 Dec 2020.
(2) Gross Floor Area for Australia portfolio refers to the Gross Lettable Area/Net Lettable Area.
(3) Gross Floor Area for United Kingdom portfolio refers to the Gross Internal Area.
51Singapore: Sources of New Demand in FY2020
▪ Continues to attract demand from a wide spectrum of industries
3.4% 2.5%
2.1% 2.1%
7.5% 5.1% 7.9%
4.4% 1.2% 1.4%
7.7% 9.0% 7.4%
8.6% 9.2%
By Gross
By NLA Rental
9.0% 10.0%
Income 22.7%
35.1%
15.9% 11.5%
16.2%
Logistics & Supply Chain Management Government and IO/NGOs/NPOs
Biomedical and Agri/Aquaculture Lifestyle, Retail and Consumer Products
Engineering Electronics
IT & Data Centers Energy, Chemicals and Materials
Distributors & Trading Company Education and Media
Financial & Professional Services
52Portfolio Rental Reversions
▪ Average portfolio rent reversion of 3.8% was recorded for leases renewed in FY2020
▪ Portfolio rental reversion for FY2021 is expected to be positive low single-digit in view of current market uncertainties
4Q FY2020 3Q FY2020
% Change in Renewal Rates for Multi-tenant Buildings (1) FY2020 FY2019
(Oct – Dec 2020) (Jul – Sep 2020)
Singapore 3.1% 6.2% 0.9% -2.8%
Business & Science Parks 7.2% 9.2% -1.1% 4.5%
High-Specifications Industrial and Data Centres -2.6% 3.3% -0.1% -3.3%
Light Industrial and Flatted Factories 1.3% 2.1% -5.0% -1.4%
Logistics & Distribution Centres -7.9% 4.9% -7.1% -16.2%
Integrated Development, Amenities & Retail 13.5% 0.7% 11.5% 0.0%
United States 16.6% N.A. 18.8% 11.5%
Business Parks 16.6% N.A. 18.8% 11.5%
Australia 14.0% 1.0% - (2) - (2)
Suburban Offices 15.7% 1.9% - (2) - (2)
Logistics & Distribution Centres 13.6% -9.9% - (2) - (2)
United Kingdom - (2) - (2) - (2) - (2)
Logistics & Distribution Centres - (2) - (2) - (2) - (2)
Total Portfolio : 3.8% 6.0% 2.5% -2.3%
(1) Percentage change of the average gross rent over the lease period of the renewed leases against the preceding average gross rent from lease start date. Takes into account renewed leases that were signed in their
respective periods and average gross rents are weighted by area renewed. 53
(2) There were no renewals signed in the period for the respective segments.Weighted Average Lease Expiry
(By gross revenue)
▪ Portfolio Weighted Average Lease Expiry (WALE) stood at 4.1 years
WALE (as at 31 Dec 2020) Years
Singapore 3.5
United States 5.1
Australia 4.1
United Kingdom 8.8
Portfolio 4.1
54Portfolio Lease Expiry Profile
(as at 31 Dec 2020) Breakdown of expiring leases for FY2021 and FY2022
▪ Portfolio weighted average lease to expiry (WALE) of 4.1 years. 4% 2%6% 14%
1%
9%
▪ Lease expiry is well-spread, extending beyond FY2034 36% 7% 33%
▪ About 16.3% of gross rental income is due for renewal in FY2021 FY2021 8% FY2022
20%
▪ Weighted average lease term of new leases (1) signed in FY2020 was 3.7 15% 12%
years and contributed 7.4% of FY2020 total gross revenue 9% 14%
10%
25%
% of Gross Rental Income (Total Portfolio)
21.5% Business and Science Parks
19.9%
20%
High-Specifications Industrial and Data
16.3% Centres
15% Light Industrial and Flatted Factories
Multi-tenant Buildings
17.2%
Single-tenant Buildings Logistics & Distribution Centres
16.7%
10%
14.1% 8.1%
7.2% Integrated Development, Amenities &
6.2%
4.8% Retail
5% 6.0% 1.7% 3.7% 3.1% Logistics & Suburban Offices (Australia)
5.7% 2.2% 2.7% 2.3%
0.9% 0.2%
4.3% 4.5% 0.6% 1.6% 0.7% 0.9% 0.9% 4.8%
2.2% 3.2% 2.1% 2.8% 0.0% 2.9% Logistics & Distribution Centres (United
1.5% 1.6% 1.1% 1.6% 0.9% 0.9%
0% 0.0% Kingdom)
FY26
FY21
FY22
FY23
FY24
FY25
FY27
FY28
FY29
FY30
FY31
FY32
FY33
FY34
> FY34
Business Parks (US)
(1) New leases refer to new, expansion and renewal leases. Excludes leases from new acquisitions.
55Ongoing Projects:
Improving Portfolio Quality
Estimated
Country Estimated Total Cost (S$m)
Completion Date
Development 182.6
Built-to-suit business park
Singapore 182.6 2Q 2021
development for Grab
Redevelopments 119.3
UBIX (formerly 25 & 27 Ubi Road 4) Singapore 35.0 4Q 2021
iQuest@IBP Singapore 84.3 1Q 2023
Asset Enhancement Initiatives 26.1
21 Changi South Avenue 2 Singapore 4.7 2Q 2021(1)
100 & 108 Wickham Street Brisbane, Australia 10.1 1Q 2021(2)
Changi Logistics Centre (New) Singapore 11.3 2Q 2022
TOTAL: 328.0
(1) Delayed from 1Q 2021
(2) Delayed from 4Q 2020 56Asset Enhancement Initiative (New):
Changi Logistics Centre, Singapore
Enhancement works include upgrading of
power transformer, warehouse spaces to
Description latest fire code requirements and
modernisation of toilets, cargo and
passenger lifts
Property Segment Logistics
Net Lettable Area 39,460 sqm
Estimated Cost S$11.3m
Estimated Completion Date 2Q 2022
57Portfolio Resilience
The Galen, SingaporeDiversified Portfolio
By Value of Investment Properties
United Kingdom, Australia, 13%
6%
▪ As at 31 Dec 2020, total investment properties Logistics and
stood at S$13.7 b (197 Properties) Distribution United States,
Suburban
Centres Australia Offices 15%
Logistics and 10% Australia
Distribution 3%
▪ Diversified geographically: Centres United
Kingdom
6%
▪ Singapore portfolio: S$9.0 b Logistics &
Distribution
Business Park /
Office, US
▪ United States portfolio: S$2.1 b Centres Singapore
9%
15%
▪ Australia portfolio: S$1.8 b
Integrated
▪ United Kingdom portfolio: S$0.8 b Development, Total Investment
Amenities & Retail Properties
5%
~S$13.7 b
▪ Diversified by asset class: Light industrial and
Flatted Factories
7%
▪ Business & Science Park/ Suburban office/Office:
49% Business & Science
Parks
High- 30%
▪ Industrial: 27% Specifications
Industrial and Data
▪ Logistics & Distribution Centre: 24% Centres
15%
Singapore, 66%
Notes:
Multi-tenant buildings account for 67.9% of Ascendas Reit’s portfolio by asset value as at 31 Dec 2020.
Within Hi-Specs Industrial, there are 3 data centres (4.0% portfolio), of which 2 are single-tenant buildings.
Within Light Industrial, there are 2 multi-tenant flatted factories (2.4% of portfolio).
59Customers’ Industry Diversification
(By Monthly Gross Revenue)
▪ Diversified customer base across more than 20 industries
More than
20 industries
60Quality and Diversified Customer Base
▪ Total customer base of more than 1,450 tenants
▪ Top 10 customers (as at 31 Dec 20) account for about 20.5% of monthly portfolio gross revenue*
▪ On a portfolio basis, weighted average security deposit is about 5.9 months of rental income.
geographical location(s) of property
* Monthly gross revenue has been adjusted to exclude the government grant related to property tax and rent relief support provided to tenants amid the COVID-19 pandemic.
61Diversified Portfolio
No single property
accounts for more than
4.2% of Ascendas Reit’s
monthly gross revenue*
* Monthly gross revenue has been adjusted to exclude the government grant related to
property tax and rent relief support provided to tenants amid the COVID-19 pandemic.
62Sustainability
Techpoint, SingaporeSustainability Achievements
Aug 2020: Issued first S$100 m Green Bond
Sep 2020: Issued first real estate S$300 m Green Perpetual Securities in Asia (1)
Largest no. of BCA (2) Green Mark Properties amongst S-REITs – 34 Properties
1st industrial building in Largest no. of public Electrical Largest combined solar farm
Singapore awarded Green Vehicle (EV) charging points in by a real estate company in
Mark Platinum Super Low Singapore by S-REIT Singapore
Energy (SLE) status by BCA
LogisTech, Singapore 80 Bendemeer Road, Singapore 40 Penjuru Lane, Singapore
>21,000 solar panels across 6 properties
40 lots across 8 properties providing
Best-in-class energy efficient building generating over 10,000 MWh of
high-speed charging
solar energy
(1) The Green Bond and Green Perpetual Securities were issued under a newly established Green Finance Framework. Please refer to https://ir.ascendas-reit.com/green_financing.html for details.
(2) Building and Construction Authority, Singapore 64Powering Properties with Renewable Energy
• Common facilities' electricity usage at three buildings located at one-north will be 100% powered with
renewable energy generated from Ascendas Reit’s solar farms by 2022
• In 2020, our solar farms have generated solar energy exceeding the amount required to power the
common facilities at Neuros & Immunos
Neuros & Immunos Nexus @one-north Nucleos
By 2020 By 2021 By 2022
Power 1,300 four-room Avoid 2.4 mil
HDB flats for a year kg of CO2
65Building a Green and Sustainable Portfolio
39 Properties with Green Building Certifications Incorporating Green and Community Spaces
New Developments Existing Properties
12
9
7 Grab’s HQ, Singapore
Fustal courts @ Plaza 8, Singapore
– Green Mark GoldPlus
6
3
2
BCA GM BCA GM Gold BCA GM BCA GM LEED Platinum NABERS MQX4, Sydney Australia Collaborative spaces @ The
Certified GoldPlus Platinum (BD+C) Energy Rating
– 6 Star Green Star Design & As Built* Galen, Singapore
(min 3.0 Star)
Notes:
BCA: Building and Construction Authority * Target rating
LEED: Leadership in Energy and Environmental Design. BD+C: Building Design & Construction 66
NABERS: National Australian Built Environment Rating SystemEmbracing Innovation and Technology
• Initiated the Smart Urban Co-Innovation Lab (located at The
Galen, Singapore Science Park 2), Southeast Asia’s first industry-
led lab for smart cities solutions development
• Supported by the Infocomm Media Development Authority and
Enterprise Singapore, the Lab will bring together leaders to co-
create and test innovations with local built environment and
technology enterprises in a live environment
• Focus on six key industry verticals of advanced manufacturing,
digital wellness, intelligent estates, smart mobility, sustainability,
and urban agriculture. 28 Oct 2020: Official Opening of the Smart Urban Co-
Innovation Lab
• 30 industry players such as Amazon Web Services, Cisco Systems,
Johnson Controls, Microsoft, MooVita, NavInfo DataTech,
Schneider Electric, SPTel, TPG Telecom and Vizzio.AI have
committed to partner local firms to co-innovate, test ideas in the
Lab or pilot trials at the 55-hectare 5G-enabled Singapore
Science Park, the largest site in Singapore for trials of smart cities
solutions.
The Smart Urban Co-Innovation Lab is located at The
Galen, at Singapore Science Park 2 67Market Outlook
7 Grevillea Street, Sydney, AustraliaMarket Outlook
▪ In January 2021, the International Monetary Fund (IMF) projected a return to global growth of 5.5% in 2021 from an
estimated contraction of 3.5% in 2020. The IMF has cautioned that global economic recovery remains uncertain as
access to vaccines remain uneven across advanced and emerging economies.
▪ The Singapore economy contracted 5.4% y-o-y in 2020 (2021 GDP forecast: 4.0% to 6.0%). The Ministry of Trade and
Industry (MTI) expects a slow and uneven recovery amongst major advanced and developing economies in 2021.
• Companies remain cautious and are expected to continue to put their business and expansion plans on hold until there
is greater clarity on the COVID-19 situation in Singapore and globally.
▪ In 2020, the US economy recorded a contraction of 3.5% y-o-y compared with a growth of 2.2% y-o-y in 2019 (2021
GDP forecast: 5.1%). The spike in COVID-19 infections towards the end of 2020 presents a key risk to economic
recovery in 2021.
• The US portfolio is located in the US technology cities of San Francisco, San Diego, Raleigh and Portland and is well-
positioned to benefit from the growing technology and healthcare sectors. The strength of the US portfolio is also
underpinned by its WALE of 5.1 years and the high proportion of leases with rent escalation clauses of between 2.5% to
4.0% per annum.
Source for Singapore GDP and GDP growth forecast: MTI 69
Source for US GDP: US Bureau of Economic Analysis; Source for GDP growth forecast: IMFMarket Outlook
▪ Australia’s economy contracted 1.1% in 2020. The Reserve Bank of Australia expects GDP to grow by ~3.5% in 2021.
• The portfolio continues to deliver stable performance due to good locations in the key cities of Sydney, Melbourne
and Brisbane, long WALE of 4.1 years and average rent escalations of approximately 3% per annum.
• Australian portfolio value is expected to grow by 29% to S$2.4 billion after taking into account recently announced
acquisitions.
▪ In 2020, the UK economy contracted by 9.9% y-o-y, the largest annual decline in UK GDP on record. In 2021, GDP
is expected to grow by 4.5% y-o-y.
• On 1 Jan 2021, the UK formally separated from the European Union (EU). A free trade deal was secured, which
avoided the introduction of tariffs or quotas on goods traded between the UK and the EU. Ascendas Reit’s UK
portfolio has a long WALE of 8.8 years, which will help to mitigate any uncertainties that may arise as businesses
adjust to the new regime.
• The proportion of internet sales in the UK remained consistently above 26% of total retail sales in the second half of
2020, higher than the previous year’s record of 21.6% achieved in November 2019. This strong e-commerce
penetration trend is expected to continue benefiting the logistics sector that all of Ascendas Reit’s UK properties are
in.
▪ The pace of business recovery globally is expected to vary across sectors and remain uncertain. The Manager
will continue to exercise prudence, maintain a strong balance sheet and proactively manage its portfolio to
deliver sustainable returns for its Unitholders.
Source for Australia GDP: Australian Bureau of Statistics; Source for Australia GDP growth forecast: Australian Government Mid-Year Economic and Fiscal Outlook 70
Source for UK GDP and internet sales: Office for National Statistics; GDP: Source for UK GDP growth forecast: IMFAdditional Information
1 Historical Financial Results
2 Ascendas Reit’s Singapore Occupancy vs Industrial Average
3 Singapore Industrial Property Market
4 Singapore New Supply
71Historical Financial Results
Financial Highlights FY2019 FY2020
1Q 2Q 3Q 1H 2H
(S$ m) Total* Total
(Apr-Jun) (Jul-Sep) (Oct-Dec) (Jan-Jun) (Jun-Dec)
Gross Revenue 230 230 239 699 521 528 1,049
Net Property Income 178 178 182 538 388 388 776
Total Amount
Available for 124 124 127 375 263 275 538
Distribution
No. of Units in Issue
3,113 3,113 3,613 3,613 3,620 4,021 4,021
(m)
Distribution Per Unit
4.005 3.978 3.507 11.490 7.270 7.418 14.688
(cents)
* Ascendas Reit changed its financial year end from 31 March to 31 December. Therefore, FY2019 is a nine-month period from 1 April 2019 to 31 December 2019. Please refer to the announcement dated 24 July
2019 for more information.
72Ascendas Reit’s Singapore
Occupancy vs Industrial Average
100%
93.9%
95%
89.9%
90% 88.5% 88.5%
85.8% 87.0%
84.2% 85.6%
85%
80%
Occupancy Rate
75%
70%
65%
60%
55%
50%
Business and Science Park High-Specifications Industrial Light Industrial Logistics
Ascendas Reit JTC Statistics
Source :
Ascendas Reit’s Singapore portfolio as at Dec 2020. Market: JTC statistics (4Q 2020).
JTC statistics do not breakdown for High-Specifications Industrial space, The occupancy rate (88.5%) for the multiple-user factory category is taken as a proxy.
73Average Market Rents (Singapore)
by Segment
120
Rental Index of All Singapore Industrial Property
100 90.9
Rental Index (4Q 2012 = 100)
90.3 89.5 89.6
80
60
40
20
Source : JTC’s 4Q 2020 Quarter Market Report
$6.50
Average Market Rents (Singapore) by Segment Business Park (City Fringe): $5.80 psf pm
Average Monthly Gross Rents ($psf)
$5.50
Business Park (Rest of Island):
$4.50 $3.70 psf pm
$3.50
High-Specifications: $3.30 psf pm
$2.50
Logistics: $1.58 psf pm
$1.50
Light Industrial: $1.50 psf pm
$0.50
High-Specifications Light Industrial Logistics Business Park (City Fringe) Business Park (Rest of Island)
Source : 74
CBRE Market View Report 4Q 2020 for Business Park (City Fringe), Business Park (Rest of Island), High-Specifications, Light Industrial and Logistics.Singapore Industrial Market:
New Supply
▪ Potential new supply of about 3.1 m sqm (~6.4% of existing stock) over next 4 years, of which 34% are pre-
committed
▪ Island-wide occupancy improved to 89.9% as at 31 Dec 20 (from 89.6% as at 30 Sep 20)
New
Existing Supply % of New/
Sector ('000 sqm) 2021 2022 2023 Supply
(Total) Existing supply
(Total)
Business & Science Park 201 0 64 265
2,197 12.1%
% of Pre-committed (est) 63% 0% 0% 48%
High-Specifications Industrial 255 105 207 567
% of Pre-committed (est) 74% 0% 100% 70%
36,721 5.8%
Light Industrial 885 648 12 1,546
% of Pre-committed (est) 17% 31% 100% 24%
Logistics & Distribution Centres 345 347 117 809
11,071 7.3%
% of Pre-committed (est) 27% 27% 0% 23%
Total 1,686 1,101 400 3,186 49,989 6.4%
% Pre-committed (est) 33% 27% 55% 34%
Note:
Excludes projects under 7,000 sqm. Based on gross floor area
Source: 75
JTC 4Q 2020 Industrial Report & Ascendas Reit internal researchSingapore Business & Science Parks:
New Supply (1)
Expected % Pre-committed
Location Developer GFA (sqm)
Completion (Estimated)
2021 one-north Wilmar International Limited 18,460 100%
2021 one-north Snakepit-BP LLP 16,460 100%
2021 Changi Business Park Kajima Development Pte Ltd 12,970 100%
2021 Jurong Innovation District Surbana Jurong Capital (JID) Pte Ltd 41,350 100%
2021 one-north Ascendas REIT (Grab HQ) 36,770 100%
2021 Jurong Innovation District JTC Corporation (Cleantech Loop) 13,190 0%
2021 Jurong Innovation District JTC Corporation (Cleantech Loop) 61,690 0%
2023 one-north HB Universal Pte Ltd 35,160 0%
2023 Singapore Science Park Science Park Property Trustee Pte Ltd 28,820 0%
264,870 48%
(1) Excludes projects under 7,000 sqm. Based on gross floor area
Source JTC, as of 4Q 2020 76Singapore High-Specifications & Light Industrial:
New Supply (1)
Expected % Pre-committed
Location Developer GFA (sqm)
Completion (Estimated)
2021 Senoko Drive/Senoko Road Tee Yih Jia Food Manufacturing Pte Ltd 79,580 100%
2021 Seletar North Link HL-Sunway JV Pte Ltd 62,480 100%
2021 Ang Mo Kio Street 64 United Engineers Limited 60,180 100%
2022 Sunview Way Malkoha Pte Ltd 171,340 100%
2021 Defu South Street 1 JTC Corporation 325,770 0%
2021 Kranji Loop/Kranji Road JTC Corporation 143,370 0%
2021 Kranji Loop JTC Corporation 133,040 0%
2022 Bulim Lane 1/2 JTC Corporation 159,400 0%
2022 Ang Mo Kio Street 64/65 JTC Corporation 116,940 0%
2022 Tai Seng Avenue SB (Ipark) Investment Pte. Ltd. 105,250 0%
2022 Kallang Way Mapletree Industrial Trust 80,420 0%
2023 Lok Yang Way Google Asia Pacific Pte Ltd 120,070 100%
2023 Bulim Avenue Hyundai Motor Singapore Pte Ltd 86,900 100%
1,644,740 35%
(1) Projects that are above 50,000 sqm 77
Source JTC, as of 4Q 2020You can also read