ARES contro COVID-19 linee di indirizzo per affrontare la pandemia - www.ares-italia.org - Ares ...
←
→
Page content transcription
If your browser does not render page correctly, please read the page content below

ARES contro COVID-19
      linee di indirizzo per affrontare la
                      pandemia

www.ares-italia.org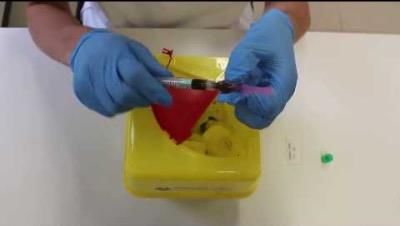
L’ARES (Associazione Regionale per le Emergenze Sanitarie e Sociali) nasce ad Ancona il 7 dicembre 1999 su iniziativa
di un gruppo di sanitari che avevano cooperato con la Regione Marche nella Missione Arcobaleno a sostegno della
popolazione Kosovara. Da questa esperienza è maturata la consapevolezza di strutturare una risposta specifica alle necessità
straordinarie dettate da una catastrofe.

L’ARES, iscritta nell’elenco delle associazioni ONLUS, da oltre un ventennio collabora attivamente con la Protezione Civile
della Regione Marche, Nazionale ed Europea sia in missioni nazionali ed internazionali, quali Molise 2002, Thailandia 2004,
Pakistan 2005, Indonesia 2006, L’Aquila 2009, Haiti 2010, Emilia Romagna 2012, Filippine 2013 e Centro-Italia 2016, che
in eventi di simulazioni fullscale, come ECPM “Eurosot 2005”, “Terex 2010”, “Modex 2011”, “Taranis 2013”, “Modex
2015”, “Modex 2016”, “Modex 2018” e “Modex 2019”.

L’associazione è costituita da Medici e Infermieri urgentisti ed intensivisti di varie specialità, un team di Psicologi, Assistenti
sociali e Sanitarie con formazione specifica nell’emergenza e urgenza, e Logisti a supporto della componente tecnica.
La formazione nella medicina delle catastrofi da sempre è stata una priorità, da condurre in tempo di “pace” insieme alla
pianificazione e allo stoccaggio delle risorse, così come in tempo di missione.

In questo momento storico “atipico” l‘ARES continua ad essere impegnata non come associazione in prima linea, ma con
singole unità operative all’interno delle proprie realtà per gestire al meglio la pandemia da COVID-19.
La voglia di continuare a fare squadra si è concretizzata nella produzione di alcuni documenti, destinati a supportare i soci, il
personale sanitario e la popolazione in questo difficile ed estenuante momento.

www.ares-italia.org

Modalità di esecuzione e principi di
     interpretazione dell’Emogasanalisi
                        Dott. Romano Graziani

                      UO Anestesia e Rianimazione

                Ospedale Engles Profili-Fabriano (AN)

www.ares-italia.org
Normal Arterial Blood Gas Values*
pH 7.35 - 7.45
PaCO2 35 - 45 mm Hg
PaO2 70 - 100 mm Hg **
SaO2 93 - 98%
HCO3¯ 22 - 26 mEq/L
%MetHb < 2.0%
%COHb < 3.0%
Base excess -2.0 to 2.0 mEq/L
CaO2 16 - 22 ml O2/dl
* At sea level, breathing ambient air
** Age-dependent
www.ares-italia.orgThe Key to Blood Gas Interpretation:
4 Equations, 3 Physiologic Processes
Equation Physiologic Process
1) PaCO2 equation Alveolar ventilation
2) Alveolar gas equation Oxygenation
3) Oxygen content equation Oxygenation
4) Henderson-Hasselbalch equation Acid-base balance
www.ares-italia.orgPaCO2 Equation: PaCO2 reflects ratio of
metabolic CO2 production to alveolar
ventilation
VCO2 x 0.863 VCO2 = CO2 production
PaCO2 = -------------------------- VA = VE – VD
VA VE = minute (total) ventilation (= resp. rate x
tidal volume)
VD = dead space ventilation (= resp. rate x
dead space volume
0.863 converts VCO2 and VA units to mm Hg
Condition State of
PaCO2 in blood alveolar ventilation
> 45 mm Hg Hypercapnia Hypoventilation
35 - 45 mm Hg Eucapnia Normal ventilation
< 35 mm Hg Hypocapnia Hyperventilation
www.ares-italia.orgHypercapnia
VCO2 x 0.863
PaCO2 = -----------------------
VA VA = VE – VD
Hypercapnia (elevated PaCO2) is a serious respiratory problem. The
PaCO2 equation shows that the only physiologic reason for elevated
PaCO2 is inadequate alveolar ventilation (VA) for the amount of the body’s
CO2 production (VCO2). Since alveolar ventilation (VA) equals total or
minute ventilation (VE) minus dead space ventilation (VD), hypercapnia
can arise from insufficient VE, increased VD, or a combination of both.
www.ares-italia.orgHypercapnia (cont)
VCO2 x 0.863
PaCO2 = ---------------------
VA VA = VE – VD
Examples of inadequate VE leading to decreased VA and
increased PaCO2: sedative drug overdose; respiratory muscle
paralysis; central hypoventilation
Examples of increased VD leading to decreased VA and
increased PaCO2: chronic obstructive pulmonary disease; severe
restrictive lung disease (with shallow, rapid breathing)
www.ares-italia.orgClinical Assessment of Hypercapnia
is Unreliable
The PaCO2 equation shows why PaCO2 cannot reliably be
assessed clinically. Since you never know the patient's VCO2 or
VA, you cannot determine the VCO2/VA, which is what PaCO2
provides. (Even if VE is measured [respiratory rate x tidal
volume], you cannot determine the amount of air going to dead
space, i.e., the dead space ventilation.)
There is no predictable correlation between PaCO2 and the
clinical picture. In a patient with possible respiratory disease,
respiratory rate, depth, and effort cannot be reliably used to
predict even a directional change in PaCO2. A patient in
respiratory distress can have a high, normal, or low PaCO2. A
patient without respiratory distress can have a high, normal, or
low PaCO2.
www.ares-italia.orgDangers of Hypercapnia
Besides indicating a serious derangement in the respiratory system,
elevated PaCO2 poses a threat for three reasons:
1) An elevated PaCO2 will lower the PAO2 (see Alveolar gas equation),
and as a result will lower the PaO2.
2) An elevated PaCO2 will lower the pH (see Henderson-Hasselbalch
equation).
3) The higher the baseline PaCO2, the greater it will rise for a given fall in
alveolar ventilation, e.g., a 1 L/min decrease in VA will raise PaCO2 a
greater amount when the baseline PaCO2 is 50 mm Hg than when it is
40 mm Hg.
www.ares-italia.orgPCO2 vs. Alveolar Ventilation
The relationship is shown for metabolic
carbon dioxide production rates of 200
ml/min and 300 ml/min (curved lines). A
fixed decrease in alveolar ventilation (x-
axis) in the hypercapnic patient will
result in a greater rise in PaCO2 (y-axis)
than the same VA change when PaCO2
is low or normal.
This graph also shows that if alveolar
ventilation is fixed, an increase in
carbon dioxide production will result in
an increase in PaCO2.
www.ares-italia.orgPaCO2 and Alveolar Ventilation: Test Your
Understanding
1. What is the PaCO2 of a patient with respiratory rate 24/min,
tidal volume 300 ml, dead space volume 150 ml, CO2
production 300 ml/min? The patient shows some evidence
of respiratory distress.
2. What is the PaCO2 of a patient with respiratory rate 10/min,
tidal volume 600 ml, dead space volume 150 ml, CO2
production 200 ml/min? The patient shows some evidence
of respiratory distress.
www.ares-italia.orgPaCO2 and Alveolar Ventilation: Test Your
Understanding - Answers
1. First, you must calculate the alveolar ventilation. Since
minute ventilation is 24 x 300 or 7.2 L/min, and dead space
ventilation is 24 x 150 or 3.6 L/min, alveolar ventilation is 3.6
L/min. Then
300 ml/min x .863
PaCO2 = -----------------------
3.6 L/min
PaCO2 = 71.9 mm Hg
2. VA = VE - VD
= 10(600) - 10(150) = 6 - 1.5 = 4.5 L/min
200 ml/min x .863
PaCO2 = ---------------------- = 38.4 mm Hg
4.5 L/min
www.ares-italia.orgAlveolar Gas Equation
PAO2 = PIO2 - 1.2 (PaCO2)*
Where PAO2 is the average alveolar PO2, and PIO2 is the partial
pressure of inspired oxygen in the trachea
PIO2 = FIO2 (PB – 47 mm Hg)
FIO2 is fraction of inspired oxygen and PB is the barometric
pressure. 47 mmHg is the water vapor pressure at normal body
temperature.
* Note: This is the “abbreviated version” of the AG equation, suitable for most clinical purposes. In the longer version, the
multiplication factor “1.2” declines with increasing FIO2, reaching zero when 100% oxygen is inhaled. In these exercises “1.2” is
dropped when FIO2 is above 60%.
www.ares-italia.orgAlveolar Gas Equation
PAO2 = PIO2 - 1.2 (PaCO2)
where PIO2 = FIO2 (PB – 47 mm Hg)
Except in a temporary unsteady state, alveolar PO2 (PAO2)
is always higher than arterial PO2 (PaO2). As a result,
whenever PAO2 decreases, PaO2 also decreases. Thus,
from the AG equation:
If FIO2 and PB are constant, then as PaCO2 increases both PAO2 and PaO2 will
decrease (hypercapnia causes hypoxemia).
If FIO2 decreases and PB and PaCO2 are constant, both PAO2 and PaO2 will
decrease (suffocation causes hypoxemia).
If PB decreases (e.g., with altitude), and PaCO2 and FIO2 are constant, both
PAO2 and PaO2 will decrease (mountain climbing leads to hypoxemia).
www.ares-italia.orgAlveolar Gas Equation: Test Your
Understanding
1. What is the PAO2 at sea level in the following circumstances?
(Barometric pressure = 760 mm Hg)
a) FIO2 = 1.00, PaCO2 = 30 mm Hg
b) FIO2 = .21, PaCO2 = 50 mm Hg
c) FIO2 = .40, PaCO2 = 30 mm Hg
2. What is the PAO2 on the summit of Mt. Everest in the
following circumstances? (Barometric pressure = 253 mm
Hg)
a) FIO2 = .21, PaCO2 = 40 mm Hg
b) FIO2 = 1.00, PaCO2 = 40 mm Hg
c) FIO2 = .21, PaCO2 = 10 mm Hg
www.ares-italia.orgAlveolar Gas Equation:
Test Your Understanding - Answers
1. To calculate PAO2 the PaCO2 must be subtracted from the PIO2. Again, the
barometric pressure is 760 mm Hg since the values are obtained at sea level. In
part a, the PaCO2 of 30 mm Hg is not multiplied by 1.2 since the FIO2 is 1.00. In
parts b and c, PaCO2 is multiplied by the factor 1.2.
a) PAO2 = 1.00 (713) - 30 = 683 mm Hg
b) PAO2 = .21 (713) - 1.2 (50) = 90 mm Hg
c) PAO2 = .40 (713) - 1.2 (30) = 249 mm Hg
2. The PAO2 on the summit of Mt. Everest is calculated just as at sea level, using
the barometric pressure of 253 mm Hg.
a) PAO2 = .21 (253 - 47) - 1.2 (40) = - 5 mm Hg
b) PAO2 = 1.00 (253 - 47) - 40 = 166 mm Hg
c) PAO2 = .21 (253 - 47) - 1.2 (10) = 31 mm Hg
www.ares-italia.orgP(A-a)O2
P(A-a)O2 is the alveolar-arterial difference in partial pressure of oxygen. It is
commonly called the “A-a gradient,” though it does not actually result from an O2
pressure gradient in the lungs. Instead, it results from gravity-related blood flow
changes within the lungs (normal ventilation-perfusion imbalance).
PAO2 is always calculated based on FIO2, PaCO2, and barometric pressure.
PaO2 is always measured on an arterial blood sample in a “blood gas machine.”
Normal P(A-a)O2 ranges from 5 to 25 mm Hg breathing room air (it increases
with age). A higher than normal P(A-a)O2 means the lungs are not transferring
oxygen properly from alveoli into the pulmonary capillaries. Except for right to
left cardiac shunts, an elevated P(A-a)O2 signifies some sort of problem within
the lungs.
www.ares-italia.orgPhysiologic Causes of Low PaO2
NON-RESPIRATORY P(A-a)O2
Cardiac right-to-left shunt Increased
Decreased PIO2 Normal
Low mixed venous oxygen content* Increased
RESPIRATORY P(A-a)O2
Pulmonary right-to-left shunt Increased
Ventilation-perfusion imbalance Increased
Diffusion barrier Increased
Hypoventilation (increased PaCO2) Normal
* Unlikely to be clinically significant unless there is right-to-left shunting or ventilation-perfusion imbalance
www.ares-italia.orgVentilation-perfusion Imbalance
A normal amount of ventilation-perfusion (V-Q) imbalance
accounts for the normal P(A-a)O2.
By far the most common cause of low PaO2 is an abnormal
degree of ventilation-perfusion imbalance within the hundreds of
millions of alveolar-capillary units. Virtually all lung disease
lowers PaO2 via V-Q imbalance, e.g., asthma, pneumonia,
atelectasis, pulmonary edema, COPD.
Diffusion barrier is seldom a major cause of low PaO2 (it can
lead to a low PaO2 during exercise).
www.ares-italia.orgP(A-a)O2: Test Your Understanding
For each of the following scenarios, calculate the P(A-a)O2 using the
abbreviated alveolar gas equation; assume PB = 760 mm Hg. Which
of these patients is most likely to have lung disease? Do any of the
values represent a measurement or recording error?
a) A 35-year-old man with PaCO2 50 mm Hg, PaO2 150 mm Hg, FIO2 0.40.
b) A 44-year-old woman with PaCO2 75 mm Hg, PaO2 95 mm Hg, FIO2 0.28
c) A young, anxious man with PaO2 120 mm Hg, PaCO2 15 mm Hg, FIO2 0.21
www.ares-italia.orgP(A-a)O2: Test Your Understanding-Answers
a) PAO2 = .40 (760 - 47) - 1.2 (50) = 225 mm Hg; P(A-a)O2 = 225 - 150 = 75
mm Hg
The P(A-a)O2 is elevated but actually within the expected range for
supplemental oxygen at 40%, so the patient may or may not have a defect
in gas exchange.
b) PAO2 = 0.28 (713) - 1.2 (75) = 200 - 90 = 110 mm Hg; P(A-a)O2 = 110 - 95
= 15 mm Hg
Despite severe hypoventilation, there is no evidence here for lung disease.
Hypercapnia is most likely a result of disease elsewhere in the respiratory
system, either the central nervous system or chest bellows.
c) PAO2 = 0.21 (713) - 1.2 (15) = 150 - 18 = 132 mm Hg; P(A-a)O2 = 132 -
120 = 12 mm Hg
Hyperventilation can easily raise PaO2 above 100 mm Hg when the lungs
are normal, as in this case.
www.ares-italia.orgSaO2 and Oxygen Content
Tissues need a requisite amount of oxygen molecules for
metabolism. Neither the PaO2 nor the SaO2 tells how much oxygen
is in the blood. How much is provided by the oxygen content, CaO2
(units = ml O2/dl). CaO2 is calculated as:
CaO2 = quantity O2 bound + quantity O2 dissolved
to hemoglobin in plasma
CaO2 = (Hb x 1.34 x SaO2) + (.003 x PaO2)
Hb = hemoglobin in gm%; 1.34 = ml O2 that can be bound to each
gm of Hb; SaO2 is percent saturation of hemoglobin with oxygen;
.003 is solubility coefficient of oxygen in plasma: .003 ml dissolved
O2/mm Hg PO2.
www.ares-italia.orgOxygen Dissociation Curve: SaO2 vs. PaO2
Also shown are CaO2 vs. PaO2 for two different hemoglobin contents: 15 gm% and 10 gm%. CaO2 units are ml O2/dl.
P50 is the PaO2 at which SaO2 is 50%.
Point “X” is discussed on later slide.
www.ares-italia.orgSaO2 – Is it Calculated or Measured?
You always need to know this when confronted with blood gas data.
SaO2 is measured in a “co-oximeter.” The traditional “blood gas
machine“ measures only pH, PaCO2, and PaO2,, whereas the co-
oximeter measures SaO2, carboxyhemoglobin, methemoglobin, and
hemoglobin content. Newer “blood gas” consoles incorporate a co-
oximeter, and so offer the latter group of measurements as well as
pH, PaCO2, and PaO2.
You should always make sure the SaO2 is measured, not
calculated. If SaO2 is calculated from PaO2 and the O2-dissociation
curve, it provides no new information and could be inaccurate -
especially in states of CO intoxication or excess methemoglobin.
CO and metHb do not affect PaO2, but do lower the SaO2.
www.ares-italia.orgCarbon Monoxide – An Important
Cause of Hypoxemia
Normal percentage of COHb in the blood is 1 - 2%, from metabolism and small
amount of ambient CO (higher in traffic-congested areas).
CO is colorless, odorless gas, a product of combustion; all smokers have
excess CO in their blood, typically 5 -10%.
CO binds 200x more avidly to hemoglobin than O2, effectively displacing O2
from the heme binding sites. CO is a major cause of poisoning deaths world-
wide.
CO has a “double-whammy” effect on oxygenation: 1) decreases SaO2 by the
percentage of COHb present, and 2) shifts the O2-dissociation curve to the left,
retarding unloading of oxygen to the tissues.
CO does not affect PaO2, only SaO2. To detect CO poisoning, SaO2 and/or
COHb must be measured (requires co-oximeter). In the presence of excess
CO, SaO2 (when measured) will be lower than expected from the PaO 2.
www.ares-italia.orgCO Does Not Affect PaO2 – Be Aware!
Review the O2 dissociation curve shown on a previous slide. “X”
represents the 2nd set of blood gases for a patient who presented
to the ER with headache and dyspnea.
His first blood gases showed PaO2 80 mm Hg, PaCO2 38 mm
Hg, pH 7.43. SaO2 on this first set was calculated from the O2-
dissociation curve as 97%, and oxygenation was judged normal.
He was sent out from the ER and returned a few hours later with
mental confusion; this time both SaO2 and COHb were
measured (SaO2 shown by “X”): PaO2 79 mm Hg, PaCO2 31
mm Hg, pH 7.36, SaO2 53%, carboxyhemoglobin 46%.
CO poisoning was missed on the first set of blood gases
because SaO2 was not measured!
www.ares-italia.orgCauses of Hypoxia
A General Classification
1. Hypoxemia (= low PaO2 and/or low CaO2)
a. reduced PaO2 – usually from lung disease (most common physiologic mechanism: V-Q
imbalance)
b. reduced SaO2 – most commonly from reduced PaO2; other causes include carbon
monoxide poisoning, methemoglobinemia, or rightward shift of the O2-dissociation curve
c. reduced hemoglobin content – anemia
2. Reduced oxygen delivery to the tissues
a. reduced cardiac output – shock, congestive heart failure
b. left-to-right systemic shunt (as may be seen in septic shock)
3. Decreased tissue oxygen uptake
a. mitochondrial poisoning (e.g., cyanide poisoning)
b. left-shifted hemoglobin dissociation curve (e.g., from acute alkalosis, excess CO, or
abnormal hemoglobin structure)
www.ares-italia.orgHow much oxygen is in the blood, and is it
adequate for the patient?
PaO2 vs. SaO2 vs. CaO2
The answer must be based on some oxygen value, but which one?
Blood gases give us three different oxygen values: PaO2, SaO2,
and CaO2 (oxygen content).
Of these three values, PaO2, or oxygen pressure, is the least
helpful to answer the question about oxygen adequacy in the
blood. The other two values - SaO2 and CaO2 - are more useful for
this purpose.
www.ares-italia.orgHow much oxygen is in the blood?
PaO2 vs. SaO2 vs. CaO2
OXYGEN PRESSURE: PaO2
Since PaO2 reflects only free oxygen molecules dissolved in plasma and not those bound to
hemoglobin, PaO2 cannot tell us “how much” oxygen is in the blood; for that you need to know how
much oxygen is also bound to hemoglobin, information given by the SaO2 and hemoglobin content.
OXYGEN SATURATION: SaO2
The percentage of all the available heme binding sites saturated with oxygen is the hemoglobin
oxygen saturation (in arterial blood, the SaO2). Note that SaO2 alone doesn’t reveal how much
oxygen is in the blood; for that we also need to know the hemoglobin content.
OXYGEN CONTENT: CaO2
Tissues need a requisite amount of O2 molecules for metabolism. Neither the PaO2 nor the SaO2
provide information on the number of oxygen molecules, i.e., how much oxygen is in the blood.
(Neither PaO2 nor SaO2 have units that denote any quantity.) Only CaO2 (units ml O2/dl) tells us how
much oxygen is in the blood; this is because CaO2 is the only value that incorporates the hemoglobin
content. Oxygen content can be measured directly or calculated by the oxygen content equation:
CaO2 = (Hb x 1.34 x SaO2) + (.003 x PaO2)
www.ares-italia.orgSaO2 and CaO2: Test Your Understanding
Below are blood gas results from four pairs of patients. For each
letter pair, state which patient, (1) or (2), is more hypoxemic.
Units for hemoglobin content (Hb) are gm% and for PaO2 mm Hg.
a) (1) Hb 15, PaO2 100, pH 7.40, COHb 20%
(2) Hb 12, PaO2 100, pH 7.40, COHb 0
b) (1) Hb 15, PaO2 90, pH 7.20, COHb 5%
(2) Hb 15, PaO2 50, pH 7.40, COHb 0
c) (1) Hb 5, PaO2 60, pH 7.40, COHb 0
(2) Hb 15, PaO2 100, pH 7.40, COHb 20%
d) (1) Hb 10, PaO2 60, pH 7.30, COHb 10%
(2) Hb 15, PaO2 100, pH 7.40, COHb 15%
www.ares-italia.orgSaO2 and CaO2: Test Your Understanding-Answers
a) (1) CaO2 = .78 x 15 x 1.34 = 15.7 ml O2/dl
(2) CaO2 = .98 x 12 x 1.34 = 15.8 ml O2/dl
The oxygen contents are almost identical, and therefore neither patient is more hypoxemic.
However, patient (1), with 20% CO, is more hypoxic than patient (2) because of the left-shift of
the O2-dissociation curve caused by the excess CO.
b) (1) CaO2 = .87 x 15 x 1.34 = 17.5 ml O2/dl
(2) CaO2 = .85 x 15 x 1.34 = 17.1 ml O2/dl
A PaO2 of 90 mm Hg with pH of 7.20 gives an SaO2 of @ 92%; subtracting 5% COHb from this
value gives a true SaO2 of 87%, used in the CaO2 calculation of patient (1). A PaO2 of 50 mm
Hg with normal pH gives an SaO2 of 85%. Thus patient (2) is slightly more hypoxemic.
c) (1) CaO2 = .90 x 5 x .1.34 = 6.0 ml O2/dl
(2) CaO2 = .78 x 15 x 1.34 = 15.7 ml O2/dl
Patient (1) is more hypoxemic, because of severe anemia.
d) (1) CaO2 = .87 x 10 x .1.34 = 11.7 ml O2/dl
(2) CaO2 = .83 x 15 x 1.34 = 16.7 ml O2/dl
Patient (1) is more hypoxemic.
www.ares-italia.orgAcid-base Balance
Henderson-Hasselbalch Equation
[HCO3-]
pH = pK + log ----------------
.03 [PaCO2]
For teaching purposes, the H-H equation can be
shortened to its basic relationships:
HCO3-
pH ~ ---------
PaCO2
www.ares-italia.orgpH is inversely related to [H+]; a pH change of
1.00 represents a 10-fold change in [H+]
pH [H+] in nanomoles/L
7.00 100
7.10 80
7.30 50
7.40 40
7.52 30
7.70 20
8.00 10
www.ares-italia.orgAcid-base Terminology
Acidemia: blood pH < 7.35
Acidosis: a primary physiologic process that, occurring alone,
tends to cause acidemia. Examples: metabolic acidosis from
decreased perfusion (lactic acidosis); respiratory acidosis from
hypoventilation. If the patient also has an alkalosis at the same
time, the resulting blood pH may be low, normal, or high.
Alkalemia: blood pH > 7.45
Alkalosis: a primary physiologic process that, occurring alone,
tends to cause alkalemia. Examples: metabolic alkalosis from
excessive diuretic therapy; respiratory alkalosis from acute
hyperventilation. If the patient also has an acidosis at the same
time, the resulting blood pH may be high, normal, or low.
www.ares-italia.orgAcid-base Terminology (cont.)
Primary acid-base disorder: One of the four acid-base disturbances that
is manifested by an initial change in HCO3- or PaCO2. They are:
metabolic acidosis (MAc), metabolic alkalosis (MAlk), respiratory acidosis
(RAc), and respiratory alkalosis (RAlk).
If HCO3- changes first, the disorder is either MAc (reduced HCO3- and
acidemia) or MAlk (elevated HCO3- and alkalemia). If PaCO2 changes
first, the problem is either RAlk (reduced PaCO2 and alkalemia) or RAc
(elevated PaCO2 and acidemia).
Compensation: The change in HCO3- or PaCO2 that results from the
primary event. Compensatory changes are not classified by the terms
used for the four primary acid-base disturbances. For example, a patient
who hyperventilates (lowers PaCO2) solely as compensation for MAc does
not have a RAlk, the latter being a primary disorder that, alone, would lead
to alkalemia. In simple, uncomplicated MAc the patient will never develop
alkalemia.
www.ares-italia.orgPrimary Acid-base Disorders:
Respiratory Alkalosis
Respiratory alkalosis - A primary disorder where the first change is
a lowering of PaCO2, resulting in an elevated pH. Compensation
(bringing the pH back down toward normal) is a secondary lowering
of bicarbonate (HCO3) by the kidneys; this reduction in HCO3- is not
metabolic acidosis, since it is not a primary process.
Primary Event Compensatory Event
HCO3- ↓HCO3-
↑ pH ~ ------- ↑ pH ~ --------
↓ PaCO2 ↓ PaCO2
www.ares-italia.orgPrimary Acid-base Disorders:
Respiratory Acidosis
Respiratory acidosis - A primary disorder where the first change
is an elevation of PaCO2, resulting in decreased pH.
Compensation (bringing pH back up toward normal) is a
secondary retention of bicarbonate by the kidneys; this elevation
of HCO3- is not metabolic alkalosis since it is not a primary
process.
Primary Event Compensatory Event
HCO3- ↑ HCO3-
↓ pH ~ --------- ↓ pH ~ ---------
↑PaCO2 ↑ PaCO2
www.ares-italia.orgPrimary Acid-base Disorders:
Metabolic Acidosis
Metabolic acidosis - A primary acid-base disorder where the
first change is a lowering of HCO3-, resulting in decreased pH.
Compensation (bringing pH back up toward normal) is a
secondary hyperventilation; this lowering of PaCO2 is not
respiratory alkalosis since it is not a primary process.
Primary Event Compensatory Event
↓ HCO3- ↓HCO3-
↓ pH ~ ------------ ↓ pH ~ ------------
PaCO2 ↓ PaCO2
www.ares-italia.orgPrimary Acid-base Disorders:
Metabolic Alkalosis
Metabolic alkalosis - A primary acid-base disorder where the first change
is an elevation of HCO3-, resulting in increased pH. Compensation is a
secondary hypoventilation (increased PaCO2), which is not respiratory
acidosis since it is not a primary process. Compensation for metabolic
alkalosis (attempting to bring pH back down toward normal) is less
predictable than for the other three acid-base disorders.
Primary Event Compensatory Event
↑ HCO3- ↑HCO3-
↑ pH ~ ------------ ↑ pH ~ ---------
PaCO2 ↑ PaCO2
www.ares-italia.orgAnion Gap
Metabolic acidosis is conveniently divided into elevated and
normal anion gap (AG) acidosis. AG is calculated as
AG = Na+ - (Cl- + CO2)
Note: CO2 in this equation is the “total CO2” measured in the chemistry lab as part of
routine serum electrolytes, and consists mostly of bicarbonate. Normal AG is typically 12
± 4 mEq/L. If AG is calculated using K+, the normal AG is 16 ± 4 mEq/L. Normal values
for AG may vary among labs, so one should always refer to local normal values before
making clinical decisions based on the AG.
www.ares-italia.orgMetabolic Acid-base Disorders:
Some Clinical Causes
METABOLIC ACIDOSIS ↓HCO3- & ↓ pH
- Increased anion gap
• lactic acidosis; ketoacidosis; drug poisonings (e.g., aspirin, ethylene
glycol, methanol)
- Normal anion gap
• diarrhea; some kidney problems (e.g., renal tubular acidosis, interstitial
nephritis)
METABOLIC ALKALOSIS ↑ HCO3- & ↑ pH
Chloride responsive (responds to NaCl or KCl therapy): contraction alkalosis,
diuretics, corticosteroids, gastric suctioning, vomiting
Chloride resistant: any hyperaldosterone state (e.g., Cushing’s syndrome,
Bartter’s syndrome, severe K+ depletion)
www.ares-italia.orgRespiratory Acid-base Disorders:
Some Clinical Causes
RESPIRATORY ACIDOSIS ↑PaCO2 & ↓ pH
Central nervous system depression (e.g., drug overdose)
Chest bellows dysfunction (e.g., Guillain-Barré syndrome, myasthenia
gravis)
Disease of lungs and/or upper airway (e.g., chronic obstructive lung
disease, severe asthma attack, severe pulmonary edema)
RESPIRATORY ALKALOSIS ↓PaCO2 & ↑ pH
Hypoxemia (includes altitude)
Anxiety
Sepsis
Any acute pulmonary insult (e.g., pneumonia, mild asthma attack, early
pulmonary edema, pulmonary embolism)
www.ares-italia.orgMixed Acid-base Disorders are Common
In chronically ill respiratory patients, mixed disorders are
probably more common than single disorders, e.g., RAc +
MAlk, RAc + Mac, Ralk + MAlk.
In renal failure (and other conditions) combined MAlk + MAc is
also encountered.
Always be on the lookout for mixed acid-base disorders. They
can be missed!
www.ares-italia.orgTips to Diagnosing Mixed
Acid-base Disorders
TIP 1. Do not interpret any blood gas data for acid-base diagnosis
without closely examining the serum electrolytes: Na+, K+, Cl-,
and CO2.
• A serum CO2 out of the normal range always represents some type of
acid-base disorder (barring lab or transcription error).
• High-serum CO2 indicates metabolic alkalosis &/or bicarbonate retention
as compensation for respiratory acidosis.
• Low-serum CO2 indicates metabolic acidosis &/or bicarbonate excretion
as compensation for respiratory alkalosis.
• Note that serum CO2 may be normal in the presence of two or more
acid-base disorders.
www.ares-italia.orgTips to Diagnosing Mixed Acid-base
Disorders (cont.)
TIP 2. Single acid-base disorders do not lead to normal blood pH.
Although pH can end up in the normal range (7.35 - 7.45) with a
single mild acid-base disorder, a truly normal pH with distinctly
abnormal HCO3- and PaCO2 invariably suggests two or more
primary disorders.
Example: pH 7.40, PaCO2 20 mm Hg, HCO3- 12 mEq/L in a patient with
sepsis. Normal pH results from two co-existing and unstable acid-base
disorders - acute respiratory alkalosis and metabolic acidosis.
www.ares-italia.orgTips to Diagnosing Mixed Acid-base
Disorders (cont)
TIP 3. Simplified rules predict the pH and HCO3- for a given
change in PaCO2. If the pH or HCO3- is higher or lower than
expected for the change in PaCO2, the patient probably has a
metabolic acid-base disorder as well.
The next slide shows expected changes in pH and HCO3- (in
mEq/L) for a 10-mm Hg change in PaCO2 resulting from either
primary hypoventilation (respiratory acidosis) or primary
hyperventilation (respiratory alkalosis).
www.ares-italia.orgExpected changes in pH and HCO3- for a 10-mm Hg change in
PaCO2 resulting from either primary hypoventilation (respiratory
acidosis) or primary hyperventilation (respiratory alkalosis):
ACUTE CHRONIC
Resp Acidosis
pH ↓ by 0.07 pH ↓ by 0.03
HCO3- ↑ by 1* HCO3- ↑ by 3 - 4
Resp Alkalosis
pH ↑ by 0.08 pH ↑ by 0.03
HCO3- ↓ by 2 HCO3- ↓ by 5
* Units for HCO3- are mEq/L
www.ares-italia.orgSummary: Clinical and Laboratory Approach
to Acid-base Diagnosis
Determine existence of acid-base disorder from arterial blood
gas and/or serum electrolyte measurements. Check serum CO2;
if abnormal, there is an acid-base disorder. If the anion gap is
significantly increased, there is a metabolic acidosis.
Examine pH, PaCO2, and HCO3- for the obvious primary acid-
base disorder and for deviations that indicate mixed acid-base
disorders (TIPS 2 through 4).
www.ares-italia.orgSummary: Clinical and Laboratory
Approach to Acid-base Diagnosis (cont.)
Use a full clinical assessment (history, physical exam, other lab data including
previous arterial blood gases and serum electrolytes) to explain each acid-base
disorder. Remember that co-existing clinical conditions may lead to opposing acid-
base disorders, so that pH can be high when there is an obvious acidosis or low
when there is an obvious alkalosis.
Treat the underlying clinical condition(s); this will usually suffice to correct most acid-
base disorders. If there is concern that acidemia or alkalemia is life-threatening, aim
toward correcting pH into the range of 7.30 - 7.52 ([H+] = 50-30 nM/L).
Clinical judgment should always apply
www.ares-italia.orgEGA-APPROCCIO IN 5 PASSI
secondo approccio ALS (Linee Guida IRC)
1. Come sta il paziente?
• Consente di ottenere dati utili per l’interpretazione dei
risultati
www.ares-italia.orgEGA-APPROCCIO IN 5 PASSI
secondo approccio ALS (Linee Guida IRC)
2. Il paziente é ipossico?
• PaO2 v.n. > 80 (soggetto sano in aria ambiente)
• Rapporto P/F semplice ed utile per stimare la PaO2 in
relazione alla FiO2:
P/F > 300 normale
P/F 200-300 insuff. Respiratoria moderata
P/F < 200 insuff. Respiratoria severa
www.ares-italia.orgEGA-APPROCCIO IN 5 PASSI
secondo approccio ALS (Linee Guida IRC)
3. Il paziente è in acidosi (pH < 7.35) o in alcalosi (pH > 7.45) ?
N.B. Se il pH è nel range normale ciò indica normalità o
condizione cronica con compenso quasi completo.
L’organismo non «sovracompensa» mai e questo fatto ci
consente di individuare il problema primario!
www.ares-italia.orgEGA-APPROCCIO IN 5 PASSI
secondo approccio ALS (Linee Guida IRC)
4. Come è la PaCO2 ?
L’anomalia è dovuta totalmente o parzialmente ad un
problema respiratorio?
PaCO2 > 45 mm Hg con pH < 7,35 Acidosi Respiratoria
PaCO2 < 35 mm Hg con pH > 7,45 Alcalosi Respiratoria
www.ares-italia.orgEGA-APPROCCIO IN 5 PASSI
secondo approccio ALS (Linee Guida IRC)
5. Come si presenta l’Eccesso Basi o il Bicarbonato?
L’anomalia è dovuta totalmente o parzialmente ad un problema
metabolico?
BE o bicarbonato< 22 meq/L con pH < 7,35 Acidosi Metabolica
BE > +2 o bicarbonato >26 meq/L con pH > 7,45 Alcalosi Metabolica
www.ares-italia.orgDISTURBI MISTI
All’EGA si possono riscontrare alterazioni sia della
componente respiratoria che metabolica
pH < 7,40
PaCO2 (>45)
BE (o bicarbonato > 26)
Acidosi respiratoria con alcalosi metabolica compensatoria
www.ares-italia.orgDISTURBI MISTI
All’EGA si possono riscontrare alterazioni sia della
componente respiratoria che metabolica
pH < 7,40
PaCO2 nella norma
BE (o del bicarbonato)
Acidosi metabolica in ritenzione cronica di CO2 (tentativo di
compenso respiratorio in ipercapnia cronica)
www.ares-italia.orgDISTURBI MISTI
All’EGA si possono riscontrare alterazioni sia della
componente respiratoria che metabolica
pH < 7,40
PaCO2 < 35
BE (o del bicarbonato)
Acidosi metabolica con alcalosi respiratoria compensatoria
www.ares-italia.orgDISTURBI MISTI All’EGA si possono riscontrare alterazioni sia della componente respiratoria che metabolica pH > 7,40 PaCO2 > 45 BE o Bicarbonato aumentato Alcalosi metabolica con compenso respiratorio (ad esempio pz con vomito prolungato) www.ares-italia.org
Arterial Blood Gases Execution

www.ares-italia.org
FASE POST-PRELIEVO
  L’infermiere o il medico, nella fase successiva all’esecuzione dell’indagine:
  • preserva l’anaerobiosi del campione raccolto rimuovendo l’ago ed eventuali
    bolle d’aria e avvitando l’apposito occlusore in dotazione;
  • miscela il campione di sangue con l’eparina per evitare formazione di coaguli
    (capovolge lentamente il campione per 5 volte e lo ruota delicatamente fra le
    mani per 20-30 secondi);
  • procede alla lettura del campione entro 15 minuti, altrimenti lo conserva in
    apposito sacchetto immerso in acqua e ghiaccio per un tempo massimo di
    un’ora;
  • smaltisce i rifiuti e ripristina il materiale utilizzato.

www.ares-italia.org
Riferimenti bibliografici
• Principi di interpretazione secondo i criteri della Society
of Critical Care medicine
• Criteri interpretativi secondo ALS (Advanced Life
Support)-Linee Guida ERC-IRC 2015
www.ares-italia.orgGRAZIE PER L’ATTENZIONE www.ares-italia.org
You can also read