ARC Resources Ltd. Investor Presentation - August 2021

Page created by Rhonda Lawson
 
CONTINUE READING
ARC Resources Ltd. Investor Presentation - August 2021
ARC Resources Ltd.
Investor Presentation
August 2021
ARC Resources Ltd. Investor Presentation - August 2021
ARC Is the Largest Pure-play Montney Producer
                                                                                                                                                                        Shares outstanding                                                    725 million

                                                                                                                                                                        Market capitalization1                                                $6.9 billion

                                                                                                                                                                        Net debt2                                                             $2.1 billion

                                                                                                                                                                        Enterprise value1 2                                                   $9.0 billion

                                                                                                                                                                        Quarterly dividend3                                               $0.066/share

                                                                                                                                                                        Dividend yield4                                                              2.8%

                                                                                                                                                                       Montney production5
                                                                                                                                                                       Mboe/day
                                                                                                                                                                                                           ~340
                                                                                                                                                                                        2%
                                                                                                                                                                                              22%

                                                                                                                                                                                     ~340
                                                                                                                                                                                               15%
                                                                                                                                                                               61%

(1) Market Capitalization as at July 29, 2021.                                                                                                                              Crude oil        Condensate

                                                                                                                                                                                                           ARC

                                                                                                                                                                                                                  Peer

                                                                                                                                                                                                                         Peer

                                                                                                                                                                                                                                Peer

                                                                                                                                                                                                                                       Peer

                                                                                                                                                                                                                                              Peer

                                                                                                                                                                                                                                                     Peer
(2) Net Debt excluding Lease Obligations as at June 30, 2021. Refer to the Advisory Statements to this presentation.

                                                                                                                                                                                                                   1

                                                                                                                                                                                                                          2

                                                                                                                                                                                                                                 3

                                                                                                                                                                                                                                        4

                                                                                                                                                                                                                                               5

                                                                                                                                                                                                                                                      6
(3) ARC’s board of directors has approved a 10% increase to ARC’s quarterly dividend, from $0.06/share to $0.066/share. The dividend increase is effective for ARC’s
    third quarter 2021 dividend, payable on October 15, 2021 to shareholders of record on September 30, 2021.                                                               NGLs             Natural gas
(4) Dividend yield as at July 29, 2021.
(5) Source: Company reports, estimated operated Montney volumes used in the absence of public disclosure.

                                                                          ARC is the premium investment opportunity for exposure to the Montney                                                                                                              2
ARC Resources Ltd. Investor Presentation - August 2021
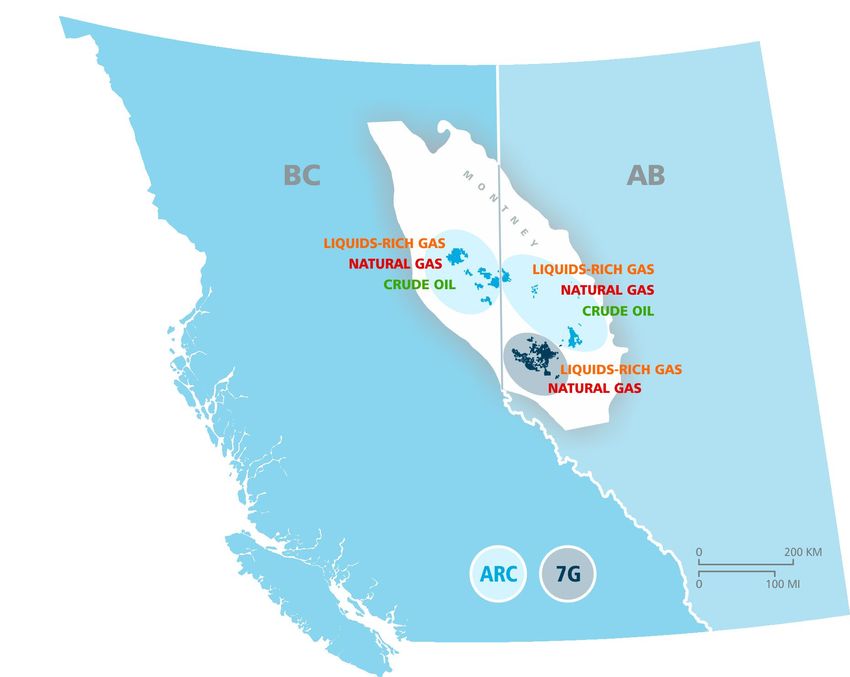
ARC’s Guiding Principles

       Sustainable business                                                                                                     Risk management
                                                                                                                              around all aspects of the                                                                               Superior capital discipline
       model with best-in-class                                                                                                  business, including                                                                                   focused on maximizing free
    people and assets, along with                                                                                                maintaining a strong                                                                                     funds flow1 to optimize
        a relentless focus on                                                                                                 financial position through                                                                                    shareholder returns
       long-term profitability                                                                                                 commodity price cycles

                                                                Owned-and-operated
                                                                                                                                                                               Operational excellence
                                                               infrastructure to support                                                                                      and top-tier ESG performance
                                                                operational control, low cost                                                                                      through efficient and
                                                                  structure, and optimized                                                                                        disciplined execution
                                                                      revenue streams

(1) Free Funds Flow is a non-GAAP measure that does not have any standardized meaning under IFRS and therefore may not be comparable to similar measures presented by other issuers. Refer to the Advisory Statements to this presentation.

                                                                                                                     ARC’s guiding principles are enduring                                                                                                          3
ARC Resources Ltd. Investor Presentation - August 2021
ARC Is a Premier Business
                         Strong balance sheet
                                 Investment-grade credit rating; net debt1 is forecasted to be less than 1.0 time annualized funds from operations by Q3 20212

                         Substantial free funds flow3
                                 Free funds flow3 is forecasted to be ~$1.0 billion in 20212

                         Recently increased dividend by 10%
                                 Dividend is sustainable at less than US$40/bbl WTI and Cdn$1.90/GJ AECO

                         Profitable development runway
                                 Decades’ worth of high-quality inventory maps to a 5% growth rate over the long term

                         Global leader in ESG
                                 Lowest GHG emissions intensity in the sector in Canada; member of the 30% Club

(1) Net Debt excluding Lease Obligations. Refer to the Advisory Statements to this presentation.
(2) Based on forward price curve as at July 29, 2021.
(3) Free Funds Flow is a non-GAAP measure that does not have any standardized meaning under IFRS and therefore may not be comparable to similar measures presented by other issuers. Refer to the Advisory Statements to this presentation.

                                                                                                                                              3
                      ARC delivers financial strength, free funds flow , returns to shareholders, profitable growth, and ESG excellence                                                                                                       4
ARC Resources Ltd. Investor Presentation - August 2021
2021 Outlook
ARC Resources Ltd. Investor Presentation - August 2021
2021 Plan – Executing on ARC’s Disciplined Strategy
                         Fully integrate Seven Generations
                                 Integrate people, assets, and processes while focusing on realizing immediate cost savings and synergies

                         De-risk the business through debt reduction
                                 Maintain investment-grade credit rating and reduce net debt1 to ~1.0 annualized funds from operations

                         Increase return of capital
                                 Sustainably increase dividend by 10% and evaluate instituting normal course issuer bid

                         Sanction and commence development of Attachie West Phase I
                                 Subject to Board approval, execute leading development opportunity in the most efficient and profitable manner possible

(1) Net Debt excluding Lease Obligations. Refer to the Advisory Statements to this presentation.
(2) Free Funds Flow is a non-GAAP measure that does not have any standardized meaning under IFRS and therefore may not be comparable to similar measures presented by other issuers. Refer to the Advisory Statements to this presentation.

                                                                                                                                                                                                                                              2
                                               ARC’s 2021 plan increases total shareholder value and delivers on free funds flow priorities                                                                                                       6
ARC Resources Ltd. Investor Presentation - August 2021
1
Delivering on Free Funds Flow Priorities

    US$55/bbl WTI
                                                                                                                                                                                                                                               Free funds flow1:
  Cdn$2.50/GJ AECO
                                                                                                                                                                                                                                               • Current dividend
                                                                                                                                                                                                                                               • Sustainable dividend
    US$45/bbl WTI                                                                                                                                                                                                                                increases
  Cdn$2.25/GJ AECO                                                                                                                                                                                                                             • Attachie West Phase I
                                                                                                                                                                                                                                               • Share repurchases
                                                                                                                                                                                                                                               • Strategic M&A

    US$40/bbl WTI
                                                                                                                                                                                                                                               Maintenance capital:
  Cdn$1.90/GJ AECO
                                                                                                                                                                                                                                               ~$1.1 billion annually to
                                                                                                                                                                                                                                               sustain production at
                                                                                                                                                                                                                                               ~340,000 boe/day

           Funds from                        Maintenance Capital                            Current Dividend                      Attachie West Phase I Incremental Returns                                                Excess Free Funds
                                                                                                                                                                                                                                     1
           Operations                                                                                                                     Capital         to Shareholders                                                        Flow
                                                                                                                                                                                                                                 Flow

(1) Free Funds Flow is a non-GAAP measure that does not have any standardized meaning under IFRS and therefore may not be comparable to similar measures presented by other issuers. Refer to the Advisory Statements to this presentation.

                    ARC’s maintenance capital and current dividend break-even is less than US$40/bbl WTI and Cdn$1.90/GJ AECO                                                                                                                                              7
ARC Resources Ltd. Investor Presentation - August 2021
Q2 2021 in Review
Dividend increase                                                                                                     Free funds flow1                                                                                                        Net debt2

                                                                                                                                          $249.7 million or                                                                                         $2.1 billion or
                        10% increase
                                                                                                                                            $0.35/share                                                                                             1.3 times FFO

         Quarterly dividend
     increased to $0.066/share                                                                                                    Allocated to net debt2                                                                                       Reduced by $270.8 million
       effective for ARC’s Q3                                                                                                    reduction and dividend                                                                                                or 11%
           2021 dividend

(1) Free Funds Flow is a non-GAAP measure that does not have any standardized meaning under IFRS and therefore may not be comparable to similar measures presented by other issuers. Refer to the Advisory Statements to this presentation.
(2) Net Debt excluding Lease Obligations. Refer to the Advisory Statements to this presentation.

                                                                  Second quarter 2021 results demonstrated strong free funds flow1 generation                                                                                                                              8
ARC Resources Ltd. Investor Presentation - August 2021
$160 Million in Annual Synergies from 7G Acquisition
Synergies expected for 2022

                                                                                                                                                                                                                                                 $160 million
 180

                                                                                                                                                                                                                                                     Synergies
                                                                                                                                                                                                                     $25 million
 150

                                                                                                                                                                                        $25 million

                                                                                                                                  $15 million
 120

                                                                                                1
                                                                         $50 million
  90

  60

                  $45 million
                                                                                                                                                                                                                                                 Synergies Captured
  30

   0

               Corporate Costs                                          Finance Costs                                    Operating Efficiencies                                      Market Optimization   Drilling & Completions Efficiencies     Annual Synergies

(1) Finance costs are expected to be approximately $50 million lower for the combined entity than they would have been if the Seven Generations senior notes remained outstanding.

                                                                 ARC estimates that over half of identified synergies have been captured to-date                                                                                                                      9
ARC Resources Ltd. Investor Presentation - August 2021
De-risking the Business through Debt Reduction
Long-term notes repayment schedule1                                                                                                 2021 forecasted net debt2 sensitivities
Cdn$ millions                                                                                                                       $ billions, ratio

  600                                                                                                                                2,000                                                                     2.0

  450                                                                                                            3.72% US$ Note
                                                                                                                                     1,500                                                                     1.5
                                                                                                                 8.21% US$ Note
                                                                                                                 5.36% US$ Note
  300                                                                                                            3.31% US$ Note
                                                                                                                                     1,000                                                                     1.0
                                                                                                                 3.81% US$ Note
  150                                                                                                            4.49% Cdn$ Note
                                                                                                                 2.354% Cdn$ Note      500                                                                     0.5
                                                                                                                 3.465% Cdn$ Note
       0
               2021

                        2022

                                 2023

                                          2024

                                                   2025

                                                            2026

                                                                     2027

                                                                              2028

                                                                                       2029

                                                                                                   2030

                                                                                                          2031

                                                                                                                                         0                                                                     0.0
                                                                                                                                             US$40/bbl WTI & US$50/bbl WTI & US$60/bbl WTI & US$70/bbl WTI &
                                                                                                                                             US$2.30/MMBtu US$2.60/MMBtu US$2.90/MMBtu US$3.20/MMBtu
ARC has ample liquidity                                                                                                                       NYMEX Henry     NYMEX Henry     NYMEX Henry     NYMEX Henry
  + $2.0 billion unsecured extendible revolving credit facility                                                                                   Hub             Hub             Hub             Hub

  + $1.9 billion of available liquidity                                                                                                       Net Debt (LHS)      Net Debt to Funds from Operations (RHS)

(1) Assumes Cdn$/US$ exchange rate of 1.2405 as at June 30, 2021.
(2) Net Debt excluding Lease Obligations. Refer to the Advisory Statements to this presentation.

                                                                                      Investment-grade credit rating allows for access to low-cost debt                                                              10
Evaluating Strategic M&A Opportunities

                         Assets must be as good or better than ARC’s existing assets

                         Infrastructure must be largely owned and operated

                         Assets must have similar ESG characteristics and performance

                         Assets must be able to increase free funds flow1 per share at various commodity scenarios

                         Opportunity can create scale and/or unique synergies

(1) Free Funds Flow is a non-GAAP measure that does not have any standardized meaning under IFRS and therefore may not be comparable to similar measures presented by other issuers. Refer to the Advisory Statements to this presentation.

   ARC has no holes in its portfolio but will continue to evaluate strategic M&A opportunities with the Company’s screening criteria                                                                                                          11
Industry-leading Financial Performance amongst Peers
Comparative cash returns1 2                                                                                                                                                      2022E return on average capital employed3 4

  24%                                                                                                                      Canadian E&Ps                                           20%                                                                                                                    Canadian E&Ps
                                                                                                                            US E&Ps                                                                                                                                                                       US E&Ps

  18%                                                                                                                                                                              15%

  12%                                                                                                                                                                              10%

    6%                                                                                                                                                                               5%

    0%                                                                                                                                                                               0%
                           ARC                                                                                                                                                                                             ARC
                                   Average Free Cash Flow Yield (2021E to 2022E)
                                   Dividend Yield (Current)

(1) Source: Barclays Capital Markets; FactSet (April 2021). Peer group includes North American E&Ps: APA, AR, CLR, CNQ, CNX, COG, COP, CVE, DVN, EOG, EQT, FANG, MRO, OVV, PXD, RRC, SWN, TOU, XEC.
(2) Free Cash Flow Yield is calculated as funds from operations less capital expenditures and dividends.
(3) Source: Peters & Co. “E&P Overview Tables” (July 26, 2021). Peer group includes North American E&Ps: APA, AR, CNQ, COG, DVN, EOG, FANG, OVV, PXD, TOU.
(4) Return on Average Capital Employed is calculated as unhedged cash flow less Peters & Co.’s estimate of required capital spending to maintain flat production volumes year-over-year, expressed as a percentage of capital employed. Capital employed is defined as average shareholders’ equity excluding impairment plus net debt.

   ARC is expected to deliver one of the highest cash return and return on average capital employed amongst its Canadian peers                                                                                                                                                                                                            12
Guidance – Production
                                                                                                                                        Q3 2021 to Q4 2021                                                                               2021                                                 2021 Revised
                                                                                                                                               Guidance1 2                                                                         Guidance1 2                                                  Guidance1 2
  Production
        Crude oil (bbl/day)                                                                                                                                      8,000 - 9,000                                             12,000 - 13,500                                                      9,000 - 10,500
        Condensate (bbl/day)                                                                                                                              72,000 - 78,000                                                  55,000 - 60,000                                                  55,000 - 60,000
        Crude oil and condensate (bbl/day)                                                                                                                80,000 - 87,000                                                  67,000 - 73,500                                                  64,000 - 70,500
        Natural gas (MMcf/day)                                                                                                                                   1,230 - 1,265                                                     1,100 - 1,140                                                    1,100 - 1,140
        NGLs (bbl/day)                                                                                                                                    50,000 - 53,000                                                  40,000 - 42,000                                                  40,000 - 42,000
  Total production (boe/day)                                                                                                                       335,000 - 350,000                                                290,000 - 305,000                                                287,000 - 302,000

   • ARC disposed of its Pembina assets in Q2 2021, and as such, adjusted its guidance for crude oil and total
     production; guidance for condensate, natural gas, and NGLs production remains unchanged
   • Q3 2021 to Q4 2021 production guidance is unchanged at ~340,000 boe/day

(1) ARC acquired Seven Generations Energy Ltd. on April 6, 2021, and as such, 2021 guidance includes ARC’s financial and operational results for the three months ended March 31, 2021, plus the Company’s expectations for the combined financial and operational results of ARC’s and Seven Generations Energy Ltd.’s operations for the
    remainder of 2021.
(2) COVID-19 impacts on demand and market volatility may impact ARC’s future financial and operational results. ARC will continuously monitor its guidance and provide updates as deemed appropriate.

                                                                                                                                                                                                                                                                                                                                             13
Guidance – Expenses and Capital Expenditures
                                                                                                                                                                                                                                                   2021                                       2021 Revised
                                                                                                                                                                                                                                             Guidance1 2                                        Guidance1 2
  Expenses ($/boe)
       Operating                                                                                                                                                                                                                                    4.10 - 4.60                                            3.90 - 4.40
       Transportation                                                                                                                                                                                                                               4.50 - 5.00                                            4.50 - 5.00
       G&A expense before share-based compensation expense3                                                                                                                                                                                         0.90 - 1.00                                            0.90 - 1.00
                                                                                                                                   4
       G&A - share-based compensation expense                                                                                                                                                                                                       0.30 - 0.45                                            0.30 - 0.45
       Transaction costs                                                                                                                                                                                                                            0.20 - 0.30                                            0.20 - 0.30
       Interest and financing                                                                                                                                                                                                                       0.70 - 0.80                                            0.70 - 0.80
  Current income tax expense as a per cent of funds from operations                                                                                                                                                                                                   1-5                                                    1-5
  Capital expenditures before land and net property acquisitions
   (dispositions) ($ millions)                                                                                                                                                                                                                    950 - 1,000                                            950 - 1,000

   • ARC disposed of its Pembina assets in Q2 2021, and as such, lowered its guidance for operating expenses

(1) ARC acquired Seven Generations Energy Ltd. on April 6, 2021, and as such, 2021 guidance includes ARC’s financial and operational results for the three months ended March 31, 2021, plus the Company’s expectations for the combined financial and operational results of ARC’s and Seven Generations Energy Ltd.’s operations for the
    remainder of 2021.
(2) COVID-19 impacts on demand and market volatility may impact ARC’s future financial and operational results. ARC will continuously monitor its guidance and provide updates as deemed appropriate.
(3) Excludes transaction costs associated with the acquisition of Seven Generations Energy Ltd.
(4) Comprises expense recognized under all share-based compensation plans, with the exception of the Deferred Share Unit Plans.
                                                                                                                                                                                                                                                                                                                                             14
Guidance – Capital Program of $950 Million to $1.0 Billion

                        Attachie
                        ~$5MM
                        ~3,500 boe/day
                        Complete detailed engineering
                        work for Attachie West Phase I                                                                                                                                                                                            Ante Creek
                                                                                                                                                                                                                                                  ~$60MM ● 16 wells
                                                                                                                                                                                                                                                  ~17,000 boe/day
                                                                                                                                                                                                                                                  Deliver profitable light oil
                        Greater Dawson                                                                                                                                                                                                            production by leveraging
                                                                                                                                                                                                                                                  2020 facility expansion
                        ~$240MM ● 44 wells
                        ~95,000 boe/day
                        Sustain production and complete
                        small-scale facility sour conversion and                                                                                                                                                                                  Kakwa1
                        optimization project at Parkland/Tower                                                                                                                                                             Kakwa
                                                                                                                                                                                                                                                  ~$525MM ● 55 wells
                                                                                                                                                                                                                                                  ~180,000 boe/day
                                                                                                                                                                                                                                                  Integrate asset and focus
                        Sunrise                                                                                                                                                                                                                   on maximizing free funds
                                                                                                                                                                                                                                                  flow2 generation
                        ~$80MM ● 9 wells
                        ~44,000 boe/day
                        Expand existing facility by 40 MMcf/day
                        and maximize throughput to capitalize on
                        anticipated strength in natural gas pricing
Note: Well counts denote wells drilled in calendar year; number of wells with completions activities in calendar year may vary.
(1) Assets acquired through the Business Combination with Seven Generations Energy Ltd., which closed on April 6, 2021.
(2) Free Funds Flow is a non-GAAP measure that does not have any standardized meaning under IFRS and therefore may not be comparable to similar measures presented by other issuers. Refer to the Advisory Statements to this presentation.

                                                                                                                                                                                                                                              2
                                          Focused on asset integration, sustaining production, and maximizing free funds flow generation                                                                                                                                         15
Asset Overview
Greater Dawson Overview
Snapshot

                                                                                                                                                                        Overview                                                              Low break-evens2

                                                                                                                                                                        Production1                                                           Dawson & Parkland
                                                                                                                                                                        91 Mboe/day (22% liquids)                                             $0.26/Mcf to $0.39/Mcf
                                                                                                                                                                        Land position
               Tower                                                                                                                                                    149,800 net acres (97% W.I.)
                                            Phase I & II
                                            Gas Plants

                                                                                                 Phase III & IV
                                                 Parkland                                         Gas Plants
                                                                                                                                                                        Large resource                                                        Significant optionality
                                                                                           Phase I & II
                                                      Dawson                               Gas Plants
                                                                                                                                                                        Drilling inventory3 4                                                 Integrated infrastructure allows
                                                                                                                                                                        >1,200 locations                                                      ARC to prioritize wells based on
          Pembina & Enbridge              ``                                                                                                                            Years to sustain                                                      return on investment and
          TCPL                                                                                                                                                          ~20 years                                                             prevailing commodity prices
          Parkland-Dawson Interconnect Pipeline

(1) Represents results for the three months ended June 30, 2021.
(2) Break-even prices are at Cdn$/Mcf AECO. Break-even analysis is run on a single commodity and is defined as the price at which NPV10 is equal to zero.
(3) Comprises approximately 20 per cent of 2P booked undeveloped locations and approximately 80 per cent of internal inventory estimates.
(4) Subject to change based on technology and economic environment.
(5) Free Funds Flow is a non-GAAP measure that does not have any standardized meaning under IFRS and therefore may not be comparable to similar measures presented by other issuers. Refer to the Advisory Statements to this presentation.

                                                                                                                                                                                                                                                          5
                 Low reinvestment rates and strong lower Montney liquids performance driving significant free funds flow generation                                                                                                                                              17
Sunrise Overview
Snapshot

                                                                                                                                            Overview                      Low cost structure

                                                                                                                                            Production1                   Operating expense
                                                                                                                                            ~280 MMcf/day                 ~$0.20/Mcf
                                                                                                                                            Optimally positioned for      Finding and development cost
                                                                                                                                            LNG supply                    ~$0.35/Mcf
                                                                                                      Phase I & II
                                                                                                      Gas Plants

                                                                                                                                            Efficient resource            Environmental
                                                                                                                                                                          performance
                                                                                                                                            Land position                 Electrified facility and field drive
                                                                                                                                            23,100 net acres (93% W.I.)   ultra-low emissions profile
                                                                                                                                            Drilling inventory2 3         Up to five layers of development
                                                                                                                                            400 locations                 significantly reduces footprint
          Coastal GasLink

(1) Sunrise facilities expansion of 40 MMcf/day was brought on-stream in May 2021.
(2) Comprises approximately 25 per cent of 2P booked undeveloped locations and approximately 75 per cent of internal inventory estimates.
(3) Subject to change based on technology and economic environment.

                                                                                                       Lowest-cost dry natural gas play in North America                                                         18
Kakwa Overview
Snapshot

                                           Gold Creek
                                           Gas Plant
                                                                                                                                                                        Overview                                                              Near-term objective

                                                                                                                                                                        Production1                                                           Integrate asset into portfolio and
                     Cutbank
                     Gas Plant
                                                                                                                                                                        173 Mboe/day (58% liquids)                                            focus on realizing immediate
                                                                                                                                                                        Land position                                                         operations, drilling, and
                                                                                                                                                                        493,100 net acres (99% W.I.)                                          completions synergies

                                                                    Karr
                                                                   Facility
                                                                                                                                                                        Capital efficiency                                                    Right-size
                                                           Pembina
                                                          Kakwa River
                                                                                                    Lator
                                                                                                   Gas Plant
                                                                                                                                                                        and decline rate                                                      transportation
                                                                                                                                                                                                                                              contracts
                                                                                                                                                                        Focus on improving capital                                            Align transportation levels with
                                                                                                                                                                        efficiencies and reducing decline                                     physical transportation needs to
                                                                                                                                                                        rate of 40% by ~2% per year                                           increase free funds flow2
         NGTL
         Alliance
         Pembina

(1) Represents results for the three months ended June 30, 2021.
(2) Free Funds Flow is a non-GAAP measure that does not have any standardized meaning under IFRS and therefore may not be comparable to similar measures presented by other issuers. Refer to the Advisory Statements to this presentation.

                                                                                                                                                                                                                                                                   2
                             Premium condensate-rich and high-deliverability natural gas play that generates significant free funds flow                                                                                                                                           19
Ante Creek Overview
Snapshot

                                                                                                                                                                        Overview                                                              Stable cash flows

                                                                  2-26                                                                                                  Production1                                                           Balanced commodity mix and
                                                                Gas Plant                                                                                               17 Mboe/day (50% liquids)                                             moderate decline rates
                                                                                                                                                                        Land position                                                         Break-even2
                                                                                                                                                                        122,000 net acres (100% W.I.)                                         US$20/bbl
                                                                                  10-7
                                                                                Gas Plant

                                                                                                                                                                        Efficiency                                                            Optimizing
                                                        10-36
                                                       Gas Plant
                                                                                                                                                                        evolution                                                             infrastructure
                                                                                                                                                                        Well and pad design                                                   Leveraging 2020 facility
                                                                                                                                                                        improvements are delivering                                           expansion to efficiently grow free
                                                                                                                                                                        strong capital efficiencies and                                       funds flow3 profile
                                                                                                                                                                        enhanced profitability

(1) Represents results for the three months ended June 30, 2021.
(2) Break-even prices are at US$/bbl WTI. Break-even analysis is run on a single commodity and is defined as the price at which NPV10 is equal to zero.
(3) Free Funds Flow is a non-GAAP measure that does not have any standardized meaning under IFRS and therefore may not be comparable to similar measures presented by other issuers. Refer to the Advisory Statements to this presentation.

                                                                                                                                                                                                                                                     3
                                                           Highly profitable, stable light oil development generating significant free funds flow                                                                                                                                  20
Attachie Overview
Snapshot

                                                                                                                                                                            Overview                       Significant resource

                                                                                                                                                                            Pilot production1              Resource in place2
                                                                                                                                                                            4.4 Mboe/day (54% liquids)     8.9 Bbbl of liquids
                                                                                                                                                                                                           32 Tcf of gas

                                                                     Phase I

                                       4-20
                                                                    Gas Plant
                                                                                                                                                                            Development                    Delineation
                                      Battery                                                                                                                               potential                      complete
                                                                                                                                                                            Land position                  Piloting activities have set the
                                                                                                                                                                            202,000 net acres (99% W.I.)   stage for efficient execution of
                                                                                                                                                                            Drilling inventory3 4          large-scale development
                                                                                                            Pembina                                                         >1,500 locations
                                                                                                            North Montney Mainline

(1) Represents results for the three months ended June 30, 2021. ARC has been conducting piloting activities in Attachie West in advance of the planned sanctioning of Attachie West Phase I.
(2) Total Petroleum Initially-in-Place as of December 31, 2018.
(3) Comprises approximately two per cent of 2P booked undeveloped locations and approximately 98 per cent of internal inventory estimates.
(4) Subject to change based on technology and economic environment.

                                                                              Attachie is the premier development opportunity within ARC’s portfolio                                                                                          21
Attachie West Phase I Design

      Total                    Condensate and                       Natural Gas                 Forecasted Capital
   Processing                  NGLs Processing                      Processing                      Investment
    Capacity                      Capacity                           Capacity                     (2022 to 2023)

   40 Mboe/day                     25 Mbbl/day                      90 MMcf/day                      ~$600 million

                            Targeted Sanction Date: Q4 2021
                           Targeted On-stream Date: Q3 2023

   Subject to Board approval, ARC is ready to sanction Attachie West Phase I once its debt reduction targets are met   22
Attachie West Phase I Forecasted Cash Flow Profile
 $500,000,000                                                                                                                                                                                                                                                                        45, 000

                                                                                                                                                                                                                                                                                     40, 000

 $400,000,000                                                                                                                                                                                                                                                                        35, 000

                                                                                                                                                                                                                                                                                     30, 000

 $300,000,000                                                                                                                                                                                                                                                                        25, 000

                                                                                                                                                                                                                                                                                     20, 000

 $200,000,000                                                                                                                                                                                                                                                                        15, 000

                                                                                                                                                                                                                                                                                     10, 000

 $100,000,000                                                                                                                                                                                                                                                                        5,0 00

                                                                                                                                                                                                                                                                                     0

           $0                                                                                                                                                                                                                                                                        -5,000
                   2021F

                                                   2022F

                                                                                   2023F

                                                                                                                    2024F

                                                                                                                                                    2025F

                                                                                                                                                                                     2026F

                                                                                                                                                                                                                     2027F

                                                                                                                                                                                                                                              2028F

                                                                                                                                                                                                                                                      2029F

                                                                                                                                                                                                                                                                           2030F
                                                                                                                                                                                                                                                                                     -10,000

($100,000,000)                                                                                                                                                                                                                                                                       -15,000

                                                                                                                                                                                                                                                              Netback1 2
                                                                                                                                                                                                                                                                                     -20,000

($200,000,000)

                                                                                                                                                                                                                                                              Capital Expenditures   -25,000

                                                                                                                                                                                                                                                              Free Funds Flow1 3     -30,000

($300,000,000)                                                                                                                                                                                                                                                Production             -35,000

(1) Economics run at US$55/bbl WTI and US$2.75/MMBtu NYMEX Henry Hub flat pricing.
(2) Netback is a non-GAAP measure that does not have any standardized meaning under IFRS and therefore may not be comparable to similar measures presented by other issuers. Refer to the Advisory Statements to this presentation.
(3) Free Funds Flow is a non-GAAP measure that does not have any standardized meaning under IFRS and therefore may not be comparable to similar measures presented by other issuers. Refer to the Advisory Statements to this presentation.

                                                                                                                                                                                                                                          2
                                Once on-stream, Attachie West Phase I is expected to generate free funds flow of $250 million annually                                                                                                                                                         23
Network of Owned-and-operated Infrastructure
Combined network of owned-and-operated infrastructure

+ Natural gas processing and sales capacity of 1.5 Bcf/day
+ Ability to optimize larger portfolio, which has access to
  downstream markets across North America

Benefits of owned-and-operated infrastructure

+ Lowers cost structure and increases funds from
  operations
+ Provides ability to manage production based upon
  prevailing commodity prices to optimize revenues
+ Retains economics of facility optimization projects

                  Owned-and-operated infrastructure affords greater optionality and control over cost structure   24
ARC’s ESG Excellence
Global oil and gas companies’ relative ESG rankings1 2

                              64

                                                                                                                                                 ARC
Social and Governance Score

                              58
                                                                                                                                                            Africa
                                                                                                                                                            Asia
                                                                                                                                                            Canada
                              52                                                                                                                            Europe
                                                                                                                                                            Latin America
                                                                                                                                                            Middle East
                                                                                                                                                            Russia
                              46
                                                                                                                                                            United States

                              40
                                   38                                           46                                                 54            62    70
                                                                                                                           Environmental Score

(1) Source: BMO Capital Markets; CSRHub; Bloomberg (January 2021).
(2) ARC scores represented are prior to the acquisition of Seven Generations Energy Ltd., which closed on April 6, 2021.

                                         ARC scores amongst the best in the world for environmental, social, and governance performance                                     25
Strong Performance across Key ESG Factors
Environmental                                                                                                           Social                                     Governance
                                                                       1                                                                                                                         1
  Emissions performance                                                                                                 Safety                                     Executive compensation
  + Lowest GHG emissions intensity                                                                                      + #1 corporate priority                    + 95% shareholder approval of ARC’s
    amongst Canadian upstream E&P                                                                                       + Absolute focus on workplace safety for     2021 “say on pay” advisory vote
    companies                                                                                                             employees and contractors                + Majority of executive pay “at risk” and
  + “A-” score by CDP for Climate Change                                                                                                                             tied to medium- and long-term share
    disclosure and performance                                                                                                                                       price and ESG performance

                                      1
  Water usage                                                                                                           Diversity and inclusion                    Board of Directors
  + Responsibly manage water usage in                                                                                   + 30% Club and Bloomberg Gender-           + 9 of 11 directors are independent
    operations                                                                                                            Equality Index member                    + >98% average shareholder approval
  + 90% of water used on ARC’s legacy                                                                                   + 25% of executive team and 36% of           rating in 2021
    assets is recycled                                                                                                    directors are female
  + “B” score by CDP for Water Security
                                                                                                                        Jantzi Social Index constituent

  Minimizing the environmental                                                                                          Stakeholder benefits across all            Governance principles aligned to
  impact of resource development                                                                                        aspects of the business                    shareholder values

(1) Results represented are prior to the acquisition of Seven Generations Energy Ltd., which closed on April 6, 2021.

                                                                       ARC’s ESG commitment leads to joint stakeholder and shareholder benefits                                                                26
ARC’s Resource and Scalability Potential
Drilling locations by area1 2                                                                                Resource potential

  2,000

  1,500

  1,000

      500

          0
                  Attachie            Greater              Kakwa Sundown          Ante    Sunrise Septimus   2020
                                      Dawson                                      Creek                              Base Production   Future Development Projects

(1) Comprises 2P booked undeveloped locations and internal inventory estimates.
(2) Subject to change based on technology and economic environment.

                                         ARC has decades’ worth of premium drilling locations with commodity and geographic optionality                              27
Additional Information
Natural Gas Financial and Physical Price Management
WCSB demand and export capacity growth1                                                                                                Natural gas realizations2 and diversification3 4

                                                                                                                                                               5.00                                                   $4.39

                                                                                                                                                               4.00
                                                                                                                                                                                                                      $1.41    $3.16
                                     5.4 Bcf/day Demand & Export Capacity                                                                                                                             $2.82

                                                                                                                                        Cdn$/Mcf
                                                                                                                                                               3.00                                                                     Realized Gain (Loss) on
                                           Growth Expected by 2025                                                                                                       $2.03       $2.18                                              Risk Management Contracts
                                                                                                                                                               2.00                  $0.02                                              Diversification Activities
                                                                                                                                                                         $0.11                                                 $3.37
                                                                                                                                                                                                      $2.94           $3.19             Average Price before
                                                                                                                                                               1.00      $2.07       $2.26                                              Diversification Activities
                LNG Canada Phase 1                                                                                                                                                                   ($0.06)                  ($0.03)
                                                                                                                                                               0.00     ($0.15)     ($0.10)
                 +2.1 Bcf/day by 2025                                                                                                                                                                ($0.06)        ($0.21)   ($0.18)
                                                                                                                                                               (1.00)
                                                                                 Intra-Alberta Demand                                                                   Q2 2020     Q3 2020          Q4 2020      Q1 2021     Q2 2021
                                                                                  +1.5 Bcf/day by 2025
                                                                                                                                                               100%
                  Enbridge T-South Capacity                                                                                                                                8%                 9%               9%             9%
                     +0.2 Bcf/day by 2021                                                                                                                                  7%
                                                                                                             NGTL East Gate Capacity                                                          9%               9%             12%
                                                                                                                                                                                              6%                                        Dawn Floating
                                                                                                               +1.3 Bcf/day by 2022                             75%                                            14%
                                                                                                                                                                                                                              15%

                                                                                                                                       % of Total Production
                                                                                                                                                                           30%                                                          Malin Floating
                                                                                                                                                                                              24%
                                                          NGTL West Gate Capacity                                                                                                                              15%
                                                                                                                                                                                                                              16%
                                                                                                                                                                                                                                        Henry Hub Floating
                                                            +0.3 Bcf/day by 2023                                                                                50%        14%                                                          Midwest US Floating
                                                                                                                                                                                              21%                                       WCSB Floating
                                                                                                                                                                                                               38%
                                                                                                                                                                                                                              41%       Hedged
                                                                                                                                                                25%
                                                                                                                                                                           41%
                                                                                                                                                                                              31%
                                                                                                                                                                                                               15%
                                                                                                                                                                                                                              7%
                                                                                                                                                                 0%
                                                                                                                                                                         Bal 2021             2022             2023           2024

(1) Source: ARC Risk Research, TC Energy, Enbridge Inc., company reports.
(2) Realized gain (loss) on risk management contracts is not included in ARC’s realized natural gas price.
(3) Diversification based on internal volume and marketing assumptions, adjusted for ARC’s heat content.
(4) “Hedged” includes all physical and financial fixed price swaps, collars, and 3-ways.

                                                                          Well-diversified North American natural gas exposure increases optionality                                                                                                                 29
Canadian Condensate Market
Crude oil and condensate pricing1                                                                                           WCSB condensate supply and demand2 3
US$/bbl                                                                                                                     Mbbl/day

  80                                                                                                                        800

  60                                                                                                                        600

  40                                                                                                                        400

  20                                                                                                                        200

     0                                                                                                                        0
         2017                          2018                           2019                           2020            2021            2017    2018    2019    2020     2021F    2022F   2023F   2024F
                                                  WTI                 Condensate                        WCS                       WCSB Condensate Supply    Imports Required    WCSB Condensate Demand

   • Heavy reliance on imported volumes from the US results in                                                               • WCSB condensate demand is expected to stay well in excess of
     Canadian condensate trading within a very tight range to WTI                                                              local supply for the foreseeable future

(1) Source: Bloomberg.
(2) Source: ARC Risk Research, Alberta Energy Regulator, BC Oil and Gas Commission, Crude Oil Logistics Committee.
(3) Forecast includes the impact of GEI/USD Diluent Recovery Unit assuming 2021 on-stream date.

                                    Continued reliance on imported condensate volumes is constructive for Canadian condensate pricing                                                                    30
Cash Flow Protection
Crude oil and condensate production hedged1                                      Natural gas production hedged1
Mbbl/day, %                                                                      MMBtu/day, %

   48                                                                      60%   720,000                                                     60%

   36                                                                      45%   540,000                                                     45%

   24                                                                      30%   360,000                                                     30%

   12                                                                      15%   180,000                                                     15%

     0                                                                     0%         0                                                      0%
                          Q3 2021             Q4 2021               2022                        Q3 2021          Q4 2021              2022

                                     Production Hedged   % Hedged                                     Production Hedged    % Hedged

(1) Positions as at June 30, 2021.

         Well-hedged with a long-term focus on reducing downside risk in funds from operations and creating certainty in cash flows                31
12
Risk Management Contracts Positions at June 30, 2021
                                                                                            Q3 2021 to Q4 2021                                                2022                                                  2023                                                 2024                                                  2025
Crude Oil – WTI                                                                          US$/bbl           bbl/day                             US$/bbl                    bbl/day                   US$/bbl                     bbl/day                   US$/bbl                    bbl/day                    US$/bbl                    bbl/day
Ceiling                                                                                   53.66            23,500                               58.91                     21,767                     62.35                      12,000                     55.82                      1,243                       -                           -
Floor                                                                                     45.82            23,500                               48.45                     21,767                     51.25                      12,000                     50.00                      1,243                       -                           -
Sold Floor                                                                                40.84             8,000                               40.11                     11,767                     45.00                       5,000                       -                          -                         -                           -
Swap                                                                                      48.30            19,750                               46.90                     10,479                     48.99                        863                        -                          -                         -                           -
Total Crude Oil Volumes (bbl/day)                                                                          43,250                                                         32,246                                                12,863                                                1,243                                                   -

Natural Gas – NYMEX Henry Hub3                                                         US$/MMBtu                  MMBtu/day                 US$/MMBtu                  MMBtu/day                  US$/MMBtu                  MMBtu/day                 US$/MMBtu                  MMBtu/day                  US$/MMBtu                  MMBtu/day
Ceiling                                                                                   3.13                     210,054                     3.13                     119,932                      3.02                      60,000                     2.74                      10,000                        -                         -
Floor                                                                                     2.60                     210,054                     2.60                     119,932                      2.55                      60,000                     2.50                      10,000                        -                         -
Sold Floor                                                                                2.13                     140,000                     2.19                      85,000                      2.17                      30,000                     2.10                      10,000                        -                         -
Swap                                                                                      2.57                     205,000                     2.53                     144,959                      2.53                      52,068                       -                          -                          -                         -
Natural Gas – AECO 7A                                                                   Cdn$/GJ                    GJ/day                    Cdn$/GJ                    GJ/day                     Cdn$/GJ                    GJ/day                    Cdn$/GJ                    GJ/day                     Cdn$/GJ                    GJ/day
Ceiling                                                                                   2.41                     120,000                     2.52                     160,000                      2.42                      95,863                     2.40                      90,000                      2.73                     20,000
Floor                                                                                     1.95                     120,000                     1.99                     160,000                      1.88                      95,863                     1.87                      90,000                      2.00                     20,000
Sold Floor                                                                                  -                          -                       1.75                      20,000                        -                          -                         -                          -                          -                         -
Swap                                                                                      2.29                      80,054                     2.23                      20,000                      2.06                      10,000                     2.06                      10,000                        -                         -
Sold Call                                                                                 4.50                      3,315                      4.50                      2,466                         -                          -                         -                          -                          -                         -
Sold Swaption                                                                               -                          -                       2.00                      20,000                        -                          -                         -                          -                          -                         -
Total Natural Gas Volumes (MMBtu/day)                                                                              604,669                                              435,497                                               212,407                                              104,782                                               18,956

Natural Gas – AECO Basis
 (Differential to NYMEX Henry Hub)                                                     US$/MMBtu                  MMBtu/day                 US$/MMBtu                  MMBtu/day                  US$/MMBtu                  MMBtu/day                 US$/MMBtu                  MMBtu/day                  US$/MMBtu                  MMBtu/day
Sold Swap                                                                                (0.94)                    68,342                     (0.88)                    35,000                      (0.91)                    70,000                     (0.91)                    70,000                      (0.65)                    50,000
Total AECO Basis Volumes (MMBtu/day)                                                                               68,342                                               35,000                                                70,000                                               70,000                                                50,000

Natural Gas – Other Basis
 (Differential to NYMEX Henry Hub)                                                                                MMBtu/day                                            MMBtu/day                                             MMBtu/day                                            MMBtu/day                                             MMBtu/day
Sold Swap                                                                                                          155,000                                              152,438                                               89,918                                                4,973                                                  -

                                                                                       Notional                     Rate                     Notional                     Rate                    Notional                      Rate                    Notional                     Rate                    Notional                      Rate
Foreign Exchange                                                                     (US$ millions)              (Cdn$/US$)                (US$ millions)              (Cdn$/US$)               (US$ millions)               (Cdn$/US$)               (US$ millions)              (Cdn$/US$)               (US$ millions)               (Cdn$/US$)
US$ Forward Sale
 Swap                                                                                      128.6                     1.3351                     116.1                     1.3165                        -                          -                           -                          -                         -                          -
 Ceiling                                                                                    30.8                     1.3093                      69.9                     1.3078                       48.0                     1.3070                         -                          -                         -                          -
 Floor                                                                                      30.8                     1.3441                      69.9                     1.3562                       48.0                     1.3602                         -                          -                         -                          -
US$ Forward Purchase
 Ceiling4                                                                                   10.0                     1.2549                         -                          -                         -                          -                          -                          -                         -                          -
 Floor4                                                                                     10.0                     1.3000                         -                          -                         -                          -                          -                          -                         -                          -
(1) The prices and volumes in this table represent averages for several contracts representing different periods. The average price for the portfolio of options listed above does not have the same payoff profile as the individual option contracts. Viewing the average price of a group of options is purely for indicative purposes. All positions are
    financially settled against the benchmark prices.
(2) ARC has also entered into crude oil differential swaps with a fair value deficiency of $(3.0) million and NGLs location differential swaps with a fair value deficiency of $(0.1) million.
(3) Natural gas prices referenced to NYMEX Henry Hub Last Day Settlement.
(4) Variable rate collar expiring August 23, 2021, whereby if the Cdn$/US$ spot rate is below $1.2825 at expiry, the ceiling will re-adjust to $1.3000.
                                                                                                                                                                                                                                                                                                                                                               32
Asset Details

                                                         Greater Dawson         Sunrise             Kakwa            Ante Creek         Attachie

   Net production – Q2 2021
    Crude oil & liquids (bbl/day)                                  19,972                 43             99,952               8,461            2,380
    Natural gas (MMcf/day)                                          427.5              259.2              437.6                53.2             12.2
    Total (boe/day)                                                91,219             43,242            172,890              17,331            4,418
               1
   Land
    Net sections                                                      231                 36                771                 191              308
    Net acres                                                     149,800             23,100            493,100             122,000          202,000
    Working interest                                                ~97%               ~93%               ~99%               ~100%             ~99%

   PDP Reserves (MMboe)                                               139                  66                 259                  22                7
    Liquids (MMbbl)                                                  26.5                   -               141.2                11.1              3.3
    Gas (Bcf)                                                         679                 394                 708                  67               20

(1) Denote Montney sections and acreage only.

                                                Commodity and geographic diversity across asset portfolio provides optionality                           33
Historical Performance
Production                                                                                                        Net debt1 to FFO                                                                  Dividends2
Mboe/day                                                                                                          $ billions, ratio                                                                 $ billions, % of FFO

  350                                                                                                                2.5                                                                      2.5   8                                                           120%

  280                                                                                                                2.0                                                                      2.0
                                                                                                                                                                                                    6                                                           90%

  210                                                                                                                1.5                                                                      1.5

                                                                                                                                                                                                    4                                                           60%

  140                                                                                                                1.0                                                                      1.0

                                                                                                                                                                                                    2                                                           30%
    70                                                                                                               0.5                                                                      0.5

     0                                                                                                               0.0                                                                      0.0   0                                                           0%

                                                                                                                           2021 YTD
                                                                                                                               1996
                                                                                                                               1997
                                                                                                                               1998
                                                                                                                               1999
                                                                                                                               2000
                                                                                                                               2001
                                                                                                                               2002
                                                                                                                               2003
                                                                                                                               2004
                                                                                                                               2005
                                                                                                                               2006
                                                                                                                               2007
                                                                                                                               2008
                                                                                                                               2009
                                                                                                                               2010
                                                                                                                               2011
                                                                                                                               2012
                                                                                                                               2013
                                                                                                                               2014
                                                                                                                               2015
                                                                                                                               2016
                                                                                                                               2017
                                                                                                                               2018
                                                                                                                               2019
                                                                                                                               2020

                                                                                                                                                                                                        2021 YTD
                                                                                                                                                                                                            1996
                                                                                                                                                                                                            1997
                                                                                                                                                                                                            1998
                                                                                                                                                                                                            1999
                                                                                                                                                                                                            2000
                                                                                                                                                                                                            2001
                                                                                                                                                                                                            2002
                                                                                                                                                                                                            2003
                                                                                                                                                                                                            2004
                                                                                                                                                                                                            2005
                                                                                                                                                                                                            2006
                                                                                                                                                                                                            2007
                                                                                                                                                                                                            2008
                                                                                                                                                                                                            2009
                                                                                                                                                                                                            2010
                                                                                                                                                                                                            2011
                                                                                                                                                                                                            2012
                                                                                                                                                                                                            2013
                                                                                                                                                                                                            2014
                                                                                                                                                                                                            2015
                                                                                                                                                                                                            2016
                                                                                                                                                                                                            2017
                                                                                                                                                                                                            2018
                                                                                                                                                                                                            2019
                                                                                                                                                                                                            2020
         2021 YTD
             1996
             1997
             1998
             1999
             2000
             2001
             2002
             2003
             2004
             2005
             2006
             2007
             2008
             2009
             2010
             2011
             2012
             2013
             2014
             2015
             2016
             2017
             2018
             2019
             2020

                            Montney Natural Gas (boe/day)
                            Non-Montney Natural Gas (boe/day)                                                                            Net Debt (LHS)
                            Montney Crude Oil & Liquids (bbl/day)                                                                        Annualized Funds from Operations (LHS)                               Cumulative Dividend (LHS)
                            Non-Montney Crude Oil & Liquids (bbl/day)                                                                    Net Debt to Annualized Funds from Operations (RHS)                   Dividends as a % of Funds from Operations (RHS)

(1) Net Debt presented for 2021 onwards excludes lease obligations. Refer to the “Capital Management” note in ARC’s financial statements.
(2) Dividends as a per cent of funds from operations calculated as dividends before Dividend Reinvestment Plan and Stock Dividend Program.

                                                                     ARC has managed a profitable business through all commodity price cycles                                                                                                                          34
                                                                     with its efficient Montney assets, capital discipline, and strong balance sheet
12
ESG Recognitions and Rankings

   Member of MSCI Global Sustainability Index                                                                                                      Member of Sustainalytics’ Jantzi Social Index
   MSCI ESG Rating: AAA

   Voluntary participant since 2007
   2020 Climate Change Score: A-                                                                                                                   Member of FTSE Russell’s FTSE4Good Index Series since 2018
   2020 Water Security Score: B

   Environment Score: 4
   Social Score: 3                                                                                                                                 Member of the 30% Club since 2018
   Governance Score: 7

   Score: 31 – High (60th Percentile)                                                                                                              Member of Bloomberg’s Gender-Equality Index since 2021
(1) ARC recognitions and rankings represented are prior to the acquisition of Seven Generations Energy Ltd., which closed on April 6, 2021.
(2) ESG recognitions and rankings as of April 30, 2021.

                                                                              View ARC’s 2020 ESG Report at www.arcresources.com/responsibility                                                                 35
Advisory Statements
Advisory Statements
Notes Regarding Forward-looking Information
This presentation contains certain forward-looking statements and forward-looking information (collectively referred to as "forward-looking information") within the meaning of applicable securities legislation about current
expectations about the future, based on certain assumptions made by ARC. Although ARC believes that the expectations represented by such forward-looking information are reasonable, there can be no assurance that such
expectations will prove to be correct. Forward-looking information in this presentation is identified by words such as "anticipate", "believe", "ongoing", "may", "expect", "estimate", "plan", "will", "project", "continue", "target",
"strategy", "upholding", or similar expressions and includes suggestions of future outcomes. In particular, but without limiting the foregoing, this presentation contains forward-looking information with respect to: estimated
production amounts and quantities thereof; the expectations with respect to the integration of Seven Generations; the anticipated annual synergies for 2022 and the sources thereof; expected capital expenditures for 2021; the
continued integration of Seven Generations' ESG initiatives; plans to publish ARC's 2020 ESG performance data and highlights in the third quarter of 2021; the anticipated reduction in net debt excluding lease obligations; the
continued assessment of dividends and the payment thereof; plans to maintain capital discipline to maximize profitability and preserve a strong financial position and plans to uphold a strong safety culture and advance its ESG
leadership and performance; plans to sustain production at Greater Dawson, Sunrise, Kakwa, and Ante Creek; the Company's guidance estimates; the continued allocation of capital where risk-adjusted return are greatest; plans
to evaluate return of capital measures with excess free funds flow; and other statements.
Readers are cautioned not to place undue reliance on forward-looking information as ARC's actual results may differ materially from those expressed or implied. ARC undertakes no obligation to update or revise any forward-
looking information except as required by law. Developing forward-looking information involves reliance on a number of assumptions and consideration of certain risks and uncertainties, some of which are specific to ARC and
others that apply to the industry generally. Material factors or assumptions on which the forward-looking information in this presentation include: ARC's ability to successfully integrate the business of Seven Generations Energy
Ltd.; access to sufficient capital to pursue any development plans; ARC's ability to issue securities; the impacts the acquisition of Seven Generations Energy Ltd. may have on the current credit ratings of ARC; forecast
commodity prices and other pricing assumptions; forecast production volumes based on business and market conditions; the accuracy of outlooks and projections contained herein; projected capital investment levels, the
flexibility of capital spending plans, and associated sources of funding; achievement of further cost reductions and sustainability thereof; applicable royalty regimes, including expected royalty rates; future improvements in
availability of product transportation capacity; opportunity for ARC to pay dividends and the approval and declaration of such dividends by the board of directors of ARC; cash flows, cash balances on hand, and access to ARC's
credit facility being sufficient to fund capital investments; foreign exchange rates; near-term pricing and continued volatility of the market; the ability of ARC's existing pipeline commitments and financial hedge transactions to
partially mitigate a portion of ARC's risks against wider price differentials; estimates of quantities of crude oil, natural gas, and liquids from properties and other sources not currently classified as proved; accounting estimates and
judgments; future use and development of technology and associated expected future results; ARC's ability to obtain necessary regulatory approvals; the successful and timely implementation of capital projects or stages thereof;
the ability to generate sufficient cash flow to meet current and future obligations; estimated abandonment and reclamation costs, including associated levies and regulations applicable thereto; ARC's ability to obtain and retain
qualified staff and equipment in a timely and cost-efficient manner; ARC's ability to carry out transactions on the desired terms and within the expected timelines; forecast inflation and other assumptions inherent in the guidance
of ARC; the retention of key assets; the continuance of existing tax, royalty, and regulatory regimes; the accuracy of the estimates of each of ARC's and Seven Generations Energy Ltd.’s reserve volumes; ARC's ability to access
and implement all technology necessary to efficiently and effectively operate its assets; the ongoing impact of COVID-19 on commodity prices and the global economy; and other risks and uncertainties described from time to
time in the filings made by ARC with securities regulatory authorities.
The forward-looking information in this presentation also includes financial outlooks and other related forward-looking information (including production and financial-related metrics) relating to ARC, including: the expectations of
ARC regarding free funds flow, free funds flow yield, net debt excluding lease obligations, production, funds from operations, net debt to funds from operations, netback, dividends, maintenance capital, available liquidity, capital
investments, capital expenditures, returns to shareholders, cash returns, return on average capital employed, expenses and expenditures, and anticipated cost savings. Any financial outlook and forward-looking information
implied by such forward-looking statements are described in ARC's MD&A, and its most recent annual information form, which are available on ARC's website at www.arcresources.com and under ARC's SEDAR profile at
www.sedar.com and are incorporated by reference herein.

                                                                                                                                                                                                                                               37
Advisory Statements
Basis of Preparation
All financial figures and information have been prepared in Canadian dollars (which includes references to “dollars” and “$”), except where another currency has been indicated, and in accordance with International Financial
Reporting Standards (“IFRS” or “GAAP”) as issued by the International Accounting Standards Board. Production volumes are presented on a before royalties basis.

Non-GAAP Measures
Certain financial measures in this presentation do not have a standardized meaning as prescribed by IFRS, such as free funds flow, free funds flow yield, return on average capital employed (“ROACE”), and netback, and
therefore are considered non-GAAP measures. See the “Capital Management” note of ARC's unaudited condensed interim consolidated financial statements as at and for the three months ended March 31, 2021 for further
information on other measures contained in this presentation including funds from operations and net debt. These measures may not be comparable to similar measures presented by other issuers. These measures have been
described and presented in order to provide shareholders, potential investors, and analysts with additional measures for analyzing ARC. This additional information should not be considered in isolation or as a substitute for
measures prepared in accordance with IFRS.
Free Funds Flow and Free Funds Flow Yield
Management uses free funds flow as a measure of the efficiency and liquidity of its business, measuring its funds available for capital investment to manage debt levels, pay dividends, and return capital to shareholders. The
Company computes free funds flow as funds from operations generated during the period less capital expenditures before undeveloped land purchases and property acquisitions and dispositions and free funds flow yield by
dividing free funds flow per share by the market price per share. By removing the impact of current period capital expenditures from funds from operations, Management believes this measure provides an indication to investors
and shareholders of the funds the Company has available for future capital allocation decisions.
Netback
ARC calculates netback on a total and per boe basis as commodity sales from production less royalties, operating, and transportation expense. ARC discloses netback both before and after the effect of realized gain or loss on
risk management contracts. Realized gain or loss represent the portion of risk management contracts that have settled in cash during the period and disclosing this impact provides Management and investors with transparent
measures that reflect how ARC’s risk management program can impact its netback. Management believes that netback is a key industry benchmark and a measure of performance for ARC that provides investors with
information that is commonly used by other oil and gas producers. The measurement on a per boe basis assists Management with evaluating operational performance on a comparable basis.
Return on Average Capital Employed
ARC calculates ROACE, expressed as a percentage, as net income (loss) plus interest and total income tax expense (recovery) divided by the average of the opening and closing capital employed for the 12 months preceding
period end. Capital employed is the total of net debt plus shareholders’ equity. ROACE since inception is the annual average net income (loss) plus interest and total income tax expense (recovery) for the years 1996 to 2020
divided by the average of the opening and closing capital employed over the same period. Refer to the “Capital Management” note in ARC’s financial statements for additional discussion on net debt. ARC uses ROACE as a
measure of long-term operational performance, to measure how effectively Management utilizes the capital it has been provided and to demonstrate to shareholders the sustainability of its business model and that capital has
been invested profitably over the long term.

Barrels of Oil Equivalent
Natural gas volumes have been converted to barrels of oil equivalent (“boe”) on the basis of six thousand cubic feet (“Mcf”) to one barrel (“bbl”). Boe may be misleading, particularly if used in isolation. A conversion ratio of 6 Mcf:
1 bbl is based on an energy equivalency conversion method primarily applicable at the burner tip and does not represent value equivalency at the wellhead. Given that the value ratio based on the current price of crude oil
compared with natural gas is significantly different from the energy equivalency conversion ratio of 6:1, utilizing a conversion on a 6:1 basis is not an accurate reflection of value.
Throughout this presentation, crude oil refers to tight, light, medium, and heavy crude oil product types as defined by National Instrument 51-101 Standards of Disclosure for Oil and Gas Activities (“NI 51-101”). Natural gas refers
to shale gas and conventional natural gas product types as defined by NI 51-101. ARC’s production of conventional natural gas is considered to be immaterial. ARC’s core producing properties that are considered to be shale
gas include Attachie, Dawson, Parkland (including parts of Tower), and Sunrise, and as such, natural gas, condensate, and natural gas liquids (“NGLs”) are disclosed. ARC’s core producing properties that are considered to be
tight oil include Ante Creek and parts of Tower, and as such, crude oil, natural gas, and NGLs are disclosed. ARC’s core producing property that is considered to be light crude oil is Pembina, and as such, crude oil, natural gas,
and NGLs are disclosed. NGLs for Kakwa refer to natural gas liquids, except for condensate, which is reported separately. Natural gas for Kakwa refers to conventional natural gas and shale gas combined.
Throughout this presentation, when condensate is disclosed, it is done so as it is the product type that is measured at the first point of sale. As per the Canadian Oil and Gas Evaluation (“COGE”) Handbook, condensate is a by-
product of the NGLs product type. NGLs by-products include ethane, butane, propane, and pentanes-plus (condensate).
                                                                                                                                                                                                                                             38
Advisory Statements
Information Regarding Disclosure on Oil and Gas Reserves, Resources, and Other Oil and Gas Metrics
Unless otherwise specified, all reserves estimates disclosed in this presentation are derived from ARC's independent reserve evaluation prepared by GLJ Ltd. (“GLJ”) dated January 29, 2021, evaluating the crude oil, natural
gas, natural gas liquids, and sulphur reserves attributable to ARC's properties as of December 31, 2020 (the “Reserves Report”), and all resources estimates disclosed in this presentation are derived from ARC's independent
evaluation prepared by GLJ of ARC's lands in the Montney region, including Dawson, Parkland/Tower, Sunrise/Sunset, Sundown, Septimus, Attachie, Red Creek, and Mica in northeast British Columbia, and Pouce Coupe and
Ante Creek in Alberta as of December 31, 2018. The reserve and resource estimates contained herein are estimates only and there is no guarantee that the estimated reserves or resources will be recovered. Actual crude oil,
natural gas, and natural gas liquids reserves may be greater than or less than the estimates that are provided herein. ARC's belief that it will establish additional reserves over time with conversion of resources into reserves and
probable undeveloped reserves into proved reserves are forward-looking statements and are based on certain assumptions and is subject to certain risks, as discussed under the heading “Notes Regarding Forward-looking
Information” and in ARC's annual information form for the year ended December 31, 2018, dated March 14, 2019.
This presentation references “Total Petroleum Initially-In-Place” or “TPIIP”. TPIIP, as defined in the COGE Handbook, is that quantity of petroleum that is estimated to exist in naturally occurring accumulations. It includes that
quantity of petroleum that is estimated, as of a given date, to be contained in known accumulations, prior to production, plus those estimated quantities in accumulations yet to be discovered. A portion of the TPIIP is considered
undiscovered and there is no certainty that any portion of such undiscovered resources will be discovered. If discovered, there is no certainty that it will be commercially viable to produce any portion of such undiscovered
resources. With respect to the portion of the TPIIP that is considered discovered resources, there is no certainty that it will be commercially viable to produce any portion of such discovered resources. A significant portion of the
estimated volumes of TPIIP will never be recovered.
This presentation discloses ARC's expectations of future drilling inventory or locations. While certain of these estimated drilling locations may be consistent with “booked” drilling locations identified in the Reserves Report, as
having associated proved and/or probable reserves, other locations are considered “unbooked” as they have no associated proved and/or probable reserves in the Reserves Report or any associated resources other than
reserves. All drilling locations have been presented on a net basis. Unbooked locations are generated by internal estimates of Management based on prospective acreage and an assumption as to the number of wells that can
be drilled per section based on industry practice and internal review. Unbooked locations do not have attributed reserves or resources. Unbooked locations have been identified by Management as an estimation of the multi-year
drilling activities based on evaluation of applicable geologic, seismic, engineering, historic drilling, production, commodity price assumptions, and reserves information. There is no certainty that all unbooked drilling locations will
be drilled, and if drilled, there is no certainty that such locations will result in additional oil and gas reserves, resources, or production. The drilling locations on which wells are actually drilled will ultimately depend upon the capital
allocation decisions of royalty payors who have working interests in respect of such drilling locations and a number of other factors including, without limitation, availability of capital, regulatory approvals, crude oil and natural gas
prices, costs, actual drilling results, additional reservoir information that is obtained, and other factors. While certain of the unbooked drilling locations have been de-risked by drilling existing wells in relative close proximity to
such unbooked drilling locations, other unbooked drilling locations are farther away from existing wells, where Management has less information about the characteristics of the reservoir and therefore there is more uncertainty
whether wells will be drilled in such locations, and if drilled, there is more uncertainty that such wells will result in additional crude oil and natural gas reserves, resources, or production.
This presentation contains certain oil and gas metrics, including finding and development costs (or “F&D costs”) and reserves life index (or “years to sustain”) which do not have standardized meanings or standard methods of
calculation and therefore such measures may not be comparable to similar measures used by other companies and should not be used to make comparisons. These metrics have been included herein to provide readers with
additional measures to evaluate the Company's performance; however, such measures are not reliable indicators of the future performance of the Company and future performance may not compare to the performance in
previous periods and therefore such metrics should not be unduly relied upon. F&D costs are calculated by dividing the sum of the total capital expenditures for the year, in dollars, by the change in reserves within the applicable
reserves category, in boe. F&D costs, including future development costs (“FDC”), includes all capital expenditures in the year as well as the change in FDC required to bring the reserves, within the specified reserves category,
on production. F&D costs take into account reserves revisions and capital expenditure revisions during the year. The aggregate of the costs incurred in the financial year and changes during that year in estimated FDC may not
reflect total F&D costs related to reserves additions for that year. Management uses F&D costs as a measure of its ability to execute its capital program, the success in doing so, and of ARC's asset quality. Reserves life index or
“years to sustain” are calculated by dividing the reserves (in boe) in the referenced category by the midpoint of the production guidance (in boe) for the following year. Management uses this measure to determine how long the
booked reserves will last at current production rates if no further reserves were added

                                                                                                                                                                                                                                                     39
Advisory Statements
Advisory – Credit Ratings
Credit ratings are intended to provide investors with an independent measure of credit quality of an issue of securities. Credit ratings are not recommendations to purchase, hold, or sell securities and do not address the market
price or suitability of a specific security for a particular investor. There is no assurance that any rating will remain in effect for any given period of time or that any rating will not be revised or withdrawn entirely by the rating agency
in the future if, in its judgment, circumstances so warrant.

Third-party Information
This presentation includes market, industry and economic data which was obtained from various publicly available sources and other sources believed by ARC to be true. Although ARC believes it to be reliable, it has not
independently verified any of the data from third party sources referred to in this presentation or analyzed or verified the underlying reports relied upon or referred to by such sources or ascertained the underlying economic and
other assumptions relied upon by such sources. ARC believes that its market, industry and economic data is accurate and that its estimates and assumptions are reasonable, but there can be no assurance as to the accuracy or
completeness thereof. The accuracy and completeness of the market, industry and economic data used throughout this presentation are not guaranteed and ARC makes no representation as to the accuracy of such information.

                                                                                                                                                                                                                                                    40
Investor Relations Contacts
Kris Bibby                                                    Dale Lewko

Senior Vice President and Chief Financial Officer              Manager, Capital Markets
403.503.8675                                                   403.503.8696
KBibby@arcresources.com                                        DLewko@arcresources.com

Martha Wilmot                                                 General Investor Relations Enquiries

Senior Investor Relations Advisor                              403.503.8600
403.509.7280                                                   1.888.272.4900
MWilmot@arcresources.com                                       IR@arcresources.com

                  Visit ARC’s website at www.arcresources.com and ARC’s SEDAR profile at www.sedar.com   41
You can also read