Applied Mathematics and Nonlinear Sciences - Sciendo
←
→
Page content transcription
If your browser does not render page correctly, please read the page content below

Applied Mathematics and Nonlinear Sciences 6(1) (2021) 283–292

                                    Applied Mathematics and Nonlinear Sciences
                                                                  https://www.sciendo.com

 Predicting stock high price using forecast error with recurrent neural network
 Zhiguo Bao1,†, Qing Wei1,2 , Tingyu Zhou3 , Xin Jiang4 , Takahiro Watanabe3
 1School of Computer and Information Engineering, Henan University of Economics and Law,
 Zhengzhou Henan 450046, China
 2School of Management Engineering, Capital University of Economics and Business, Fengtai Beijing 100070,
 China
 3   Graduate School of Information, Production and Systems, Waseda University, Kitakyushu 808-0135, Japan
 4   National Institute of Technology, Kitakyushu College, Kitakyushu 802-0985, Japan

                                                                                                                         Submission Info
                                                                                                Communicated by Juan Luis García Guirao
                                                                                                          Received December 24th 2020
                                                                                                              Accepted April 11th 2021
                                                                                                        Available online May 25th 2021

     Abstract
     Stock price forecasting is an eye-catching research topic. In previous works, many researchers used a single method or
     combination of methods to make predictions. However, accurately predicting stock prices is very difficult. To improve the
     predicting precision, in this study, an innovative prediction approach was proposed by recurrent substitution of forecast
     error into the historical neural network model through three steps. According to the historical data, the initial predicted
     value of the next day is obtained through the neural network. Then, the prediction error of the next day is obtained through
     the neural network according to the historical prediction error. Finally, the initial predicted value and the prediction error
     are added to obtain the final predicted value of the next day. We use recurrent neural network prediction methods, such
     as Long Short-Term Memory Network Model and Gated Recurrent Unit, which are popular in the recent neural network
     study. In the simulations, the past stock prices of China from June 2010 to August 2017 are used as training data, and those
     from September 2017 to April 2018 are used as test data. The experimental findings demonstrate that the proposed method
     with forecast error gives a more accurate prediction result for the stock’s high price on the next day, which indicates that
     the performance of the proposed one is superior to that of the traditional models without forecast error.

      Keywords: stock price prediction; recurrent neural network; long short-term memory network; gated recurrent unit

 1 Introduction

    Financial time series forecasting uses historical data of financial products to establish a predictive model to
 explore the price fluctuations of financial products, thus guiding investors to make rational investments. Accurate
† Corresponding author.
 Email address: {191613053, 7991056}@qq.com

                               ISSN 2444-8656                                     doi:10.2478/amns.2021.2.00009
     Open Access. © 2021 Bao et al., published by Sciendo.
              This work is licensed under the Creative Commons Attribution alone 4.0 License.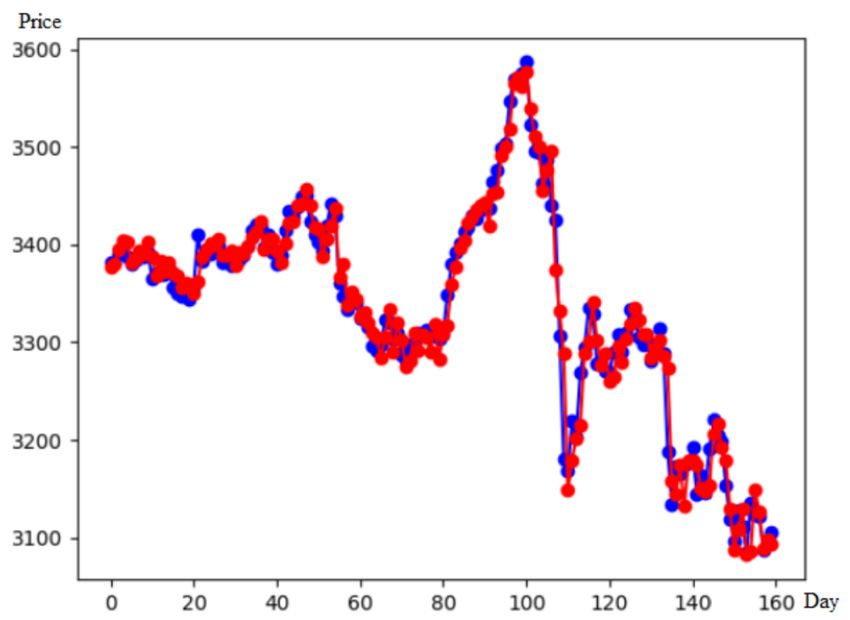
284                       Bao et al. Applied Mathematics and Nonlinear Sciences 6(2021) 283–292

and stable financial forecasting models are crucial for investors to hedge risks and develop money-spinning
investment policies. Therefore, studying the prediction of financial time series is of great significance. However,
the financial market is a complicated nonlinear dynamic system affected by many elements. It is very elusive to
predict financial prices depending on the information obtained.
    Traditional financial time series analysis methods, such as the auto-regressive integrated moving aver-
age (ARIMA) model [1], auto-regressive conditional heteroskedasticity (ARCH) model, and generalised auto-
regressive conditional heteroskedasticity (GARCH) model [2, 3], are based on mathematical statistics, with the
assumption of stationary assumptions, normal distribution assumptions, etc. Analysis by some well-constructed
models requires strict parameters and requires superb modelling skills and rich practical experience. However,
due to the many factors affecting the financial market, the financial time series data is very complex, with high
noise, non-linearity, non-normal characteristics, etc. As a result of these and other related factors, the traditional
analysis methods cannot realise time series analysis in the financial field.
    In recent years, as information technology advances, many new methods and new ideas have been provided
for financial analysis and forecasting. In the financial time series analysis circle, using data mining research
methods and data-driven design models, some shortcomings of traditional time series analysis methods can be
overcome by analysing and processing of large-scale data sets.
    Meanwhile, a deep learning algorithm achieves tremendous progress in portrait recognition, speech recog-
nition, automatic driving, and other fields. Among all deep learning algorithms, Recurrent Neural Network
(RNN) [4, 5] can be considered an ideal financial time sequence analysis algorithm due to its natural sequence
structure.
    The Long Short-Term Memory Network Model (LSTM) [6,7], as a special variant of the RNN, is often used
to process events with long delays or large intervals in time series data. This method has proved its importance
in handwritten digit recognition, question answering systems, and speech recognition. In comparison with the
traditional RNN, the LSTM model is characterised by selective memory and internal interaction of timing. This
feature is very suitable for non-stationary data with the randomness of stock price series. The Gated Recurrent
Unit (GRU) [8,9] is like an LSTM but with fewer parameters than LSTM. GRU has better performance on some
smaller data sets than LSTM.
    In this study, the initial forecast of the stock price is first performed, then the possible error is predicted
and then the initial predicted price and the forecast error are combined to obtain the final predicted value. To
decrease the errors from historical data, we use RNN prediction methods, such as LSTM and GRU, which are
popular in recent years.
    The paper is organised as follows. Section 2 presents the methodologies used in this study. The proposed
model is introduced in Section 3. Section 4 introduces the experimental results. Section 5 summarises the paper.

2 Methodologies

2.1   Multi-Layer Perceptron

    Artificial Neural Networks (ANN) [10, 11] is a research hot spot in the AI circle. It simulates the network
structure of the human brain, and different network models can be constructed according to different connection
methods. It is often referred to directly as the Neural Network (NN).
    Multi-Layer Perceptron (MLP) [12,13] refers to a forward-structured artificial neural network. Its function is
to map input vectors group to output vectors group, as shown in Figure 1. MLP can be considered to be a directed
graph composed of multiple node layers, among which each node connects to the next layer. Every node besides
input nodes is a neuron with non-linear activation. A supervised learning method called a back-propagation
algorithm is usually used to train MLPs.
    In the 1980s, MLP was a popular method with various applications, including image recognition, machine
translation, etc. In recent years, deep learning becomes the focus of people’s attention, and MLP attracts people’s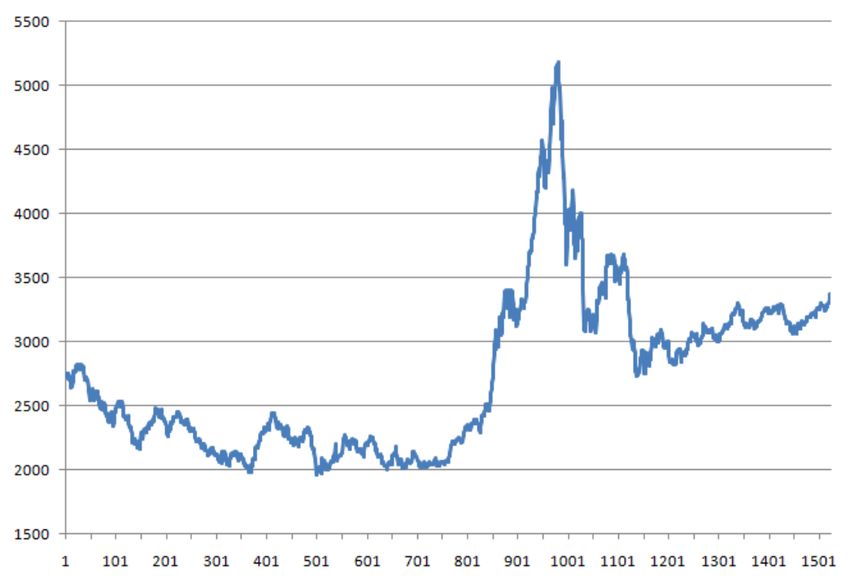
Predicting stock high price using recurrent neural network                   285

attention again.

                                             Fig. 1 An example of MLP.

2.2   Recurrent Neural Network

    RNN [4, 5] is an artificial neural network in which the connected nodes form a directed graph along a
sequence. The RNN can use its internal state as input, enabling it to display the time series’ temporal dynamic
behaviour and thus complete tasks such as handwriting recognition or speech recognition.
    RNN is an easy tool with which to process sequence data. The input of the hidden layer comes from the
output of both the input layer and the previously hidden layer, as shown in Figure 2. In theory, the RNN can
process sequence data of any length. However, in practice, to reduce complexity, the current state is generally
assumed to only relate to certain previous states.

                                             Fig. 2 An example of RNN.

    In contrast with the traditional machine learning model, hidden layer units are thoroughly equal. The hidden
layer in the RNN is a time series from left to right. During the analysis, we often extend the RNN in time to get
the structure shown in Figure 3.

2.3   Long Short-Term Memory

    The LSTM [6, 7] network is an RNN that can process and predict important events with longer intervals
and delays in time series. LSTM is often applied in the technology field in various ways. The systems based
on LSTM can learn tasks such as translation language, speech recognition, handwriting recognition, predictive
disease, and stock forecasting.
286 Bao et al. Applied Mathematics and Nonlinear Sciences 6(2021) 283–292
Fig. 3 Unfolding of RNN in time domain.
The LSTM and RNN are different in that a ‘processor’ is added to the algorithm to identify useful informa-
tion in the LSTM case. The structure of this processor is called a unit. The three doors are arranged in a unit
named the input gate, the forgetting gate and the output gate, as shown in Figure 4. When messages enter the
LSTM network, they will be recognised under the rules. If the information follows the algorithm certification, it
will be left. Otherwise, the unmatched information will be discarded through the Forgotten Gate. LSTM is very
efficient in solving long-order dependency, which is highly versatile and has many possibilities.
Fig. 4 An example of LSTM unit.
A typical model of LSTM is defined as follows:
ft = σ (W f · [ht−1 , xt ] + b f ) (1)
it = σ (Wi · [ht−1 , xt ] + bi ) (2)
C̃t = tanh (Wc · [ht−1 , xt ] + bc ) (3)
Ct = ft ∗Ct−1 + it ∗ Cet (4)
ot = σ (Wo · [ht−1 , xt ] + bo ) (5)
ht = ot ∗ tanh (Ct ) (6)Predicting stock high price using recurrent neural network 287
xt means the input vector at time t, ht means the output vector, ct means the memory cell state, it means the
input gate vector, ft means the forget gate vector, ot means the output gate vector, Wi , Wf , Wo and Wc mean the
weight matrices, bi , bf , bo and bc mean the bias vector and σ means activation function.
2.4 Gated Recurrent Unit (GRU)
GRU [8, 9] is a gating mechanism in a recurrent neural network. The GRU looks like an LSTM carrying
two gates but with a fewer number of parameters, as shown in Figure 5. GRU’s performance in music modelling
and speech signal modelling is similar to that of LSTM. GRU excels LSTM on the performance of some smaller
data sets.
Fig. 5 An example of GRU unit.
A typical model of GRU is defined as follows:
rt = σ (Wr · [ht−1 , xt ] + br ) (7)
zt = σ (Wz · [ht−1 , xt ] + bz ) (8)
h̃t = tanh (Wh · [rt ∗ ht−1 , xt ] + bh ) (9)
ht = (1 − zt )∗ ht−1 + zt ∗ h̃t (10)
xt is the input vector at time t, ht is the output vector, rt is the reset gate vector, zt is the update gate vector,
Wr , Wz and Wh are the weight matrices, br , bz and bh are the bias vector and σ is the activation function.
3 Proposed Model
Figure 6 shows the proposed model with the detailed prediction steps as given below:
1. From input history data {[x1 , y1 ],. . . , [xt , yt ]}, get yp’ t+1 via a Neural Network method (NN1), such as
LSTM, GRU or MLP.
2. Get the error history {e1 ,e2 ,. . . ,et } via the equation: et = yt -yp’ t .
3. From the error history {e1 ,e2 ,. . . ,et }, get ep t+1 , via a Neural Network method (NN2), such as LSTM, GRU
or MLP.
4. Get the final predictive result using the equation: yp t+1 = yp’ t+1 +ep t+1 .288 Bao et al. Applied Mathematics and Nonlinear Sciences 6(2021) 283–292
Fig. 6 The proposed model.
The flow of GRU or LSTM in NN1 is shown in Figure 7. After some preliminary experiments we found this
model to be suitable for our problem. GRU/LSTM layer has 30 GRU/LSTM neural units. In the dense layer, the
activation function is linear. The output is used as a high price of the next day.
Fig. 7 The flow of a GRU or LSTM in NN1.
4 Experiments
4.1 Performance Metrics
To assess the forecasting effect of the proposed model, the results were tested by some evaluation criteria,
which are a Root Mean Square Error (RMSE), Mean Absolute Percentage Error (MAPE) and Mean Absolute
Scaled Error (MASE), as shown in Eqs (11)–(13) [14]. The RMSE, MAPE and MASE represent the difference
between the values yt and yp t , where yt is the actual value of the t-th sample, yp t is the forecast value of the t-th
sample and m is the sample size of the test set. Thus, the smaller their values are, the better the model performs.
The predictive directionality index (Dstat) is defined by Eq. (14). Dstat indicates the consistency between the
actual trend and the predicted trend, and a greater degree of consistency is indicative of a better result.
s
m 2
∑t=1 (y pt − yt )
RMSE = (11)
mPredicting stock high price using recurrent neural network 289
!
1 m
ytp − yt
MAPE = ∑ × 100% (12)
m t=1 yt
1 m
∑t=1 ytp − yt
MASE = 1 m
(13)
mm−1 ∑t=2 |yt − yt−1 |
1 m 1, i f (yt − yt−1 ) ytp − yt−1
p
>0
Dstat = ∑ at , at = (14)
m − 1 t=2 0, otherwise
4.2 Experiment Results 1
The Shanghai Composite Index (000001.SH) of China is used as experimental data. The daily data includes
six variables, such as opening price, high price, low price, closing price, change of price and a number of
transactions.
The data from the previous few days is used as input data, and the high price of the next date is used as the
output data. In the emulations, the stock prices from June 2010 to August 2017 are used as training data (as
shown in Figure 8) and those from September 2017 to April 2018 are used as test data (as shown in Figure 9).
Fig. 8 The high price of training data.
The experiments were implemented in Python 3.5.3; and measured on a computer with Intel(R) Core(TM)
i7-6700 CPU at 3.40 GHz, 8.0 GB RAM, and Microsoft Windows10 Professional 64 bits.
Tables 1-3 show the experiment results. We tested each sample for more than 10 times independently; we
obtained the average values of 10 individuals. "Time" refers to the mean test time; the unit of time is in seconds.
Table 1 The experiment results (NN1: LSTM, DATA SET: 000001.SH).
Models Time RMSE MAPE MASE Dstat
LSTM 0.102 27.243 0.643 1.204 0.653
LSTM,GRU 0.188 22.195 0.481 0.900 0.673
LSTM,LSTM 0.207 22.225 0.483 0.903 0.667
LSTM,MLP 0.125 23.570 0.526 0.984 0.669
In Table 1, the NN1 is LSTM, and the NN2 is LSTM, GRU or MLP, respectively. The values of the error-
index (RMSE, MAPE, MASE) of proposed models are smaller than that of LSTM. The Dstat value of the290 Bao et al. Applied Mathematics and Nonlinear Sciences 6(2021) 283–292
Fig. 9 The high price of test data.
Table 2 The experiment results (NN1: GRU, DATA SET: 000001.SH).
Models Time RMSE MAPE MASE Dstat
GRU 0.090 28.676 0.683 1.281 0.693
GRU,GRU 0.178 21.269 0.449 0.837 0.713
GRU,LSTM 0.193 21.319 0.450 0.840 0.703
GRU,MLP 0.112 23.559 0.517 0.968 0.710
Table 3 The experiment results (NN1: MLP, DATA SET: 000001.SH).
Models Time RMSE MAPE MASE Dstat
MLP 0.023 29.953 0.729 1.368 0.640
MLP,GRU 0.114 23.964 0.521 0.973 0.665
MLP,LSTM 0.128 23.328 0.509 0.950 0.658
MLP,MLP 0.045 24.727 0.560 1.047 0.657
proposed models is larger than that of LSTM. Thus, the predicting effect of the proposed method excels that of
LSTM. However, the running time of the proposed methods is longer than that of LSTM.
In Table 2, the NN1 is GRU, and the NN2 is LSTM, GRU or MLP, respectively. The values of the error-
index of the proposed models are smaller than that of GRU. The Dstat values of the proposed models are larger
than those of GRU. However, the running time of the proposed methods is longer than that of GRU.
In Table 3, the NN1 is MLP, and the NN2 is LSTM, GRU or MLP, respectively. The values of the error-index
of the proposed models are smaller than that of MLP. The Dstat values of the proposed models are larger than
that of MLP. However, the running time of the proposed methods is longer than that of MLP.
Tables 1-3 show that the performance of the proposed method (NN1:GRU, NN2:GRU) is better than others,
because GRU has better performance on some smaller data sets than LSTM.
Figure 10 shows a prediction sample of the proposed method (NN1:GRU, NN2:GRU). The blue zigzag line
is the actual trend; the red zigzag line is the predicted trend. The proposed method can give a precise prediction.Predicting stock high price using recurrent neural network 291
Fig. 10 A prediction sample of the proposed model (NN1:GRU,NN2:GRU, DATA SET: 000001.SH).
4.3 Experiment Results 2
The Shenzhen Composite Index (399001.SZ) of China is used as experimental data. In the simulations, the
stock prices from May 2011 to July 2018 are used as training data, and those from August 2018 to March 2019
are used as test data. The Standard Deviation of data set 399001.SZ is bigger than that of data set 000001.SH,
as shown in Table 4.
Table 4 The standard deviation of experimental data.
Data set Training Test
000001.SH 595.8 106.6
399001.SZ 1773.1 749.3
In Table 5, the performance of the proposed method (NN1:GRU, NN2:GRU) is also better than others. On
the other hand, the values of the error-index (RMSE, MAPE, MASE) in Table 5 are bigger than those in Table 2
because the Standard Deviation values of data set 399001.SZ are bigger than that of data set 000001.SH.
Table 5 The experiment results (NN1: GRU, DATA SET: 399001.SZ).
Models Time RMSE MAPE MASE Dstat
GRU 0.090 127.056 1.143 1.048 0.621
GRU,GRU 0.177 115.375 1.021 0.934 0.621
GRU,LSTM 0.109 126.870 1.092 1.007 0.620
GRU,MLP 0.023 120.234 1.050 0.961 0.615
5 Conclusion
Stock price forecasting is a research hotspot. Accurate prediction of stock prices is difficult. In the proposed
model, the initial forecast of the stock price is first performed, then the possible error is predicted and then the292 Bao et al. Applied Mathematics and Nonlinear Sciences 6(2021) 283–292
initial predicted price and the forecast error are combined to obtain the final predicted value. In the experiment,
we used GRU, LSTM and MLP methods in combination. Our proposed model has been proven to be effective
based on considering the results of our study, and the proposed method (NN1:GRU, NN2:GRU) shows its
superior performance because GRU has better performance on some smaller data sets than LSTM.
In future work, we will further study more parameter settings of the neural networks, such as the number of
layers in the network, the nodes number in each layer, the activation function, etc.. Shortening the training time
is another problem that needs to be solved.
Acknowledgments
This work was supported by the National Natural Science Foundation of China (Nos 61602153, 61702161
and 31700858), Scientific and Technological Project of Henan Province (Nos 152300410207, 162102210274,
172102210171, 182102210020 and 182102210213), Key Research Fund for Higher Education of Henan Province
(No. 18A520003).
References
[1] Aasim, S.N. Singh, and A. Mohapatra, Repeated wavelet transform based ARIMA model for very short-term wind
speed forecasting, Renewable Energy, vol. 136, no. 6, pp. 758-768, 2019.
[2] Qi liu, Guanlan Zhang, Shahzad Ali, Xiaopeng Wang, Guodong Wang, Zhenkuan Pan, and Jiahua Zhang, SPI-based
drought simulation and prediction using ARMA-GARCH model, Applied Mathematics and Computation, vol. 355, no.
8, pp. 96-107, 2019.
[3] Clément Cerovecki, Christian Francq, Siegfried Hörmann, and Jean-Michel Zakoïan, Functional GARCH models: The
quasi-likelihood approach and its applications, Journal of Econometrics, vol. 209, no. 2, pp. 353-375, 2019.
[4] S. Sivakumar and S. Sivakumar, Marginally Stable Triangular Recurrent Neural Network Architecture for Time Series
Prediction, IEEE Transactions on Cybernetics, vol. 48, no. 10, pp. 2836-2850, 2018.
[5] P. Liu, Z. Zeng and J. Wang, Multistability of Recurrent Neural Networks With Nonmonotonic Activation Functions
and Unbounded Time-Varying Delays, IEEE Transactions on Neural Networks and Learning Systems, vol. 29, no. 7,
pp. 3000-3010, 2018.
[6] W. Lee, K. Kim, J. Park, J. Kim and Y. Kim, Forecasting Solar Power Using Long-Short Term Memory and Convolu-
tional Neural Networks, IEEE Access, vol. 6, no. 11, pp. 73068-73080, 2018.
[7] Q. Zhang, H. Wang, J. Dong, G. Zhong and X. Sun, Prediction of Sea Surface Temperature Using Long Short-Term
Memory, IEEE Geoscience and Remote Sensing Letters, vol. 14, no. 10, pp. 1745-1749, 2017.
[8] M. Ravanelli, P. Brakel, M. Omologo and Y. Bengio, Light Gated Recurrent Units for Speech Recognition, IEEE
Transactions on Emerging Topics in Computational Intelligence, vol. 2, no. 2, pp. 92-102, 2018.
[9] R. Zhao, D. Wang, R. Yan, K. Mao, F. Shen and J. Wang, Machine Health Monitoring Using Local Feature-Based
Gated Recurrent Unit Networks, IEEE Transactions on Industrial Electronics, vol. 65, no. 2, pp. 1539-1548, 2018.
[10] A.Y. Alanis, Electricity Prices Forecasting using Artificial Neural Networks, IEEE Latin America Transactions, vol.
16, no.1, pp. 105-111, 2018.
[11] L. Chen, Z. Qiao, M. Wang, C. Wang, R. Du and H. E. Stanley, Which Artificial Intelligence Algorithm Better Predicts
the Chinese Stock Market, IEEE Access, vol. 6, no. 8, pp. 48625-48633, 2018.
[12] J. Tang, C. Deng and G. Huang, Extreme Learning Machine for Multilayer Perceptron, IEEE Transactions on Neural
Networks and Learning Systems, vol. 27, no. 4, pp. 809-821, 2016.
[13] L. Grippo, A. Manno and M. Sciandrone, Decomposition Techniques for Multilayer Perceptron Training, IEEE Trans-
actions on Neural Networks and Learning Systems, vol. 27, no. 11, pp. 2146-2159, 2016.
[14] Lili Mo, Ling Xie, Xiaoyi Jiang, Geer Teng,Lixiang Xu and Jin Xiao, GMDH-based hybrid model for container
throughput forecasting: Selective combination forecasting in nonlinear subseries, Applied Soft Computing, vol. 62,
no. 1, pp. 478-490, 2018.You can also read