Analysis On The Changes Of Network Topology Of Chinese Stock Market After COVID-19 Pandemic - JMEST
←
→
Page content transcription
If your browser does not render page correctly, please read the page content below
Journal of Multidisciplinary Engineering Science and Technology (JMEST)
 ISSN: 2458-9403
 Vol. 9 Issue 3, March - 2022

 Analysis On The Changes Of Network
 Topology Of Chinese Stock Market After
 COVID-19 Pandemic
 Min Liu1 Olivier Joseph Abban3 Hongxing Yao2
 School of Mathematical Sciences, Jiangsu School of Finance and Economics, Jiangsu
 University, Zhenjiang, Jiangsu 212013, China University, Zhenjiang, Jiangsu 212013, China
 1
 E-mail: 1063835635@qq.com
 3
 E-mail: olivierjosephs@yahoo.com

 Abstract—Instability such as sudden public global public health emergency that is qualitatively
health events has the potential to affect the very different from previous crises, such as the global
development of stock markets and possibly financial crisis, with its particular urgency, uncertainty
change the structure of it. Mature stock markets and repeatability creating significant challenges for
can effectively withstand external crises. In markets both at home and abroad. Therefore, it is
December 2019, COVID-19 outbreak occurred in worth studying how the stock market has been
Wuhan, Hubei Province, China. As a affected by the epidemic. Unlike previous public
representative of emerging economies, how will health emergencies too, such as SARS, this outbreak
the network structure of Chinese stock market was more widespread and lasted longer, and there
change after the outbreak of COVID-19 or even has been a rebound that is still going on in several
during the pandemic? This study aims to analyze places[1]. The complexity of interaction on the share
the impact of COVID-19 on 300 Chinese stock market space informs the suitability of the use of
indices from December 1, 2018 to October 17, complex network analytical tools to study the structure
2021 using a complex network approach. We used change, liquidity risk and interdependence of the stock
Pearson correlation coefficient to construct market. The stock market is in constant change too.
correlations between stocks and set up a network By comparing the network topology of China's stock
for the Chinese stock market in four periods market before and after the COVID-19 pandemic, it
(before the pandemic, during the pandemic, after can provide better help for the defense and response
the pandemic, and the overall period) through the of public health emergencies in the future.
threshold network for analysis. We found that Li and Pi[2] studied the impact of the global
COVID-19 has changed the topology of China's financial crisis from 2005 to 2010 on major global
stock market network, making it more connected stock indexes by using minimum spanning tree and
and more likely to cause systemic risk. This threshold method, and found that regional clustering
systemic risk has diminished significantly in the existed in all networks. For large thresholds, networks
wake of the pandemic. The influence nodes and before and after the crisis had significant community
community structure of the stock market networks structure, while networks during the crisis had the
also changed under different thresholds in opposite. Memon and Yao[3] chose the stock market
different periods. At the same time, we found that of Pakistan for their study. By using threshold method,
after more than thirty years of development, they found that there were different core nodes in
China's stock market has become more mature, different periods, which were crucial to the stability of
and its ability to withstand external risks has also the entire stock market and required the attention of
improved. the government and other regulatory departments. In
 addition, Guo[4] explored the connection of global
 Keywords—Threshold network; Leiden stock markets during financial crises or risks since
algorithm; Improved k-shell algorithm; COVID-19; 1995, focusing on the situation under COVID-19, and
China stock market; Complex network. the results showed that when COVID-19 spread
 I. INTRODUCTION globally, markets were more closely linked than any
 other risk. So[5] studied the impact of the COVID-19
 In December 2019, COVID-19 was reported in pandemic on the connectivity of Hong Kong's financial
Wuhan during the Spring Festival. The special time market. Both network density and clustering in
and place caused the rapid spread of COVID-19 partially-correlated networks were higher during the
across the country, which had a negative impact on COVID-19 outbreak.
China's social development, especially in the After comparison, it is found that few articles
economic field[1]. Evaluation of its impact on the study the impact of COVID-19 on the topological
economy and society has become a research hot spot. structure of China's stock market, especially the
 The stock market is regarded as a barometer of changes in the topological structure of China's stock
the economy, and the impact of emergencies and market before and after the pandemic. Therefore, this
crises is often reflected in the stock market at the first paper studies the topological evolution of China's
time[1]. The current COVID-19 pandemic is a major

 www.jmest.org
JMESTN42354022 15201
Journal of Multidisciplinary Engineering Science and Technology (JMEST)
 ISSN: 2458-9403
 Vol. 9 Issue 3, March - 2022

stock market before, during and after COVID-19 and 19,20,21,25,26,27], using entropy[28, 29, 30, 31]]and
analyzes the entire time line too. With a relatively granger coefficients[32, 33, 34],and so on. These
complete timeline, we can understand the full picture methods have been applied to stock markets in many
of the impact of COVID-19 on China's stock market. parts of the world. Memon and Yao[3] applied
When similar public health emergencies occur in the threshold method and MST method to 181 stocks in
future, the impact and harm can be minimized, which Pakistan's stock market, and applied entropy to the
is of great significance for in-depth understanding of whole sample to measure the volatility of individual
the characteristics and rules of the impact of public stocks. It was found that the overall market structure
health emergencies on the stock market. was not stable due to the external and internal crisis
 The innovation of this paper: events in Pakistan. Yao[19] used Pearson coefficient
 (i)COVID-19 on China's economy has a to construct correlation between stocks and analyzed
certain influence and causes a series of fluctuation of the network establishment of China's stock market in
the industry, so it is of great significance to study the three periods (pre-trade, trade war and the whole
topological structure of Chinese stock market at this period) through threshold network. The study found
time, which can reduce the liquidity risk of the stock that the US-China trade war has changed the
market. At present, there are few papers that use topology of China's stock market network, making it
complex networks to study current topics, especially more dense and more likely to go into crisis.
to analyze the changes of topological structure of Threshold method is one of the most basic
Chinese stock market in different periods after methods used in stock market network analysis. How
COVID-19 pandemic. to determine the threshold is a crucial problem. Xu[35]
 (ii)Leiden algorithm is used to detect the proposed the concept of the dynamic consistency
community and improved k-shell algorithm(new between the threshold network and the stock market,
algorithm) is used to identify the influence nodes, and and estimated the optimal threshold through the
the results are more accurate and convincing. For the maximum consistency function. Li[36] determined the
influential nodes and core companies in the stock optimal threshold according to the 3σ principle by
market, relevant government regulatory departments using the relationship between threshold and the
can focus on and supervise them to maintain the maximum number of connected subgraph nodes.
stability of these companies, which is conducive to the After applying threshold method to stock market,
sustained stability and development of China's stock many researchers find that degree distribution follows
market. power law degree model[15, 37]. Gao[38] found by
 The rest of the article is structured as follows. The studying the dynamic threshold network and static
second section introduces the literature review about threshold network of the US stock market that the
network and the innovation of this paper. Section 3 small world of financial network was robust. When the
describes the data and methods. Section 4 discusses big financial collapse occurs, the topology of the
the results of topology evolution. Finally, in section 5, financial network changes greatly. Qiu[39] also used
the conclusion is put forward. dynamic threshold network and static threshold
 network to study the stock markets in US and China,
 II. LITERATURE REVIEW and compared the different dynamic behaviors of
 Along with the information network to the depth of dynamic threshold network and static threshold
the field, the study of complex network[6] has network. At the same time, through the large average
increasingly shown its great practical value, and many clustering coefficient and average degree, it can be
complex network structures have emerged, such as found that there was a strong interaction between
social network, cooperative network and so on[7]. For stocks in the financial market. Huang[37] conducted
the stock market, network method has become a structural and topological analysis of the threshold
useful means to analyze its static and dynamic network of 1080 stocks listed in Shanghai and
characteristics[8, 9, 10]. The spread of risk and the Shenzhen stock markets of China from 2003 to 2007,
complexity of external and internal events on the stock and found that the stock related network was robust to
market require a thorough study of stock correlation the failure of random nodes in topology,but also
networks and their structural dynamics. vulnerable to deliberate attacks.
 Complex network is generally represented by By analyzing previous research results, we pay
graph structure, nodes represent individuals in the more attention to the use of Pearson correlation
network, and edges represent connections between coefficient to build a threshold network to study the
individuals[11]. Introduced by Mantegna[12], impact of COVID-19 and its impact on the structural
correlation-based network is widely used in financial changes of China's stock market.
network literature to quantify the impact of various Community structure in complex networks is
crisis events[13, 14, 15, 16]. In many previous studies, usually characterized by tight connections within
researchers regarded stocks as nodes of the network, communities and sparse connections between
and the relationship between stocks was realized by communities. Community detection[40] is one of the
Pearson correlation coefficient as edges[17, 18, 19, key technologies to study complex network structure.
20, 21, 22]. Among the most popular methods of At present, the research results of community
complex network are threshold method[3, 15, 17, 19, detection can be applied to network public opinion
22, 23, 24], minimum spanning tree[2, 3, 13, 17, monitoring, risk dissemination prediction and many

 www.jmest.org
JMESTN42354022 15202

Journal of Multidisciplinary Engineering Science and Technology (JMEST)
 ISSN: 2458-9403
 Vol. 9 Issue 3, March - 2022

other fields. In order to explore the community III. DATA DESCRIPTION AND METHODS
structure of complex networks, many people have
 A. Data Description
carried out in-depth research on it in recent years.
Traditional community detection algorithms include After more than three decades of development,
spectrum method[41], clip-based method[42], edge China's stock market continues to grow, and the
clustering[43], label propagation[44] and so on. number of A-shares has exceeded 4,500. The CSI
Modularity has been used to compare the quality of 300 Index (China Securities Index 300) represents the
partitions obtained by different methods, but has also full picture of the A-share market, accounting for about
been used as an objective function of optimization. 60 percent of the market's total value. In this study, we
One of the most popular algorithms for optimizing selected all stocks in the CSI 300 Index and used data
modularity is Louvain algorithm[45], named after the covering 695 stock trading days from December 1,
location of its author, which is one of the fastest and 2018 to October 17, 2021 in order to build the network
best performing algorithms in community detection[46, of Chinese stock market. Among them, some
47] and one of the most cited literatures in community companies in the CSI 300 Index were not listed or
testing. But Louvain algorithm can produce any poorly suspended during this period, and finally 208 stocks
connected community. In the worst case, the were selected, and 92 stocks were added from the
community may even be disconnected, especially SSE Index (Shanghai Stock Exchange) and the
when iteratively running the algorithm. Therefore, ShenZhen Component Index. These 300
Leiden algorithm[48] is used for community detection representative stocks are used as network nodes to
of the constructed threshold network of China's stock construct the Chinese stock market network. To
market. The community guarantees generated by explore the impact of COVID-19 on China's stock
Leiden algorithm are connected. Furthermore, when market and the changes in the network topology
Leiden algorithm is applied iteratively, it converges to before and after the pandemic, we divide the entire
a partition in which all subsets of all communities are sample period into four periods.
locally optimally allocated. In practice, Leiden The first period is 242 trading days before the
algorithm is superior to Louvain algorithm in speed COVID-19 pandemic (December 1, 2018 to November
and quality of results. 30, 2019); The second period is 242 trading days
 Identifying influential nodes in complex networks during the COVID-19 pandemic (December 1, 2019 to
is a basic network project. With the rise of complex November 30, 2020); The third period is 211 trading
network research, identification of influential nodes in days after the COVID-19 pandemic (December 1,
the network is crucial for global information 2020 to October 17, 2021); The fourth period is 695
dissemination and effective dissemination of all kinds trading days from December 1, 2018 to October 17,
of news[49]. This research has been used in many 2021. By constructing the network of these four
fields, such as disease transmission control[50], periods, the impact of COVID-19 on China's stock
information dissemination[51]. Of course, the stock market was analyzed. Table Ⅰ shows 15 industries of
market network is no exception. Identifying influential 300 stocks (according to the new industry
nodes in the stock market network can minimize risk classification standards issued by China Securities
transmission and prevent network attacks, which has Regulatory Commission).
important reference value for the regulatory authorities TABLE I. TOTAL NUMBER OF STOCKS CLASSIFIED ACCORDING TO
to carry out targeted supervision. A basic problem is THEIR RESPECTIVE INDUSTRY SECTOR
how to identify influential nodes in complex networks.
Classic centrality indicators have Degree Number of
 No. Industries
 companies
Centrality[52], Betweenness Centrality[53], Closeness
 farming,forestry,animal
Centrality[54], K-shell index[55] and so on. Among 1(A)
 husbandry and fishery
 2
them, K-shell method proposed by Kitsak[55] is the 2(B) mining industry 13
most widely used[56], indicating that node location is 3(C) manufacturing industry 158
one of the most basic factors to evaluate the most production and supply of
influential node. However, K-shell ignores the 4(D) 8
 electricity,heat,gas and water
topological location information of nodes and is a 5(E) construction industry 10
coarse-grained node importance classification method. 6(F) wholesale and retail 12
Wang[57] proposed an improved k-shell algorithm 7(G)
 transportation,warehousing and
 18
(IKS) based on k-shell and node information entropy. postal services
Nodes belonging to lower shells may sometimes be information transmission,software
more powerful than those belonging to higher 8(I) and information technology 18
 services
shells[58]. In addition, this method can more
 9(J) financial industry 38
accurately rank influential nodes and can be extended
 10(K) real estate industry 14
to large-scale networks. Therefore, IKS is used to 11(L) leasing and business services 2
identify influential nodes in the constructed threshold scientific research and
network of Chinese stock market. 12(M) 1
 technology services
 13(P) education 1
 14(Q) health and social work 3
 15(R) culture,sports and entertainment 2

 www.jmest.org
JMESTN42354022 15203

Journal of Multidisciplinary Engineering Science and Technology (JMEST) ISSN: 2458-9403 Vol. 9 Issue 3, March - 2022 B. Methods thresholds, namely, threshold θ=0.3, θ=0.6 and θ=0.8 in this paper (when θ is 0.8, the actual situation is a 1) Construction of threshold network of Chinese small probability event; in order to simulate extreme stock market situations and compare with other fixed thresholds, We used the stock as the network node and the threshold 0.8 is selected.). Pearson correlation coefficient as the connecting edge 2) Community discovery to construct the threshold network of China's stock market, in which Leiden algorithm was used for Modularity[59] is a standard to measure the community detection and IKS algorithm was used for quality of community division, commonly defined as: influential node identification. We built twelve ki k j Ci , C j , A aij (4) 1 threshold networks and evaluated the topological Q 2m ij aij 2m properties of them. A group of N stocks is represented by Where, m is the number of edges of the entire S i i 0,1, , n , where a single stock network, and A is the adjacency matrix of the actual network (if there are edges between node i and node j, corresponds to the numeric label i in S. P t is i then = 1 , otherwise = 0 .), is the degree of defined as the closing price of stock i on day t, and the node i, and indicate the community to which logarithmic return rate ri t of the stock can be node i and j belong in the network. If the two nodes belong to the same community, the value is 1; calculated as: otherwise, the value is 0. ri t In pi t In pi t 1 (1) If the network is weighted, modularity is defined Nodes in the network represent stocks, and as: edges represent correlations between stocks. Then, ss wij 2iWj Ci , C j 1 (5) Pearson correlation coefficients[12] of any two stocks i Qw 2W ij and j in S are calculated as follows: Where, W is the sum of weights of all edges in ri rj ri rj (2) Cij the network, is the strength of node i, that is, the ri ri 2 2 rj rj 2 2 sum of weights of all edges connected to node i, and is the weight of connected edges between node i ri and r j are the logarithmic return rates of stock and node j in the network. Leiden algorithm[48] can be regarded as an i and stock j, and represents the average of these improvement of Louvain algorithm (based on the stocks over the period. In this way, it is possible to optimized quality function; the modularization degree construct a 300×300 cross-related, single-diagonal, is taken as the quality function, and the Constant symmetric matrix C with ranging from -1 (negative Potts Model is commonly used too.), integrating correlation) to 1 (positive correlation) for all nodes[12]. several early improvements, including the combination Cij =1 : represents the complete positive of intelligent local movement algorithm, fast local correlation between node i and node j. movement algorithm and random neighbor movement. The algorithm runs iteratively and uses partitions Cij =0 : indicates there is no correlation between determined in one iteration as the starting point for the node i and node j. next. In this paper, the resolution of modularity is 1.0, Cij =-1 : represents the complete negative the number of iterations is 10, and the number of correlation between node i and node j. restarts is 1. Leiden algorithm consists of three Next, threshold method[23, 24] is used to stages : (1) local movement of nodes; (2) refinement construct the network. Firstly, a threshold value of partition; (3) Network aggregation based on refined 1 1 is selected. When two nodes satisfy partition, using non-refined partition to create an initial partition for the aggregation network. Cij , it is considered that there is a connected 3) Node centrality index edge between nodes i and j. In this way, we will build a threshold network for the Chinese stock market. Degree[59] is one of the simplest and most That is: important concepts to describe the attributes of a 1,Cij single node, representing the number of connections (3) to other nodes. For directed network, it can be divided Cij = 0,Cij into out-degree and in-degree. Intuitively, if the degree value of a node is larger, the node is more important In this way, the networks constructed on the basis in the network in a certain sense. of different thresholds are different. They have the Using an improved K-Shell algorithm (IKS) [57] same number of nodes and different numbers of can effectively sort and measure influential nodes in edges, and the topological properties of the networks complex networks. IKS method combines k-shell are different. function and node information entropy, considers the After using different threshold network tests, it is influence of node shell position and node's nearest decided to focus on the networks generated by three neighbor nodes, optimizes the use of available www.jmest.org JMESTN42354022 15204

Journal of Multidisciplinary Engineering Science and Technology (JMEST) ISSN: 2458-9403 Vol. 9 Issue 3, March - 2022 resources, and enables information to spread IV. RESULTS AND DISCUSSION effectively. A. Results of Pearson Correlation Coefficient Node information[57] describes the global structure of the network, and the greater the entropy, Before analyzing the threshold network, we the greater the influence of the node. The importance analyze the probability density functions (PDFs) of of node (node i) is defined as: Pearson correlation coefficient matrix C (symmetric ki and main diagonal elements are 1.) with 300×300 Ii (6) elements. Fig. 2 shows the probability density N j 1 kj functions for the three periods. Table Ⅱ shows the descriptive statistics of Pearson correlation coefficient Where, k i is the degree of node i and N is the matrix in four periods (the main diagonal elements are number of nodes in the network. removed when the maximum value is counted.). Node information entropy is defined as: ei j i I j ln I j (7) Where, j i is the set of neighbor nodes of node i. Considering the propagation effect of neighbor nodes, the larger the information entropy of nodes is, the easier the influence is to be transmitted to neighbor nodes, therefore, the greater the influence of nodes is. The node importance of each node is different, and the distribution of node information entropy is uneven. Therefore, the more important the node, the greater the node information entropy. The process of IKS algorithm is as follows[57]: Step 1: Decompose the network into k-shells Fig. 2. PDFs of correlation coefficient of Chinese stock according to the k-shell decomposition algorithm; market (Green: before COVID-19; Red: during COVID-19; Step 2: Calculate the node information entropy of Blue: after COVID-19). each node according to Equation (7); TABLE II. DESCRIPTIVE STATISTICS OF PEARSON CORRELATION Step 3: Rank nodes in each shell from large to COEFFICIENTS small according to node information entropy; Step 4: In the shell with the largest k-shell value, Data Before During After select the node with the largest node information sample COVID- COVID- COVID- Overall entropy. Then choose the node with the maximum period 19 19 19 node information entropy in the second largest shell. Mean 0.3409 0.3187 0.1351 0.2584 This process continues until the node with the highest correlation entropy of node information is selected in the 1-shell. Standard 0.3653 0.3794 0.3689 0.338 At this point, the first iteration is complete; deviation Step 5: Repeat Step 4 to select the remaining Skewness 0.6485 0.5987 1.3636 1.5881 nodes until all nodes are selected. The shells of all Kurtosis 4.9098 4.7114 8.7309 9.5165 nodes are ignored. When the information entropy of Maximum 0.9317 0.9315 0.8755 0.9095 nodes is equal in a specific shell, nodes are randomly Minimum -0.1137 -0.1905 -0.2623 -0.0395 selected. The data and methods of this paper are As can be seen from Fig. 2, the probability summarized as Fig. 1. density function during the COVID-19 pandemic is wider and has a lower peak before the pandemic, and moves to the left as a whole, indicating that although the overall correlation between stocks is reduced during the pandemic, there is still a broad and highly correlated relationship. After the pandemic, the probability density function becomes narrower and the peak value becomes higher, and the overall probability density function shifts to the left significantly, indicating that the correlation between stocks is significantly reduced, and most of them are concentrated between 0 and 0.2. This shows that the COVID-19 epidemic has a great impact on China's stock market, leading to a general increase in the Fig. 1. Block diagrams of data and methods correlation between stocks. Since then, a series of emergency policies adopted by the Chinese www.jmest.org JMESTN42354022 15205

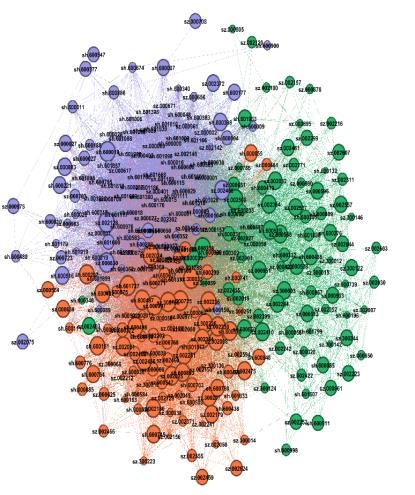
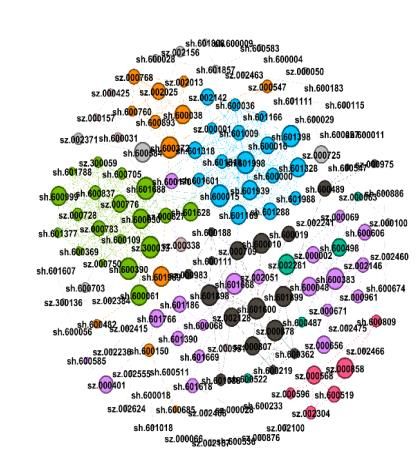
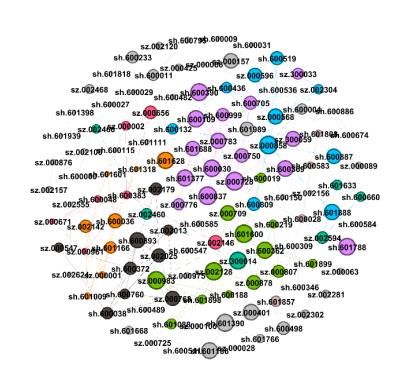
Journal of Multidisciplinary Engineering Science and Technology (JMEST)
 ISSN: 2458-9403
 Vol. 9 Issue 3, March - 2022

government and companies, such as home that the crisis brought by COVID-19 has decreased
quarantines, traffic restrictions and store closures, has significantly.
reduced the correlation between stocks[1]. At the There are three communities in Fig. 3(a), Fig. 3(b)
same time, it can be seen from Table Ⅱ that the and Fig. 3(c) is six communities, indicating that after
average correlation during the COVID-19 pandemic is the COVID-19 pandemic, the connection between
0.3187, which increases compared with the whole nodes in stock market network has weakened, the
sample period and then decreases significantly. phenomenon of clustering has decreased, and the risk
Analysis of the data shows that the COVID-19 of contagion and liquidity caused by the epidemic has
epidemic has had a negative impact on China's stock greatly reduced. This situation is promoted by China's
market, which increases the probability of a crisis in understanding and control of the COVID-19 epidemic
China's stock market, as the market tends to act as a as well as the research and development of vaccines.
whole in a crisis event.
 B. Threshold Networks and Topological Structure
Change Analysis
 Next, the stock correlation networks under
different threshold levels are analyzed. We give the
critical thresholds 0.3, 0.6 and 0.8. There are three
sub-periods and the entire sample period to analyze
the changes in topological properties and structure of
China's stock market networks before and after the
COVID-19 pandemic. In the following graphs, the
node color represents the community in which it is
located, and the node size represents the size of the
central measure based on IKS centrality.
 1) Threshold θ=0.3
 In Fig. 3, we present three networks for Chinese (a)
stock market before, during, and after the COVID-19
pandemic. It can be seen from Fig. 3(a) that, the most
important nodes are Avic Shenyang Aircraft
(manufacturing), Wanhua Chemical (manufacturing)
and GF (Guangfa) Securities (finance), and these
three companies are in three different industries. In
Fig. 3(b), important nodes have changed and have
been replaced by Meijin Energy (manufacturing),
Oriental Pearl (information transmission, software and
information technology services), and CITIC
Securities (finance). In Fig. 3(c), important nodes
become China Merchants Bank (finance), Conch
Cement (manufacturing) and GF Securities (finance).
At the same time, contrast Fig. 3, we can see that
compared with before the COVID-19 pandemic, the (b)
number of edge connections in the stock market
network during the pandemic does not increase, but
slightly reduces, this is because time of sub-sample
period during the pandemic is taken to November 30,
2020. According to the actual situation, since the
outbreak of the COVID-19 pandemic, the Chinese
government took a series of measures to control the
spread of the epidemic, such as home quarantine,
traffic control and store closure. By May 2020, the
epidemic had been preliminarily controlled[1], so the
network density only decreases from 0.604 before the
pandemic in Fig. 3(a) to 0.534 during the pandemic in
Fig. 3(b), without a significant decrease. For the short-
term impact during the COVID-19 pandemic, please
refer to literature[5]. After the pandemic, the number (c)
of network connections and network density decrease Fig. 3. Threshold network of Chinese stock market in three
significantly, with the density only 0.094, and the periods based on IKS centrality and θ>0.3. (a) before the
correlation between nodes also weakens, indicating COVID-19 pandemic; (b) during the COVID-19 pandemic; (c)
 after the COVID-19 pandemic.

 www.jmest.org
JMESTN42354022 15206
Journal of Multidisciplinary Engineering Science and Technology (JMEST)
 ISSN: 2458-9403
 Vol. 9 Issue 3, March - 2022

 Table Ⅲ and Table Ⅳ show the influential nodes TABLE IV. THE TOP THREE INFLUENTIAL NODES OF THE TOP THREE
 ASSOCIATIONS IN DIFFERENT PERIODS WHEN Θ>0.3
in different periods and communities when the
threshold is 0.3. Among them, during the pandemic, a before-COVID- during- after-COVID-
 Community
large community formed by Oriental Pearl, IFlytek and 19 COVID-19 19
Hypergraph Software is formed. This is because the Huayu Meijin Energy
 Flush J
epidemic restricts people's travel. For example, Automobile C C
students have to go to class online, kill time by Sichuan
electronic devices, and shop online,etc. In addition, 1 Saic C Investment Zoomlion C
 Energy D
Xinhecheng (medical manufacturing) appears in the
 China
table as an important node of the third association, Jinke Shares K
 Happiness K
 Wuliangye C
and influences many industry companies from this China
point. During the epidemic, the medical manufacturing Avic Shenyang
 Oriental Pearl I Merchants
industry is positively affected by the large demand for Aircraft C
 Bank J
medical supplies and masks. In the wake of the 2 Oriental Guoxin Conch Cement
 IFlytek I
pandemic, the influence of these industries has been I C
significantly reduced. According to its third-quarter Groundmass Hypergraph GF Securities
financial statement, Xinhecheng's net profit rose from Information I Software I J
1.71 billion yuan in 2019 to 2.945 billion yuan in 2020, Wanhua CITIC Oriental
up 77.22 percent year on year, and to 3.380 billion Chemical C Securities J Wealth J
yuan in 2021, up 14.81 percent year on year. These 3 GF Securities J Sinoma C Large Laser C
 Diving Medical
industries are more connected and influential than Xinhecheng C IFlytek I
 C
usual during the COVID-19 pandemic.
TABLE III. THE TOP TEN INFLUENTIAL NODES IN DIFFERENT PERIODS 2) Threshold θ=0.6
WHEN Θ>0.3
 When the threshold is raised to 0.6 and influence
 Influence before- during- after- nodes are identified according to IKS centrality, we
 node COVID-19 COVID-19 COVID-19 find that the density of the stock market network is
 Avic China greatly reduced in all three periods. As can be seen
 Meijin from Fig. 4(a), the most important nodes with higher
 1 Shenyang Merchants
 Energy C IKS ranking are GF Securities (finance), Hesteel
 Aircraft C Bank J
 Wanhua Oriental Conch (manufacturing) and Avic Capital (finance). Avic
 2 Capital is still the center of the network and an
 Chemical C Pearl I Cement C
 GF CITIC GF important node. According to Fig. 4(b), it can be seen
 3 that influence nodes have changed during the
 Securities J Securities J Securities J
 Huayu pandemic, namely, Financial Street (real estate),
 Huatai CRRC (manufacturing) and Haitong Securities
 4 Automobile IFlytek I
 Securities J (finance). After the COVID-19 pandemic, the nodes of
 C
 Oriental CITIC influence are Guoyuan Securities (finance), Haitong
 5 Sinoma C Securities (finance), and Wuliangye (manufacturing),
 Guoxin I Securities J
 Diving Hypergraph Guoyuan as shown in Fig. 4(c). In addition, when the threshold
 6 is 0.6, both the number of network edges and network
 Medical C Software I Securities J
 density are higher during the pandemic than before
 Sichuan
 Groundmass Changjiang the outbreak, and decrease significantly after the
 7 Investment
 Information I Securities J pandemic. This shows that for the above medium
 Energy D
 threshold, even if the sub-sample period is long, the
 Baiyunshan China
 8 Flush J correlation between nodes is still strengthened during
 C Happiness K
 the pandemic, and the systemic risk increases.
 Huayu
 Daan Gene Oriental Liquidity risks are prone to occur between node
 9 Automobile
 C Wealth J companies with high correlation. Therefore,
 C
 supervision should be strengthened on influential
 Luzhou Ganfeng nodes at this time.
 10 Zoomlion C
 Laojiao C Lithium C The number of communities increases
 significantly with the threshold increasing, but at the
 moment, the number of communities after the COVID-
 19 pandemic remains higher than before and during
 the pandemic, from 23 to 28. This indicates that after
 the pandemic, the number of small clusters in China's
 stock market network increases, the clustering
 phenomenon decreases, and the risk of contagion
 and liquidity caused by the epidemic has been greatly
 reduced. At this time, the local outbreak of the
 epidemic will only affect a small number of node

 www.jmest.org
JMESTN42354022 15207

Journal of Multidisciplinary Engineering Science and Technology (JMEST)
 ISSN: 2458-9403
 Vol. 9 Issue 3, March - 2022

companies, and the risk is not easy to spread, only not been in the top ten influential nodes, as the
spread in a small area, easy to control. pandemic has limited the growth of all transport
 sectors since the outbreak. To prevent the spread of
 the disease, China has introduced a series of policies,
 including the suspension of flights, the reduction of
 import and export trade, and restrictions on the
 movement of people between regions, which naturally
 affects transportation industry. The influential
 industries and nodes in the community in different
 periods are also different.
 TABLE V. THE TOP TEN INFLUENTIAL NODES IN DIFFERENT PERIODS
 WHEN Θ>0.6

 Influence before- during- after-
 node COVID-19 COVID-19 COVID-19
 (a) GF Guoyuan
 Financial
 1 Securities Securities
 Street K
 J J
 Haitong
 2 Hesteel C CRRC C Securities
 J
 Haitong
 Avic Wuliangye
 3 Securities
 Capital J C
 J
 Aluminum
 Southwest Xinhu
 Corporatio
 4 Securities Zhongbao
 n of China
 J K
 C
 Guoyuan Shanxi
 Avic
 5 Securities Coking
 Capital J
 (b) J Coal B
 Open-pit
 Hainan Minmetals
 6 Coal
 Airlines G Capital J
 Industry B
 Zhongyua
 SIPG
 7 n Sea CRCC E
 Group G
 Control G
 Nanshan
 Minmetals Minmetals
 8 Aluminum
 Capital J Capital J
 C
 Petrochina China Life Ev Lithium
 9
 Capital J J Energy C
 Chinese Industrial Everbright
 10 Architectur Securities Securities
 (c) eE J J
Fig. 4. Threshold network of Chinese stock market in three
periods based on IKS centrality and θ>0.6. (a) before the
COVID-19 pandemic; (b) during the COVID-19 pandemic; (c)
after the COVID-19 pandemic.

 Table Ⅴ and Table Ⅵ show the influential nodes
in different periods and communities when the
threshold is 0.6. After comparison, it is found that the
influential industries before the COVID-19 pandemic
are mainly financial industry and transportation
industry, while during the pandemic, the influential
industries become more diversified, including
manufacturing, real estate, financial industry, etc.
After the COVID-19 pandemic, coal mining and
washing industry have been added to the list of
influential sectors, while transportation industry has

 www.jmest.org
JMESTN42354022 15208

Journal of Multidisciplinary Engineering Science and Technology (JMEST)
 ISSN: 2458-9403
 Vol. 9 Issue 3, March - 2022
 TABLE VI. THE TOP THREE INFLUENTIAL NODES OF THE TOP THREE this time. After the pandemic, clustering disappears
ASSOCIATIONS IN DIFFERENT PERIODS WHEN Θ>0.6
 and the maximum number of nodes in a cluster is 3.
 Comm before- during- after- As can be seen from Table Ⅷ, most of the influence
 unity COVID-19 COVID-19 COVID-19 nodes in the same cluster belong to the same industry,
 but the companies of the influence nodes in the
 Guoyuan industry change in different periods.
 Hesteel C CRRC C
 Securities J
 Xinhu
 Hainan Haitong
 1 Zhongbao
 Airlines G Securities J
 K
 Zhongyuan Nanshan
 Minmetals
 Sea Control Aluminum
 Capital J
 G C
 Deep Aluminum
 GF
 Pegasus A Corporation
 Securities J
 C of China C
 Shanxi
 Avic Capital Telecommu
 2 Coking
 J nication C
 Coal B
 Open-pit
 Southwest Hypergraph
 Coal (a)
 Securities J Software I
 Industry B
 Financial Wuliangye
 CMBC J
 Street K C
 China
 3 Citic Bank J Vanke K Zhongmian
 L
 Bank of
 Daqin Luzhou
 Communica
 Railway G Laojiao C
 tions J
 3) Threshold θ=0.8
 Next, we continue to increase the threshold to 0.8,
resulting in visible and less dense networks, as shown
in Fig. 5. At this point, we find that the number of
nodes and edges is greatly reduced again, indicating (b)
that it is a low-probability event for a large threshold
value, and the correlation between nodes in the
network is relatively strong. Before the outbreak of
COVID-19, the number of network connected edges is
67, while during the pandemic, the number of network
connected edges is slightly higher at 71, indicating
that the probability of systemic liquidity risk in the
stock market network increases at this time. After the
pandemic, the number of network connected edges is
just 15, so the risk is reduced. In addition, through the
comparison of influence nodes, we find an interesting
phenomenon that before and during the epidemic,
most of the industries of influence nodes is financial
industry, such as CITIC Securities and Huaxia Bank,
as shown in Table Ⅶ. In this case, China's
government supervision departments should focus on
 (c)
improving the attention to the financial industry.
 Fig. 5. Threshold network of Chinese stock market in three
However, after the pandemic, the influence nodes periods based on IKS centrality and θ>0.8. (a) before the
have changed, and there are important nodes in COVID-19 pandemic; (b) during the COVID-19 pandemic; (c)
manufacturing and transportation industry. after the COVID-19 pandemic.
 As can be seen from Fig. 5(a), Chinese stock
market network is healthy and there are low
interconnection clusters. By contrast, Fig. 5(b) shows
an increase in cluster connectivity in the network at

 www.jmest.org
JMESTN42354022 15209

Journal of Multidisciplinary Engineering Science and Technology (JMEST)
 ISSN: 2458-9403
 Vol. 9 Issue 3, March - 2022
 TABLE VII. THE TOP FIVE INFLUENTIAL NODES IN DIFFERENT Securities' net profit rose 20.82% and 39.53% year-
PERIODS WHEN Θ>0.8
 on-year respectively. Open-pit Coal Industry's net
 Influence before- during- after- profit rose 20.49% and 55.25% year-on-year
 node COVID-19 COVID-19 COVID-19 respectively. It can be seen that although China's
 stock market is not yet a mature stock market, it has
 Industrial Southwest made great progress in more than thirty years of
 Air China
 1 Securities Securities development and needs to be gradually improved.
 G
 J J It can be seen from Fig. 6(b) that the important
 CITIC Haitong influence nodes of θ>0.6 are Huatai Securities, Citic
 Yunnan
 2 Securities Securities Bank, and Huaxia Bank, so we should pay attention to
 Copper C
 J J the importance of finance for China's economic
 Aluminum development. According to the financial statements of
 Guoyuan
 Corporatio Huaxia the third quarter, the net profit of Huatai Securities
 3 Securities
 n of China Bank J increased from 6.488 billion yuan in 2019 to 8.942
 J
 C billion yuan in 2020 and then to 11.25 billion yuan in
 China Bank of Luzhou 2021, with a continuous growth. The net profit of the
 4 other two companies declined during the pandemic
 Railway E Beijing J Laojiao C
 and then recovered. Thus, the impact of COVID-19 on
 Changjian China's stock market is significant, as reflected
 Chinese
 Huaxia g directly in the company's net assets.
 5 Architectur
 Bank J Securities In Fig. 6(c), Huatai Securities, Haitong Securities
 eE
 J and Poly Development (real estate) rank high in IKS
 centrality. We can see the important role of these
 three companies in China's economic development.
 TABLE VIII. THE TOP THREE INFLUENTIAL NODES OF THE TOP TWO
ASSOCIATIONS IN DIFFERENT PERIODS WHEN Θ>0.8 The net profit of Huatai Securities increased from
 6.488 billion yuan in 2019 to 8.942 billion yuan in 2020,
 Comm before- during- after- and then to 11.25 billion yuan in 2021, with continuous
 unity COVID-19 COVID-19 COVID-19 growth; Haitong Securities' net profit increased 14.59%
 and 37.94% year-on-year respectively. Poly
 Industrial Huaxia Wuliangye Development also continued to increase its net profit.
 Securities J Bank J C As can be seen, the three most important nodes in the
 network still increased their net profits over the entire
 CITIC Bank of Luzhou sample period, especially during the COVID-19
 1
 Securities J Beijing J Laojiao C pandemic.
 When θ is 0.3, the stock market network has
 GF Pingan Kweichow three big communities, and the connection between
 Securities J Bank J Moutai C the nodes within the associations is close, but the
 connection between the associations is sparse. In this
 China Southwest Guoyuan case, the influence nodes are crucial to the stability of
 Railway E Securities J Securities J the stock market. The fluctuation of a node company,
 Power such as CITIC Securities, will drive the fluctuation of
 Constructio Changjiang Changjiang node companies in the whole community, causing
 2
 n of China Securities J Securities J systemic risks. When θ is 0.8, the nodes and edges in
 E the stock market network are greatly reduced, mainly
 including the financial industry, manufacturing and
 GF Sealand real estate industry, which are highly correlated with
 CRRC C
 Securities J Securities J each other and have a mutually beneficial relationship.

 4) Threshold networks of the whole sample period
 Fig. 6 shows the threshold network structure of
China's stock market at θ>0.3, θ>0.6 and θ>0.8 in the
whole sample period. Fig. 6(a) shows that the most
important influence nodes when θ>0.3 are CITIC
Securities (finance), Open-pit Coal Industry (mining),
and Weichai Power (manufacturing). According to the
financial statement of Eastmoney.com in the third
quarter, the net profit of Weichai Power fell from 9.329
billion yuan in 2019 to 8.702 billion yuan in 2020,
down 6.73% year on year, but by 2021, the net profit
increased to 10.19 billion yuan, up 17.12% year on
year. Except for Weichai Power, the net profit of the
other two companies continued to grow. CITIC

 www.jmest.org
JMESTN42354022 15210
Journal of Multidisciplinary Engineering Science and Technology (JMEST)
 ISSN: 2458-9403
 Vol. 9 Issue 3, March - 2022

 strong correlation occurs within the industry.
 TABLE IX. THE TOP TEN INFLUENCE NODES UNDER DIFFERENT
 THRESHOLDS THROUGHOUT THE ENTIRE SAMPLE PERIOD

 Influence
 θ> 0.3 θ> 0.6 θ> 0.8
 node
 CITIC Huatai Huatai
 1
 Securities J Securities J Securities J
 Open-pit
 Haitong
 2 Coal Citic Bank J
 Securities J
 Industry B
 Poly
 Weichai Huaxia
 3 Developme
 Power C Bank J
 nt K
 Luzhou
 4 Baosteel C Flush J
 Laojiao C
 CITIC
 (a) 5 Flush J ICBC J
 Securities J
 Suning Minmetals GF
 6
 Shopping F Capital J Securities J
 Boss Wuliangye
 7 AVIC C
 Electrical C C
 Shanghai Kweichow
 8 Gemdale K
 Electric C Moutai C
 Chinese China
 9 Boe C Architecture Eastern
 E Airlines G
 Hengtong Aluminum
 10 Photoelectri Corporation Vanke K
 cC of China C
 TABLE X. THE TOP THREE INFLUENCE NODES OF THE TOP THREE
 ASSOCIATIONS UNDER DIFFERENT THRESHOLDS THROUGHOUT THE
 ENTIRE SAMPLE PERIOD

 Comm
 (b) θ> 0.3 θ> 0.6 θ> 0.8
 unity
 Open-pit
 Huatai
 Coal Industry Gemdale K
 Securities J
 B
 Chinese
 CITIC
 1 Baosteel C Architecture
 Securities J
 E
 Poly
 Luxi GF
 Development
 Chemical C Securities J
 K
 Poly
 Huatai
 Flush J Development
 Securities J
 K
 2 Suning
 Flush J Vanke K
 Shopping F
 Shanghai Minmetals
 Gemdale K
 Electric C Capital J
 (c) CITIC Luzhou
 Citic Bank J
 Fig. 6. Threshold network of Chinese stock market in Securities J Laojiao C
different thresholds based on IKS centrality and the entire Weichai Huaxia Bank
 3 Wuliangye C
sample period. (a) θ>0.3; (b) θ>0.6; (c) θ>0.8. Power C J
 Table Ⅸ and Table Ⅹ show the influential nodes Boss
 ICBC J
 Kweichow
in different thresholds and in different communities Electrical C Moutai C
with different thresholds in the whole sample period. V. CONCLUSION
After comparison, it is found that when θ is 0.3, the
influential industry is mainly manufacturing. When θ is Overall, we studied the structural changes and
0.6, the influence industry is mainly financial industry. network evolution of China's stock market over 695
The influential industries are mainly financial industry trading days from December 1, 2018 to October 17,
and manufacturing industry when θ is 0.8. At this time, 2021, using a representative sample of 300 stocks.
there are only four nodes at most in the community When we use the threshold method to build a network
structure, and all nodes within the community belong for Chinese stock market and compare the four
to the same industry, indicating that the situation with periods, we found that COVID-19 has a dramatic

 www.jmest.org
JMESTN42354022 15211
Journal of Multidisciplinary Engineering Science and Technology (JMEST)
 ISSN: 2458-9403
 Vol. 9 Issue 3, March - 2022

impact on the stock market network. This made accounted for a large proportion of Chinese stock
Chinese stocks more correlated with each other market. COVID-19 has had a big impact on China's
during the pandemic, so that when one stock was manufacturing sector. Manufacturing enterprises need
affected, it spread to a large number of stocks, leading to improve competitiveness, expand sales channels.
to a large decline in the stock market, which was not Relevant supportive policies from the government are
good for the health of the stock market. After the also needed to help these enterprises develop more
pandemic, mean correlation was significantly reduced. healthily and stably.
This may be thanks to the concerted efforts of all Finally, we also conclude that after more than
departments and people in China and a series of thirty years of development, Chinese stock market is
effective measures taken to bring the epidemic under maturing and the ability of enterprises to withstand
control. We also found that when threshold reached external risks is increasing. After analyzing the
0.8, the most influential nodes were in the financial influence nodes of stock market network throughout
sector before and during the pandemic. This means the whole sample period, we found that the net profits
that in order to ensure the safety of the stock market of three influence node companies increased in 2020
and avoid a financial crisis, the government and and 2021 when threshold reached 0.8. We also
regulators should focus on China's financial industry observed that although some of the net profits of the
and strengthen supervision of key enterprises among major nodes of influence in the network declined
them. In the wake of the COVID-19 pandemic, during the pandemic, they all increased after the
transportation and manufacturing industries have pandemic, suggesting that the impact of COVID-19 on
emerged as nodes of influence. In addition, when the profitability of Chinese companies is short-lived.
comparing three sub-periods, we can see that when The paper will help regulators and investors study the
threshold was 0.3, manufacturing, software and current topology of Chinese stock market. It is of great
information technology services were a larger significance to deeply understand the characteristics
proportion of the influence nodes before and during and rules of the impact of public health emergencies
the pandemic, and mainly in the financial sector after on China's stock market. At the same time, it will also
the pandemic. When threshold was 0.6, these sectors provide a basis for investors and policy makers to
were still important, along with important sectors such make decisions when dealing with emergencies.
as transport and mining. In analyzing the 300 stock .
nodes, we also found that manufacturing companies
 [6] Lada A. Adamic, and Bernardo A. Huberman,
 ACKNOWLEDGMENT
 Power-Law Distribution of the World Wide Web.
 All authors contributed to the conception and Science, 2000. 287(5461): p. 2115.
design of the study.This work was supported by the [7] Newman M. E. J., From the Cover: The structure
National Natural Science Foundation of China no. of scientific collaboration networks. Proceedings
71701082. of the National Academy of Sciences of the United
 States of America, 2001. 98(2): p. 404-409.
 REFERENCES [8] A. Namaki, A.H. Shirazi, R. Raei, and G.R. Jafari,
 Network analysis of a financial market based on
 genuine correlation and threshold method. Physica
[1] Guo Tianyong, and Sun Guangyu, The Impact of A: Statistical Mechanics and its Applications,
 COVID-19 on China's economy and 2011. 390(21-22): p. 3835-3841.
 countermeasures. China Banker, 2020(04): p. 42- [9] Štefan Lyócsa, Tomáš Výrost, and Eduard
 44. [郭田勇,孙光宇.新冠疫情对我国经济的影响 Baumöhl, Stock market networks: The dynamic
 与应对之策[J].银行家,2020(04):42-44.] conditional correlation approach. Physica A:
[2] Li Bentian, and Pi Dechang, Analysis of global Statistical Mechanics and its Applications, 2012.
 stock index data during crisis period via complex 391(16): p. 4147-4158.
 network approach. PloS one, 2018. 13(7): p. [10] Juan Gabriel Brida, David Matesanz, and Maria
 e0200600. Nela Seijas, Network analysis of returns and
[3] B.A. Memon, and H. Yao, Structural Change and volume trading in stock markets: The Euro Stoxx
 Dynamics of Pakistan Stock Market during Crisis: case. Physica A: Statistical Mechanics and its
 A Complex Network Perspective. Entropy, 2019. Applications, 2016. 444:751-764.
 21(3). [11] Santo Fortunato, Community detection in graphs.
[4] Guo Hongfeng, Zhao Xinyao, Yu Hang, and Physics Reports, 2009. 486(3-5).
 Zhang Xin, Analysis of global stock markets’ [12] R.N. Mantegna, Hierarchical structure in financial
 connections with emphasis on the impact of markets. The European Physical Journal B-
 COVID-19. Physica A: Statistical Mechanics and Condensed Matter and Complex Systems, 1999.
 its Applications, 2021. 569(3). 11(1): p. 193-197.
[5] So Mike K.P., Chu Amanda M.Y., and Chan [13] M. Majapa, and S.J. Gossel, Topology of the South
 Thomas W.C., Impacts of the COVID-19 African stock market network across the 2008
 pandemic on financial market connectedness. financial crisis. Physica A: Statistical Mechanics
 Finance Research Letters, 2020. 38(5). and its Applications, 2016. 445: p. 35-47.

 www.jmest.org
JMESTN42354022 15212
Journal of Multidisciplinary Engineering Science and Technology (JMEST)
 ISSN: 2458-9403
 Vol. 9 Issue 3, March - 2022

[14] J. P. Onnela, A. Chakraborti, K. Kaski, and J. information. Physica A: Statistical Mechanics and
 Kertész, Dynamic asset trees and Black Monday. its Applications, 2019. 523.
 Physica A: Statistical Mechanics and its [27] Marfatia, H. , W. L. Zhao , and Q. Ji, Uncovering
 Applications, 2003. 324(1): p. 247-252. the global network of economic policy uncertainty.
[15] Lisi Xia, Daming You, Xin Jiang, and Quantong Research in International Business and Finance,
 Guo, Comparison between global financial crisis 2020. 53 (prepublish).
 and local stock disaster on top of Chinese stock [28] Jiang, Jiaqi, and Rongbao, Using Renyi parameter
 network. Physica A: Statistical Mechanics and its to improve the predictive power of singular value
 Applications, 2018. 490. decomposition entropy on stock market. Physica,
[16] Wooseok Jang, Junghoon Lee, and Woojin Chang, A. Statistical mechanics and its applications, 2016.
 Currency crises and the evolution of foreign 448: p. 254-264.
 exchange market: Evidence from minimum [29] Gu R, Multiscale Shannon entropy and its
 spanning tree. Physica A: Statistical Mechanics application in the stock market. Physica A
 and its Applications, 2011. 390(4): p. 707-718. Statistical Mechanics & Its Applications, 2017.
[17] Lee Jae Woo, and Nobi Ashadun, State and 484: p. 215-224.
 Network Structures of Stock Markets Around the [30] Lv Qiuna, Han Liyan, Wan Yipeng, and Yin Libo,
 Global Financial Crisis. Computational Stock Net Entropy: Evidence from the Chinese
 Economics, 2018. 51(2). Growth Enterprise Market. Entropy, 2018. 20(10).
[18] Gang-Jin Wang, Chi Xie, Shou Chen, Jiao-Jiao [31] Xudong Wang, and Xiaofeng Hui, Cross-Sectoral
 Yang, and Ming-Yan Yang, Random matrix theory Information Transfer in the Chinese Stock Market
 analysis of cross-correlations in the US stock around Its Crash in 2015. Entropy, 2018. 20(9).
 market: Evidence from Pearson’s correlation [32] Wang, Z. , et al, Identifying influential nodes
 coefficient and detrended cross-correlation based on fluctuation conduction network model.
 coefficient. Physica A: Statistical Mechanics and Physica A: Statistical Mechanics and its
 its Applications, 2013. 392(17): p. 3715-3730. Applications, 2019. 514: p. 355-369.
[19] Yao H X, and Memon B A, Impact of US-China [33] Vyrost, Tomá, ? Lyócsa, and E. Baum?Hl ,
 Trade War on the Network Topology Structure of Granger Causality Stock Market Networks:
 Chinese Stock Market. Journal of Asian Business Temporal Proximity and Preferential Attachment.
 Strategy, 2019. 9. Physica A Statistical Mechanics & Its Applications,
[20] Mansooreh Kazemilari, Ali Mohamadi, Abbas 2015. 427: p. 262-276.
 Mardani, and Justas Streimikis, NETWORK [34] Papana, A. , Kyrtsou, C. , Kugiumtzis, D. ,and
 TOPOLOGY OF RENEWABLE ENERGY Diks, C. , Financial networks based on Granger
 COMPANIES: MINIMAL SPANNING TREE AND causality: A case study. Physica A Statistical
 SUB-DOMINANT ULTRAMETRIC FOR THE Mechanics & Its Applications, 2017. 482: p. 65-73.
 AMERICAN STOCK. Technological and [35] Xu, X. J. , Wang, K. , Zhu, L. , and Zhang, L. J. ,
 Economic Development of Economy, 2019. 25(2): Efficient construction of threshold networks of
 p. 168-187. stock markets. Physica A Statistical Mechanics &
[21] Huang, C. , Zhao, X. , R Su, Yang, X. , and Yang, Its Applications, 2018. 509: p. 1080-1086.
 X. , Dynamic network topology and market [36] Li K H, and FAN Y, Stock network construction
 performance: A case of the Chinese stock market. and important node discrimination based on
 International Journal of Finance & Economics, optimal threshold method. Journal of Beijing
 2020. normal university (natural science), 2015. 51(06):
[22] Chmielewski L, Amin R, Wannaphaschaiyong A, p. 582-585. [李恺华,樊瑛.基于优化阈值法的股
 et al, Network Analysis of Technology Stocks using 票网络构建与重要节点判别[J].北京师范大学学
 Market Correlation. International Conference on 报(自然科学版),2015,51(06):582-585.]
 Knowledge Graph (ICKG). IEEE, 2020. [37] Huang, W. Q. , X. T. Zhuang , and Y. Shuang , A
[23] V. Boginski, S. Butenko , and P. M. Pardalos, network analysis of the Chinese stock market.
 Statistical analysis of financial networks. Physica A Statistical Mechanics & Its Applications,
 Computational Statistics & Data Analysis, 2005. 2009. 388(14): p. 2956-2964.
 48(2): p. 431-443. [38] Gao, Y. C. , Z. W. Wei , and B. H. Wang,
[24] A. Namaki, A.H. Shirazi, R. Raei, and G.R. Jafari, Dynamic evolution of financial network and its
 Network analysis of a financial market based on relation to economic crises. International Journal
 genuine correlation and threshold method. Physica of Modern Physics C, 2013. 24(2): p. 1350005-1-
 A: Statistical Mechanics and its Applications, 1350005-10.
 2011. 390(21-22): p. 3835-3841. [39] Qiu, T. , B. Zheng , and G. Chen , Financial
[25] Guo Xue, Zhang Hu, and Tian Tianhai, networks with static and dynamic thresholds. New
 Development of stock correlation networks using Journal of Physics, 2010. 12 (4).
 mutual information and financial big data. PloS [40] Radicchi, F. , Castellano, C. , Cecconi, F. , Loreto,
 one, 2018. 13(4). V. , and Parisi, D., Defining and identifying
[26] Khoojine, A. S. , and D. Han, Network analysis of communities in networks. Proceedings of the
 the Chinese stock market during the turbulence of National Academy of Sciences of the United
 2015–2016 using log-returns, volumes and mutual States of America, 2004. 101(9): p. 2658-2663.

 www.jmest.org
JMESTN42354022 15213
Journal of Multidisciplinary Engineering Science and Technology (JMEST)
 ISSN: 2458-9403
 Vol. 9 Issue 3, March - 2022

[41] Luxburg U V, A Tutorial on Spectral Clustering. [51] Zhang Y C, Zhang Y C, and Yeung C H, Research
 Statistics and Computing, 2004. 17(4): p. 395-416. on the Relationship between Leaders and Social
[42] Palla, G. , Deranyi, I. , Farkas, I. , and Vicsek, T. , Networks in The Delicious Case. Plos One, 2011.
 Uncovering the overlapping community structure 6(6): p. E21202.
 of complex networks in nature and society. Nature, [52] Freeman, L. C. , Centrality in social networks
 2005. 435(7043): p. 814. conceptual clarification. Social Networks, 1978.
[43] Y. Kim, and H. Jeong , Map equation for link 1(3): p. 215-239.
 community. Physical Review E, 2011. 84(2): p. [53] Freeman, L. C. , A Set of Measures of Centrality
 26110-26110. Based on Betweenness. Sociometry, 1977. 40(1): p.
[44] Tan, P. N. , Chawla, S. , Ho, C. K. , and Bailey, J. , 35-41.
 [Lecture Notes in Computer Science] Advances in [54] Sabidussi G, The centrality index of a graph.
 Knowledge Discovery and Data Mining Volume Psychometrika, 1966. 31(4): p. 581-603.
 7301||Visualizing Clusters in Parallel Coordinates [55] Kitsak M , Gallos L K, et al. , Identification of
 for Visual Knowledge Discovery. 2012. (Chapter influential spreaders in complex networks. Nature
 42) : p. 505-516. Physics, 2010.
[45] Blondel, V. D. , Guillaume, J. L. , Lambiotte, R. , [56] Jiang, L. , Zhao, X. , Ge, B. , Xiao, W. , and Ruan,
 and Lefebvre, E. , Fast unfolding of communities Y. , An efficient algorithm for mining a set of
 in large networks. Journal of Statistical Mechanics: influential spreaders in complex networks. Physica
 Theory and Experiment, 2008. 2008(10). A: Statistical Mechanics and its Applications,
[46] Lancichinetti, A. , and S. Fortunato, Community 2019. 516: p. 58-65.
 detection algorithms: a comparative analysis. [57] Wang, M. , Li, W. , Guo, Y. , Peng, X. , and Li,
 Physical Review E Statistical Nonlinear & Soft Y. , Identifying influential spreaders in complex
 Matter Physics, 2009. 80(5): p. 056117. networks based on improved k-shell method.
[47] Yang, Z. , R. Algesheimer , and C. J. Tessone , A Physica A: Statistical Mechanics and its
 Comparative Analysis of Community Detection Applications, 2020. 554(prepublish).
 Algorithms on Artificial Networks. entific Reports, [58] Sheikhahmadi A , and Nematbakhsh M A,
 2016. 6. Identification of multi-spreader users in social
[48] V. A. Traag, L. Waltman, and N. J. van Eck, From networks for viral marketing. Journal of
 Louvain to Leiden: guaranteeing well-connected Information Science, 2017. 43(3).
 communities. Scientific Reports, 2019. 9(1). [59] Wang, X. , Li, X. , and Guanrong, C. ,
[49] Jiang, Z. Y. , Zeng, Y. , Liu, Z. H. , and Ma, J. F. , Introduction to Network Science. Higher
 Identifying critical nodes' group in complex Education Press, 2012. [汪小帆, 李翔, 陈关荣. 网
 networks. Physica A: Statistical Mechanics and its 络科学导论[M]. 高等教育出版社, 2012.]
 Applications, 2019. 514: p. 121-132.
[50] Wang, Z. , Wang, L. , Szolnoki, A. , and Perc, M. ,
 Evolutionary games on multilayer networks: a
 colloquium. The European Physical Journal B,
 2015. 88(5).

 www.jmest.org
JMESTN42354022 15214
You can also read