AN OVERVIEW OF RENEWABLE NATURAL GAS FROM BIOGAS - July 2020 - EPA 456-R-20-001
←
→
Page content transcription
If your browser does not render page correctly, please read the page content below
EPA 456-R-20-001

       AN OVERVIEW OF
RENEWABLE NATURAL GAS
          FROM BIOGAS

                 July 2020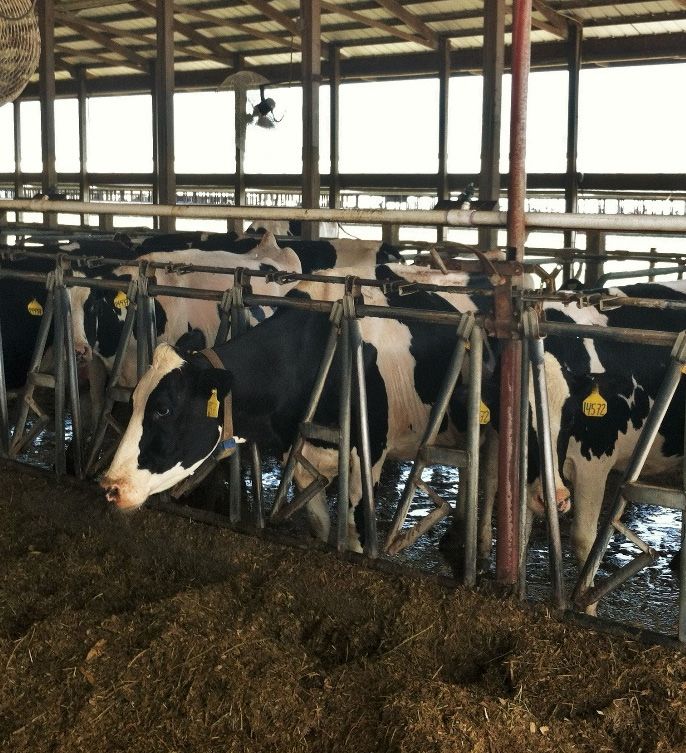
Table of Contents
1.0   INTRODUCTION .......................................................................................................................... 1
2.0   WHAT IS RNG? ............................................................................................................................ 1
      2.1        Sources of RNG............................................................................................................... 1
3.0   OPTIONS FOR RNG DELIVERY AND USE........................................................................................ 5
      3.1        Pipeline Injection............................................................................................................ 6
      3.2        Local Use ........................................................................................................................ 7
4.0   BENEFITS OF RNG ....................................................................................................................... 8
      4.1        Fuel Diversity and Availability ......................................................................................... 8
      4.2        Local Economic Impacts.................................................................................................. 8
      4.3        Local Air Quality ............................................................................................................. 9
      4.4        GHG Emission Reductions............................................................................................. 11
      4.5        Other Benefits of Natural Gas Vehicles ......................................................................... 13
5.0   OPERATIONAL RNG PROJECTS ................................................................................................... 14
6.0   CONSIDERATIONS FOR PROJECT FEASIBILITY AND POTENTIAL FOR GROWTH ............................ 16
7.0   PURIFICATION PROCESSES AND GENERAL TECHNOLOGIES ........................................................ 20
      7.1        CO2 Removal Technologies ........................................................................................... 21
      7.2        VOC/Siloxane Removal Technologies ............................................................................ 24
      7.3        N2 Removal Technologies ............................................................................................. 25
      7.4        O2 Removal Technologies ............................................................................................. 26
      7.5        The Future of RNG Processing Technologies ................................................................. 26
      7.6        Reliable Power Sources for Advanced Treatment.......................................................... 27
      7.7        Compressing RNG......................................................................................................... 27
8.0   BARRIERS, POLICY DRIVERS AND INCENTIVES RELATED TO RNG PROJECT DEVELOPMENT ......... 27
      8.1        Economic Barriers ........................................................................................................ 28
      8.2        Technical Barriers ......................................................................................................... 29
      8.3        Perception of RNG Quality ............................................................................................ 30
      8.4        Policies and Incentives Related to Pipeline Injection ..................................................... 30
      8.5        Policies and Incentives Related to Use of RNG as Transportation Fuel........................... 33
      8.6        State Regulatory Policies and Incentives Related to Electricity ...................................... 34
      8.7        Policies and Incentives Related to Sustainability and Environmental Goals ................... 35
9.0   EXAMPLES................................................................................................................................. 38
      9.1        RNG Projects with Feedstock, Delivery Method and End Use ........................................ 38

                                                                      i
9.2        Corporate Alternative Fuel Fleets ................................................................................. 44
10.0   RESOURCES............................................................................................................................... 45
11.0   ABBREVIATIONS, ACRONYMS AND UNITS OF MEASURE ............................................................ 46

Appendix A: Natural Gas Companies Accepting RNG into Pipelines………………………………………………………A-1

                                                                     ii
List of Tables
Table 1. AFLEET Tool Emission Results for Replacement of Washington, D.C.-Based Older Model Year
Gasoline Pickups or Diesel Refuse Trucks with New (Model Year 2019) Dedicated CNG Pickups or Refuse
Trucks ................................................................................................................................................... 10
Table 2. CI Ranges of Fossil and Renewable Vehicle Fuels from CARB LCFS-Certified Pathways .............. 12
Table 3. Breakdown of LFG-to-RNG Project Types and Sizes in the United States from the LMOP Landfill
and LFG Energy Project Database .......................................................................................................... 15
Table 4. WRRF Digester Gas-to-RNG Projects Operating in the United States in 2019 ............................ 15
Table 5. Number of Biogas Utilization Projects for Varying WRRF Capacities .......................................... 18
Table 6. Typical Flow Rates for Advanced CO2 Removal Technologies .................................................... 24

                                                                 List of Figures
Figure 1. Organic Waste Types Used to Make RNG .................................................................................. 2
Figure 2. LFG Treatment Stages and Biogas End Uses ............................................................................... 3
Figure 3. AD Products, Biogas Treatment and End Uses ........................................................................... 4
Figure 4. RNG Delivery Options and Typical RNG End Uses....................................................................... 5
Figure 5. Components of a Pipeline Interconnection ................................................................................ 6
Figure 6. Example CIs from LFG-RNG-CNG Life Cycle (g CO2e/MJ)........................................................... 13
Figure 7. CO2 Removal Technologies for U.S. LFG-to-RNG Projects in 2018............................................. 22
Figure 8. CO2 Removal Technologies for U.S. Manure-Based Biogas-to-RNG Projects in 2018................. 22
Figure 9. Breakdown of RNG Processing and Interconnection Costs ....................................................... 31

                                                                             iii
1.0 INTRODUCTION
EPA encourages the recovery and beneficial use of biogas as a renewable energy resource, including the
production of renewable natural gas (RNG) when feasible, as a means of reducing emissions and providing
other environmental benefits. RNG is a term used to describe biogas that has been upgraded to use in
place of fossil natural gas, either locally or remotely. EPA’s partnership programs for the reduction of
methane (CH4) emissionsthe Landfill Methane Outreach Program (LMOP), AgSTAR and Natural Gas
STARoffer data on potential sources of RNG feedstocks as well as technical and outreach resources and
tools to support RNG project development.
EPA developed this document to provide biogas stakeholders and other interested parties with a resource
to promote and potentially assist in the development of RNG projects. This document summarizes existing
RNG operational projects in the United States and the potential for growth from the main sources of
biogas feedstock. This document provides technical information on how raw biogas is upgraded into RNG
and ultimately delivered and used by consumers. The document also addresses barriers, policies and
incentives related to RNG project development.
2.0 WHAT IS RNG?
RNG is a term used to describe anaerobically-generated biogas that has been upgraded (or refined) for
use in place of fossil natural gas. Raw biogas typically has a CH4 content between 45 and 65 percent,
depending on the source of the biogas, and must go through a series of steps to be converted into RNG.
Treatment includes removing moisture, carbon dioxide (CO2) and trace-level contaminants (including
siloxanes, volatile organic compounds [VOCs] and hydrogen sulfide [H2S]), as well as reducing the nitrogen
(N2) and oxygen (O2) content. Once purified, the RNG has a CH4 content of 90 percent or greater. RNG
injected into a natural gas pipeline commonly has a CH4 content between 96 and 98 percent.
As a substitute for fossil natural gas, RNG has many potential uses. RNG can be used as vehicle fuel, to
generate electricity, in thermal applications, or as a bio-product feedstock. RNG can be injected into
natural gas transmission or distribution pipelines, or it can be used locally (i.e., at or near the site where
the gas is created). In this document, the term RNG does not encompass synthesis gas (syngas) produced
through gasification of biomass or any other feedstocks.
2.1 Sources of RNG
Currently, there are four main sources of biogas used to produce RNG in the United States: municipal solid
waste (MSW) landfills, anaerobic digestion (AD) at municipal water resource recovery facilities (WRRFs),
AD at livestock farms and AD at stand-alone organic waste management operations. At each of these
types of operations, biogas is produced as the organic materials are broken down by microorganisms in
the absence of O2 (i.e., anaerobic conditions). Figure 1 shows the main organic waste feedstocks that are
placed into an MSW landfill or an AD facility. “Organic” in this context means the wastes come from, or
were made of, plants or animals.
1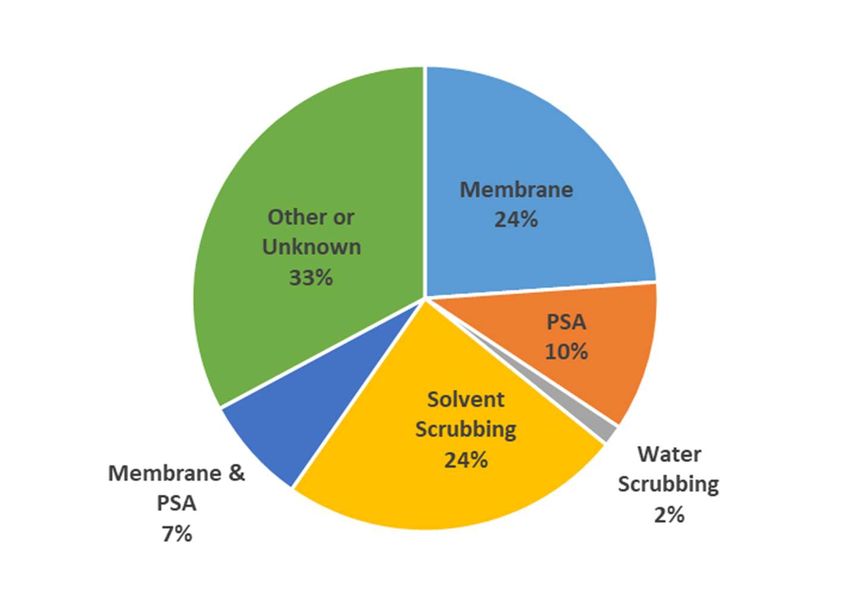
Figure 1. Organic Waste Types Used to Make RNG

MSW Landfills
Landfill gas (LFG) is generated in MSW landfills1 as the organic wastes decompose anaerobically. Instead
of escaping into the air, LFG can be captured, converted and used as an energy resource. Applicable
federal and state regulations require certain landfills to capture and destroy the LFG generated; for these
sites an LFG collection infrastructure is already in place and potentially ready for an energy project. The
diagram in Figure 2 provides an overview of the levels of treatment that LFG can undergo to be used as
an energy resource.

1
    More information about MSW landfills is available at U.S. EPA. What Is a Municipal Solid Waste Landfill?
    https://www.epa.gov/landfills/municipal-solid-waste-landfills#whatis. Accessed November 18, 2019.

                                                           2
Figure 2. LFG Treatment Stages and Biogas End Uses
Municipal WRRFs
Many municipal WRRFs (also known as wastewater treatment facilities or publicly owned treatment
works) use AD to treat sewage sludge on site, while some facilities send the sludge to other facilities for
AD treatment. Biogas is one of the byproducts of sludge treatment through AD. WRRFs typically generate
biogas with a high CH4 content and extremely low N2 and O2 contents, which make them attractive
candidates for RNG projects.
Approximately 133 to 177 WRRFs with AD were “co-digesting” other waste streams, such as source-
separated food wastes, in 2017. 2 Co-digestion of food waste with WRRF sludge allows facilities to use
existing assets and infrastructure to meet the growing interest in food waste management. With co-
digestion, facilities can more efficiently use process equipment when they process multiple waste streams
together. Facilities can also use co-digestion to adjust the proportions of solids being digested to improve
digestion and increase biogas production.
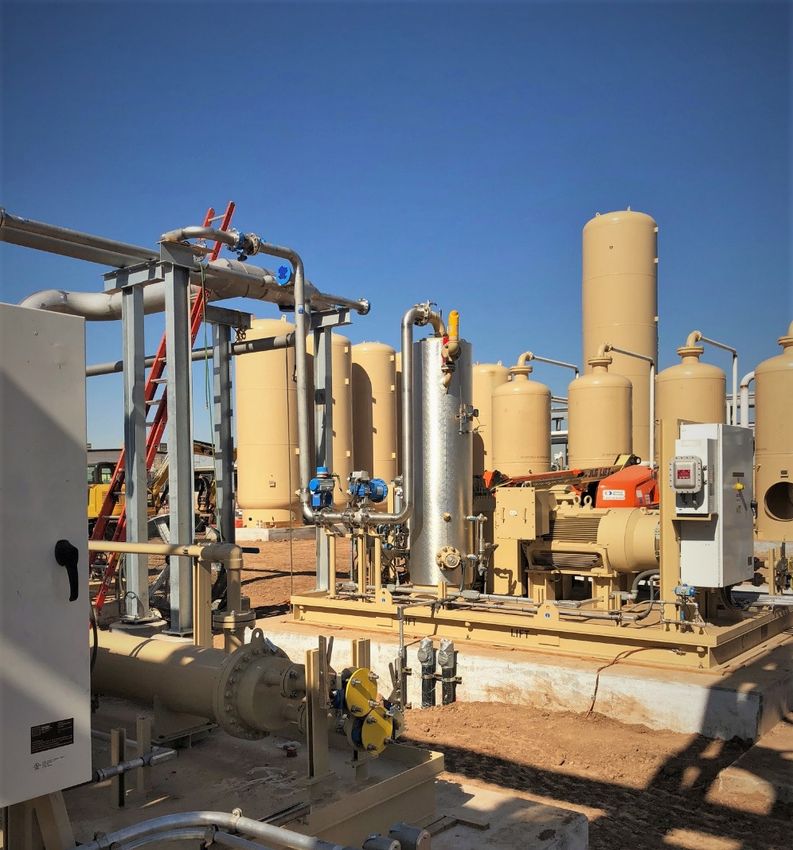
Livestock Farms
Livestock farms can use AD to convert livestock (e.g., dairy, beef, swine, poultry) manure into biogas and
digestate.3 Some manure-based digesters co-digest other waste materials with the manure, including
upstream (pre-consumer) food wastes such as beverage and distillery waste; fats, oils and greases;
2
Goldstein, N. October 2017. The State of Organics Recycling in the U.S. BioCycle 58(9): 22.
https://www.biocycle.net/2017/10/04/state-organics-recycling-u-s/. Accessed March 4, 2020. See Table 3 and
additional discussion about data from the Water Environment & Reuse Foundation on page 6 of Goldstein’s report.
3
Digestate is the nutrient-rich material left over after AD.
3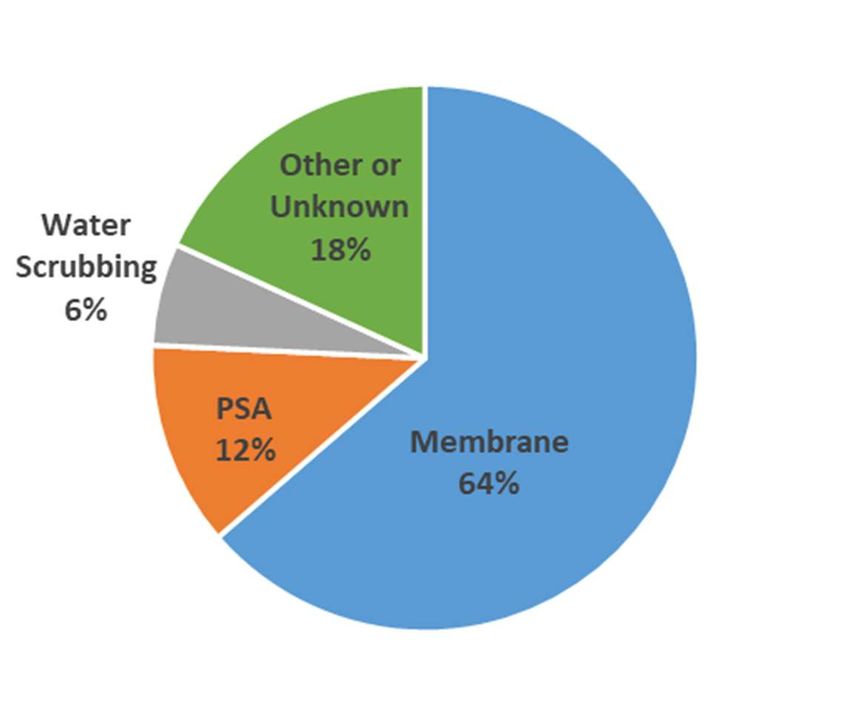
industrial food byproducts; or processing wastes from a dairy or slaughterhouse. Various sources estimate
approximately 100 manure-based AD projects are co-digesting other organic waste materials. 4 The
diagram in Figure 3 presents the biogas and typical digestate products from manure-based AD projects
and the levels of treatment that AD biogas can undergo to be used as an energy resource.
Figure 3. AD Products, Biogas Treatment and End Uses
Stand-Alone Organic Waste Management Operations
Stand-alone digesters are the newest source of RNG in the United States. These AD projects break down
source separated organic materialincluding food wasteto generate biogas, which can be converted
to RNG. Digesters that primarily process food waste can also co-digest other organic materials including
yard waste. 5 A 2018 EPA survey of U.S. AD facility operators showed that a total of 9.2 million tons of food
waste was processed at 44 stand-alone digesters during 2016. The survey report indicates there were 62
stand-alone digesters operating in 2016, which suggests the actual amount of food waste processed in
4
Goldstein, N. October 2017. The State of Organics Recycling in the U.S. BioCycle 58(9): 22.
https://www.biocycle.net/2017/10/04/state-organics-recycling-u-s/. Accessed March 4, 2020. The article estimates
that 94 manure-based AD projects were co-digesting. April 2017 research conducted using the AgSTAR database,
case studies, articles and profiles showed 111 manure-based projects were co-digesting other materials. In March
2020, the AgSTAR database indicated 104 manure AD projects that co-digest other organic materials.
5
U.S. EPA. Types of Anaerobic Digesters. Stand-Alone Digesters. https://www.epa.gov/anaerobic-digestion/types-
anaerobic-digesters#StandAloneAD. Accessed March 25, 2019.
4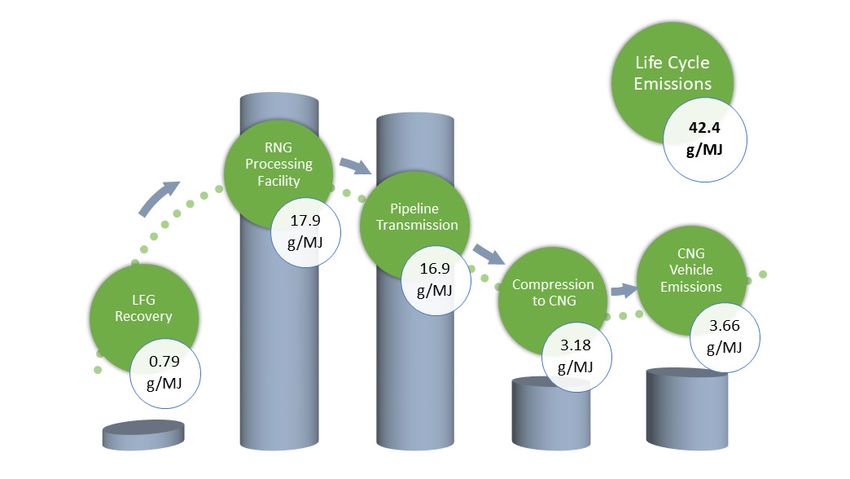
this manner was higher. In addition, 20 of the stand-alone digesters surveyed processed more than 31
million gallons of liquid non-food waste and nearly 83,000 tons of solid non-food waste in 2016. 6

3.0       OPTIONS FOR RNG DELIVERY AND USE
As shown in Figure 4, the two main methods for delivering RNG to end users are injection into a pipeline
(fossil natural gas pipeline or dedicated RNG pipeline) or onsite/local applications (e.g., onsite vehicle
fueling station, transport by truck). RNG is so chemically similar to fossil natural gas that it is a “drop-in”
substitute, making it versatile. The methane in RNG is identical to methane in fossil natural gas, but the
two gasses have constituents in very low concentrations that the other does not have. In addition to being
used as vehicle fuel or for generating electricity, RNG can also be used to meet thermal energy demands
(heat, steam, hot water, cooling or other processes) in the industrial, commercial, institutional or
residential sectors.

                           Figure 4. RNG Delivery Options and Typical RNG End Uses

Over time, market drivers have shaped how RNG is used. In 2011, nearly all the RNG projects operating in
the United States were providing RNG to generate electricity off site, as an effect of state-level Renewable
Portfolio Standard (RPS) programs. 7 As the market for renewable transportation fuels emerged through
federal and state rules and incentives, the overall number of RNG projects grew rapidly and the end use

6
      U.S. EPA. September 2019. Anaerobic Digestion Facilities Processing Food Waste in the United States (2016).
      EPA/903/S-19/001. https://www.epa.gov/anaerobic-digestion/anaerobic-digestion-facilities-processing-food-waste-
      united-states-survey.
7
      Escudero, J. May 2017. Powering Businesses, Homes & Vehicles with Waste: Growing the Economy & Jobs with
      Renewable Natural Gas. https://www.eesi.org/files/Johannes_Escudero_052317.pdf.

                                                          5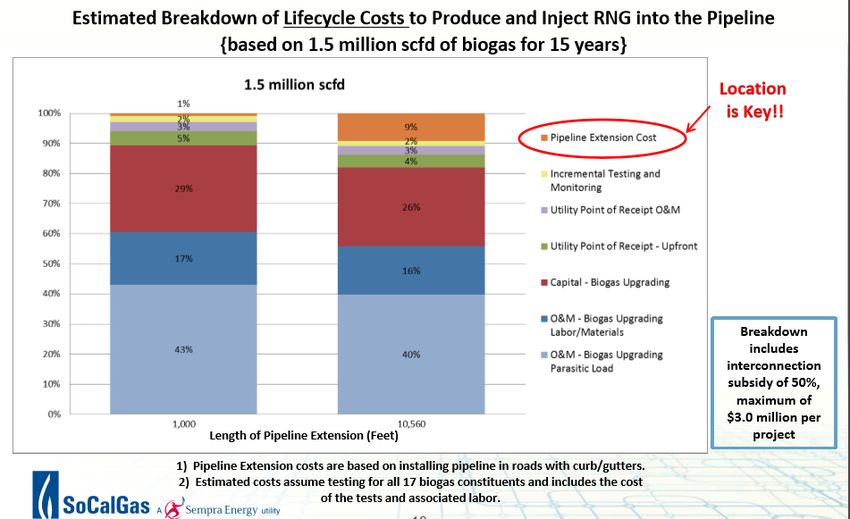
of the RNG shifted dramatically. In 2017, 76 percent of RNG projects were converting RNG into
transportation fuels, while 24 percent generated electricity off site. 8

3.1       Pipeline Injection
Many RNG projects inject the product into a fossil natural gas pipeline. Appendix A lists known natural gas
utilities who have received or plan to receive RNG into their networks. The RNG must meet the
specification requirements of the receiving gas utility. This delivery method can be expensive due to
extensive planning, land purchases, permitting, construction, and interconnection fees and equipment.
However, pipeline injection can convey the RNG across a vast distribution network and provide flexibility
on how and where the RNG is ultimately used.

Interconnection consists of two primary components, a “point of receipt” and a “pipeline extension,” as
shown in Figure 5. The point of receipt monitors the quality of the RNG to ensure that it meets
specifications and includes equipment to prevent non-compliant gas from entering the pipeline. The point
of receipt also meters and may odorize the RNG prior to injection. RNG can be delivered to the point of
receipt from the production facility through piping built specifically for this purpose or by truck.

The pipeline extension is a dedicated pipeline to transfer the RNG from the point of receipt to the nearest
fossil natural gas pipeline that has capacity to accept it. All projects have a pipeline extension to allow
space for odorization, gas quality monitoring, and a shut off valve. Some distribution-level pipelines do
not have the capacity to receive RNG injections (which are constant), due either to the cyclical nature of
the pipeline users or to the size and volume of fossil natural gas flow. When the pipeline nearest to an
RNG processing plant cannot accept the RNG, a longer pipeline extension is needed to reach a fossil
natural gas pipeline with adequate capacity. 9

                              Figure 5. Components of a Pipeline Interconnection 10

8
      Escudero, J. May 2017. Powering Businesses, Homes & Vehicles with Waste: Growing the Economy & Jobs with
      Renewable Natural Gas. https://www.eesi.org/files/Johannes_Escudero_052317.pdf.
9
      Lucas, J. October 2017. Interconnecting to the SoCalGas Pipeline. Presented at Power of Waste: RNG for California,
      Sacramento. https://www.socalgas.com/1443741248177/PowerofWaste_SoCalGas_Lucas.pdf.
10
      Lucas, J. September 2017. Renewable Natural Gas Projects. Presented at EPA Technology Transfer Workshop:
      Renewable Natural Gas—Driving Value for Natural Gas and Biogas Sectors.
      https://www.epa.gov/sites/production/files/2017-10/documents/lucas_rng_2017_panel1.pdf. Figure used with
      permission from Southern California Gas Company.

                                                            6
Alternatively, RNG can be injected into a dedicated pipeline instead of into a natural gas pipeline network.
Vehicle Fuel
RNG can be used as fuel, as compressed natural gas [CNG] or liquefied natural gas [LNG], in a variety of
vehicle types. According to the U.S. Department of Energy’s (DOE’s) Alternative Fuels Data Center, in
March 2019 there were 914 public and 678 private CNG stations and 66 public and 55 private LNG stations
in the country. 11
As of March 2020, the majority (91 percent) of LFG-sourced RNG pipeline injection projects were providing
at least a portion of the RNG to a vehicle fuel market down the pipeline. 12 In these cases, fueling stations
far removed from the biogas source were receiving the RNG at the other end of a pipeline network.
Electricity Production
While many biogas projects generate electricity from partially conditioned biogas, there are a number of
projects (primarily landfill-based) where RNG is injected into a pipeline and used to generate electricity.
Thermal Applications
Numerous biogas energy projects use nearly raw biogas in direct thermal applications such as boilers,
greenhouses and kilns. RNG projects for direct thermal applications are less common, as the bulk of
incentives are for transportation and electricity end uses. However, as discussed in Section 8.7, some state
policies have created a new interest in RNG for direct thermal uses.
3.2 Local Use
The predominant use of RNG on site or locally is for vehicle fuel.
Onsite Vehicle Fuel
Onsite RNG vehicle fuel projects avoid the need to meet natural gas pipeline specifications, and typically
the vehicle fuel specifications are less stringent than the requirements from a pipeline operator. In
addition, these projects avoid the costs to interconnect and transport the gas via pipeline. However, there
must be an adequate and consistent demand for the RNG vehicle fuel. Matching the fleet demand to the
RNG resource can be problematic in some rural areas with a source of biogas, as larger fleets are generally
located in urban centers.
Often, the owner of the biogas source also has a vehicle fleet, for example a public works department that
has a landfill and/or WRRF as well as a CNG-compatible fleet inventory. Some onsite fueling stations also
allow corporate fleets operating in the area to use their stations. In either case, these types of projects,
wherein the vehicles delivering a feedstock (e.g., garbage or food waste) are fueled by RNG from biogas
produced by that feedstock, are considered “closed loop” or circular projects.
Generally, local-use vehicle fuel projects are smaller scale than pipeline injection vehicle fuel projects.
Taking LFG-based RNG as an example, the average flow rate of local-use CNG projects is 145 cubic feet
11
U.S. DOE. Alternative Fueling Station Locator. https://afdc.energy.gov/stations/#/analyze?country=US. Accessed
March 27, 2019.
12
U.S. EPA. March 2020. Landfill and Landfill Gas Energy Project Database. https://www.epa.gov/lmop/landfill-gas-
energy-project-data.
7per minute (cfm) of biogas inlet, while the average for pipeline injection projects with a vehicle fuel
component is 2,940 cfm of biogas inlet, twenty times larger. 13
Virtual Pipeline
If an RNG processing plant is not close to potential end users or an existing pipeline, a “virtual pipeline”
can move compressed RNG from the point of generation to the point of injection or use. In a virtual
pipeline scenario, the RNG is compressed to up to 4,000 pounds per square inch for injection into a natural
gas tube trailer, and then transported off site by truck. Once it reaches the destination, the RNG is
decompressed back down to the pressure required by the receiving facility. The decompression site must
include a “decant” facility that heats the RNG as it decompresses to minimize the freezing of valves and
regulators due to decompression. A virtual pipeline allows remote landfills, farms or other biogas sources
to market their RNG in populated areas. Leasing companies that will contract for loading, transporting
and off-loading the RNG are also available. The costs to transport RNG in a virtual pipeline are in addition
to the costs associated with RNG processing equipment and infrastructure needed to compress and
decompress the gas.
Some projects may employ more than one delivery mechanism to match the RNG supply with demand.
For example, a project may have an onsite vehicle fueling station for a portion of the fuel and transport
the remainder to an offsite fueling station via a virtual pipeline.
4.0 BENEFITS OF RNG
Developing RNG resources is one way to diversify fuel supplies and increase fuel security, provide
economic benefits to communities and end users, improve local air quality and reduce greenhouse gas
(GHG) emissions.
4.1 Fuel Diversity and Availability
Biogas feedstocks for RNG are generated continuously from a variety of sources (offering high availability
rates), and the use of RNG increases and diversifies domestic energy production. For example, Atlantic
City, New Jersey used CNG-fueled buses to provide critical services in 2012 after Hurricane Sandy when
gasoline supplies were limited, showing the value of alternative fuel vehicles during natural disasters. 14
4.2 Local Economic Impacts
Developing RNG projects can benefit local economies through the construction of infrastructure and sale
of vehicles that can use this fuel source. Adding a renewable source of vehicle fuel to an area has the
potential to draw outside vehicle fleets to a community, as the CNG produced from biogas can potentially
be sold at a lower cost than fossil fuel-based vehicle fuel (due to incentives such as EPA’s Renewable Fuel
Standard [RFS]) or corporations may be looking for ways to green their fleets or increase corporate
sustainability.
A 2017 study conducted for the California Natural Gas Vehicle Coalition analyzed the economic impacts
of converting heavy-duty diesel-fueled trucks in California to RNG fuel, including the benefits of building
13
See details and ranges of project sizes in Table 3 in Section 5.0 of this document. Data source is U.S. EPA. March
2020. Landfill and Landfill Gas Energy Project Database. https://www.epa.gov/lmop/landfill-gas-energy-project-
data.
14
Bluestein, L. April 2013. Clean Cities Webinar: Planning Ahead with Alternative Fuelsa lesson from Sandy.
https://cleancities.energy.gov/files/u/news_events/document/document_url/49/emergency_preparedness_webina
r.pdf.
8RNG processing and fueling station infrastructure and the impact of purchasing CNG vehicles. 15 The study
found that California RNG production facilities (based on a mix of landfill, WRRF and dairy feedstocks)
would generate about 8.5 to 11.2 jobs per million diesel gallon equivalent of transportation fuel. By
contrast, the petroleum refinery industry yields about 1.6 jobs per million diesel gallon equivalent of
transportation fuel. Additionally, for every job created through investment in low nitrogen oxide (NOX)-
emitting natural gas trucks, natural gas fueling infrastructure and RNG production facilities, about 2.0 jobs
are created in supporting industries (indirect) and via spending by employees that are directly or indirectly
supported by these industries (induced).
For projects where there is common ownership between the RNG source and the fleet using RNG, vehicle
fuel from RNG can also provide price stability (e.g., compared to diesel fuel purchases) through mid-term
to long-term RNG supply contracts or through creating fuel for internal consumption.
4.3 Local Air Quality
Replacing traditional diesel or gasoline with RNG vehicle fuel can reduce pollutant emissions, resulting in
local air quality benefits.
RNG combusts similarly to fossil natural gas, so pipeline operators make no distinctions between the two
once the RNG meets the required specification and is injected into the pipeline network. Fossil natural gas
typically contains several non-methane hydrocarbons, including ethane, propane, butane and pentane,
as well as some trace organics, all in small concentrations. RNG does not generally contain non-methane
hydrocarbons but does share some other low-concentration constituents with fossil natural gas, such as
CO2, N2, O2, H2S and total sulfur. Fossil natural gas and RNG both contain trace organics (e.g., aromatic
hydrocarbons, aldehydes and ketones), but samples of RNG show these in much lower concentrations
than in fossil natural gas. 16,17
Since 2017, most newly built vehicles are required to meet the same emission standards (including NOX,
particulate matter [PM] and carbon monoxide [CO]) regardless of fuel type, 18 so new natural gas vehicle
emissions are comparable to those of new gasoline and diesel vehicles. However, when older model
gasoline or diesel vehicle fleets are replaced with new natural gas vehicles, certain local air pollutant
emissions are often reduced on an as-driven basis.
For example, replacement or aftermarket conversion of older gasoline vehicles with natural gas models
can provide reductions across pollutants. The Argonne National Laboratory’s Alternative Fuel Life-Cycle
Environmental and Economic Transportation (AFLEET) tool 19 can be used to estimate emission reductions
15
ICF. May 2017. Economic Impacts of Deploying Low NOX Trucks Fueled by Renewable Natural Gas.
https://www.masstransitmag.com/home/document/12330911/economic-impacts-of-deploying-low-nox-trucks-
fueled-by-renewable-natural-gas.
16
Gas Technology Institute. May 2012. Guidance Document for the Introduction of Landfill-Derived Renewable Gas
into Natural Gas Pipelines. https://www.gti.energy/wp-
content/uploads/2018/09/120007_Landfill_Guidance_Document_FINALREPORT-05-9-2012.pdf.
17
Wiley, Kristine. October 2018. Renewable Natural Gas (RNG): Gas Quality Considerations. Presented at 2018 Natural
Gas STAR and Methane Challenge Renewable Natural Gas Workshop. https://www.epa.gov/natural-gas-star-
program/2018-natural-gas-star-and-methane-challenge-renewable-natural-gas-workshop.
18
U.S. EPA. Final Rule for Control of Air Pollution from Motor Vehicles: Tier 3 Motor Vehicle Emission and Fuel
Standards. https://www.epa.gov/regulations-emissions-vehicles-and-engines/final-rule-control-air-pollution-motor-
vehicles-tier-3.
19
Argonne National Laboratory. November 2018. AFLEET Tool. https://afleet-web.es.anl.gov/home/. Emission
estimates based on a fleet replacement location in Washington, D.C.
9for fleet replacement on an as-driven basis. A fleet location of Washington, D.C., was used for illustrative
purposes along with the AFLEET tool’s default input parameters, including annual mileage and fuel
economy. Similar patterns in emission reduction percentages were derived for other fleet locations.
The AFLEET tool was used to analyze the emissions from gasoline pickups and refuse trucks in three older
model years, with model year 2010 representing a median life age for the national pickup population and
model year 2012 representing a median life age for the national refuse truck population.
The results in Table 1 indicate substantial percentage reductions in NOX, VOC, PM10, PM2.5, CO and sulfur
dioxide (SOX) emissions for each of the older gasoline pickup models, as compared with a new (model year
2019) CNG pickup, with the most significant reductions achieved for the oldest model year. For refuse
trucks, substantial emission reductions were shown for NOX, exhaust VOC, PM10, PM2.5 and SOX, again with
the largest reductions from the oldest vehicle replacements.
Table 1. AFLEET Tool Emission Results for Replacement of Washington, D.C.-Based Older Model Year
Gasoline Pickups or Diesel Refuse Trucks with New (Model Year 2019) Dedicated CNG Pickups or
Refuse Trucks
Percentage Emission Reductions if Replaced by 2019 Model Year CNG
Fuel/Vehicle Model
Vehicle
Type Year
VOC VOC
NOX PM10 PM2.5 CO SOX
(Exhaust) (Evaporative)
Gasoline
2005 87.4% 86.0% 87.5% 73.0% 68.9% 84.3% 38.1%
Pickup
2007 80.2% 78.8% 85.4% 73.0% 65.0% 81.9% 38.1%
2010 66.7% 69.1% 75.6% 66.3% 60.0% 74.6% 38.1%
Diesel Refuse
2006 99.4% 93.9% 7.14% 97.0% 96.9% -571% 43.0%
Truck
2009 99.2% 43.8% 7.14% 42.2% 41.5% -2,180% 43.0%
2012 96.8% 16.9% 7.14% 38.1% 38.5% -3,025% 43.0%
However, CO emissions increased significantly for the CNG refuse trucks relative to the diesel baseline.
This increase is due to the newest CNG refuse trucks being powered by spark-ignited cycle engines with
three-way catalysts. Compared to the diesel refuse trucks, which are powered by compression ignition
cycle engines, the CNG spark-ignited engines operate at tightly controlled stoichiometric fuel–air ratios
that allow for three-way catalyst control 20 of NOX, VOC and CO emissions but produce inherently higher
CO emissions. However, new CNG refuse trucks do still comply with existing heavy-duty engine emission
standards even with the higher CO emissions. When replacing older heavy-duty diesel vehicles with new
dedicated CNG vehicles, local communities should consider this trade-off of lower NOX and PM emissions
20
Three-way catalysts are exhaust emission control devices for achieving simultaneous control of tailpipe NOX, VOC
and CO emissions. Three-way catalysts typically are deployed in conjunction with closed loop, stoichiometric fuel–air
ratio fuel delivery to the engine for achieving the highest efficiency in catalytic reduction of NOX, and oxidation of
VOCs and CO in the engine exhaust emissions stream.
10but higher CO emissions with respect to existing local air quality conditions and compliance with national
standards.
Apart from combustion emissions, gasoline and diesel vehicles produce hydrocarbon emissions from the
evaporation of fuel in onboard fuel tanks, but natural gas vehicle fuel systems emit minimal evaporative
hydrocarbon emissions because they are sealed to the atmosphere.
4.4 GHG Emission Reductions
When fossil natural gas is replaced by RNG, the resulting GHG emission reductions provide a climate
benefit. One way to characterize the climate benefit of a fuel is to determine its “carbon intensity” (CI) or
“carbon footprint” based on a complete life cycle assessment that estimates the GHG emissions
associated with producing and consuming the fuel. Argonne National Laboratory’s AFLEET tool estimates
that natural gas vehicles operating on fuel derived from RNG can yield GHG emission reductions of up to
75 percent, compared to gasoline or diesel vehicles. 21 The California Air Resources Board (CARB) uses
similar life cycle assessment tools to estimate the GHG emissions associated with vehicle fuels for
implementation of the state’s Low Carbon Fuel Standard (LCFS).
Natural gas in any form (fossil or RNG) is less carbon-intensive than the other fossil fuels it typically
replaces, including conventional transportation fuels (e.g., gasoline, diesel) in most cases and coal or
petroleum for generating electricity. 22,23 RNG provides an additional benefit over fossil natural gas
because it generally has a lower total carbon footprint, after accounting for emissions from fuel
production, transport and use. 24,25,26 RNG’s carbon footprint is even lower if a project can also take into
account directly reducing CH4 emissions from the organic waste used to produce the fuel.
Fuels from some RNG feedstocks can achieve negative carbon footprints by reducing CH4 emissions
through avoiding “business-as-usual” disposal pathways, such as projects that involve AD of manure and
organic wastes. 27,28 In contrast, projects in which RNG is sourced from a landfill or WRRF where business-
as-usual practices collect and destroy CH4 cannot account for any climate benefit from that CH4
destruction. These projects can account for the emissions avoided through recovering energy that would
21
Argonne National Laboratory. AFLEET Tool. https://afleet-web.es.anl.gov/home/. Accessed March 4, 2020.
22
U.S. EIA. Frequently Asked Questions. How Much Carbon Dioxide Is Produced When Different Fuels Are Burned?
https://www.eia.gov/tools/faqs/faq.php?id=73&t=11. Accessed March 4, 2020.
23
U.S. EPA. February 2018. Emissions & Generation Resource Integrated Database (eGRID). eGRID2016.
24
Kampman, B., C. Leguijt, T. Scholten, J. Tallat-Kelpsaite, R. Brückmann, G. Maroulis, J.P. Lesschen, K. Meesters, et al.
December 2016. Optimal Use of Biogas from Waste Streams: An Assessment of the Potential of Biogas from
Digestion in the EU Beyond 2020. European Commission.
https://ec.europa.eu/energy/sites/ener/files/documents/ce_delft_3g84_biogas_beyond_2020_final_report.pdf.
25
Hass, H., H. Maas, R. Edwards, L. Lonza, J.F. Larivé, and D. Rickeard. January 2014. Well-to-wheels report version 4.a:
JEC well-to-wheels analysis of future automotive fuels and powertrains in the European context. Report EUR 26236
EN. European Commission. https://ec.europa.eu/jrc/en/publication/eur-scientific-and-technical-research-
reports/well-wheels-report-version-4a-jec-well-wheels-analysis.
26
Clark, C.E., J. Han, A. Burnham, J.B. Dunn, and M. Wang. December 2011. Life-Cycle Analysis of Shale Gas and
Natural Gas. ANL/ESD/11-11. Argonne National Laboratory. https://greet.es.anl.gov/publication-shale_gas.
27
CARB and California Environmental Protection Agency. November 2014. Compliance Offset Protocol Livestock
Projects: Capturing and Destroying Methane from Manure Management Systems.
https://ww3.arb.ca.gov/cc/capandtrade/protocols/livestock/livestock.htm.
28
CARB and California Environmental Protection Agency. August 2018. Tier 1 Simplified CI Calculator Instruction
Manual: Biomethane from Anaerobic Digestion of Organic Waste. https://ww3.arb.ca.gov/fuels/lcfs/ca-greet/ca-
greet.htm.
11otherwise be flared and wasted (as energy recovery is not required), however they have a positive carbon
footprint overall.
Average CI Comparison for Vehicle Fuels
Using data from pathways that CARB has certified under the LCFS, Table 2 provides a comparison of
average CIs for several fossil and renewable vehicle fuels. CNG and LNG from fossil natural gas have
average CIs between 13 and 22 percent lower per unit of delivered energy than diesel, while RNG-derived
CNG and LNG have average CIs between 49 and 359 percent lower per unit of delivered energy than diesel.
Table 2. CI Ranges of Fossil and Renewable Vehicle Fuels from CARB LCFS-Certified Pathways29,30
Number Average Percent
Average CI Range
Fuel Feedstock of Change Relative to
(g CO2e/MJ) (g CO2e/MJ)
Pathways Diesel a
Diesel Fossil Crude 100 100 1 -
CNG, Fossil Fossil Natural Gas 80 78 to 81 6 -21%
LNG, Fossil Fossil Natural Gas 90 86 to 94 4 -11%
Electricity California Grid 105 105 1 3.1%
CNG,
Renewable LFG 46 31 to 79 63 -55%
Manure -271 -372 to -151 10 -370%
Wastewater 30 8 to 43 4 -70%
Food and Green
Waste -11 -23 to 0.34 2 -111%
LNG,
Renewable LFG 54 7 to 83 49 -46%
a
Negative percentages indicate a net reduction in CI. The CI of diesel is 100.45 grams of CO2 equivalent per
megajoule (g CO2e/MJ).
The CIs of fuels from different RNG feedstocks and fossil natural gas are characterized by impacts
occurring at distinct phases of the fuel life cycle. For example, tailpipe emissions of CO2 from RNG fuels
are considered carbon neutral because the carbon is biogenic, while tailpipe emissions of CO2 from fossil
natural gas fuels are not. As a result, CIs of fossil natural gas-based vehicle fuels are most impacted by
tailpipe emissions, with lesser contributions from refining and resource extraction. As another example,
RNG fuels derived from LFG receive no credits for CH4 reduction under the LCFS because the baseline set
by CARB for this pathway is flaring of the LFG. As a result, LFG-derived vehicle fuels have CIs that are most
heavily influenced by the biogas upgrading plant and emissions during pipeline transport. 31 The exact CI
of a particular project depends on various factors and is particularly sensitive to the source of the energy
used to power the gas upgrading equipment and compression in the pipeline, as well as the length of the
transmission pipeline.
29
CARB. LCFS Pathway Certified Carbon Intensities.
https://www.arb.ca.gov/fuels/lcfs/fuelpathways/pathwaytable.htm. Accessed March 15, 2020.
30
CARB. 2015. LCFS. Final Regulation Order. Table 6. Tier 2 Lookup Table for Gasoline and Diesel and Fuels That
Substitute for Gasoline and Diesel. https://ww3.arb.ca.gov/regact/2015/lcfs2015/lcfsfinalregorder.pdf.
31
CARB and California Environmental Protection Agency. 2018. Tier 1 Simplified CI Calculator for Biomethane from
North American Landfills. https://ww3.arb.ca.gov/fuels/lcfs/ca-greet/ca-greet.htm. Accessed March 4, 2020.
12CIs for a Hypothetical LFG-to-CNG Project
Figure 6 illustrates example CIs associated with each major step in a hypothetical LFG-to-CNG project: LFG
recovery at the landfill, treatment/processing of the raw LFG into RNG, transporting the RNG via pipeline
networks to the CNG fueling stations, compression of the RNG at CNG fueling stations and emissions from
the CNG vehicles. These example CIs were determined using CARB’s Tier 1 Simplified CI Calculator for
Biomethane from North American Landfills with the following inputs and assumptions:
• Input of 3,100 cfm raw LFG at 50 percent CH4.
• RNG processing plant that:
o Is powered by grid-purchased electricity.
o Does not require any supplemental propane or fossil natural gas to achieve the target
specifications for pipeline injection of the RNG.
o Has an energy consumption of 0.009 kilowatt-hours per standard cubic foot (scf) of LFG
and a 90 percent capture efficiency of CH4, yielding 455 British thermal units (Btu) of
RNG per scf (Btu/scf) of LFG.
• Three thousand miles of gas pipeline to transport the RNG from the landfill to the CNG fueling
stations.
• U.S. average mix for the energy used to power the LFG recovery equipment, RNG
upgrading/processing plant and transport of the LFG via pipeline.
• California grid mix for the energy used to compress RNG at the CNG fueling station.
Figure 6. Example CIs from LFG-RNG-CNG Life Cycle (g CO2e/MJ)
4.5 Other Benefits of Natural Gas Vehicles
Natural gas vehicles, including those using RNG-derived fuel, offer other benefits to the community.
Members of the public often view local green programs positively, which can present great marketing and
publicity opportunities for a community. According to Clean Energy Fuels, dedicated natural gas-fueled
13refuse trucks produce less noise than comparable diesel-fueled refuse trucks, with a difference greater
than 10 decibels at idle. 32 Reducing noise from trucks has positive and measurable health and economic
benefits. 33
5.0 OPERATIONAL RNG PROJECTS
Across all feedstocks, 34 states have more than 100 RNG projects operating and approximately 40 under
construction as of February 2020. 34 EPA provides a national map showing the locations of projects
producing RNG from either LFG or manure-based AD biogas. 35
MSW Landfills
According to the EPA LMOP Landfill and LFG Energy Project Database, as of March 2020 there were 564
operational LFG energy projects, 65 of which produced RNG. 36 Table 3 provides a summary of the 65 LFG-
to-RNG projects in the United States, including the number of projects and their sizes in terms of the
amount of LFG used to create the RNG. The majority of these projects are producing RNG for use as
transportation fuel, whether used locally (on site or near the landfill) or transported via pipeline to a
location further away. The other projects use the RNG to generate electricity in thermal applications or to
offset fossil natural gas usage in another manner. 37
The first LFG-to-RNG project in the United States operated from 1975 to 1985 at the Palos Verdes Landfill
in Los Angeles County, California. 38,39 The plant was designed to process 2 million standard cubic feet per
day (mmscfd) of raw LFG into approximately 1 mmscfd of RNG for injection into a nearby pipeline. 40
32
Clean Energy Compression. July 2015. What Refuse Truck Fleets Are Doing to Make Our Air Cleaner.
https://www.cleanenergyfuels.com/compression/blog/refuse-truck-fleets-switch-natural-gas-power-who-when-
where-why/.
33
Pignier, N. May 2015. The Impact of Traffic Noise on Economy and Environment: A Short Literature Study. KTH Royal
Institute of Technology. https://www.diva-portal.org/smash/get/diva2:812062/FULLTEXT01.pdf.
34
Coalition for Renewable Natural Gas. RNG Production Facilities Database. http://www.rngcoalition.com/rng-
production-facilities. Accessed February 11, 2020.
35
U.S. EPA. RNG Project Map. https://www.epa.gov/lmop/renewable-natural-gas#rngmap. Accessed July 22, 2019.
36
U.S. EPA. March 2020. Landfill and Landfill Gas Energy Project Database. https://www.epa.gov/lmop/landfill-gas-
energy-project-data.
37
U.S. EPA. March 2020. Landfill and Landfill Gas Energy Project Database. https://www.epa.gov/lmop/landfill-gas-
energy-project-data.
38
Cosulich, J., S.-L. Ahmed, and J.F. Stahl. 1992. Palos Verdes Landfill Gas to Energy Facility. Formerly available at
http://www.seas.columbia.edu/earth/wtert/sofos/nawtec/1992-National-Waste-Processing-Conference/1992-
National-Waste-Processing-Conference-32.pdf.
39
Bowerman, F., N. Rohatgi, K. Chen, and R. Lockwood. July 1977. A Case Study of the Los Angeles County Palos
Verdes Landfill Gas Development Project. EPA/600/3-77/047.
https://cfpub.epa.gov/si/si_public_record_Report.cfm?Lab=ORD&dirEntryID=49543.
40
U.S. DOE. March 1978. Proceedings of a Symposium on the Utilization of Methane Generated in Landfills.
https://www.osti.gov/biblio/6652887.
14Table 3. Breakdown of LFG-to-RNG Project Types and Sizes in the United States from the LMOP
Landfill and LFG Energy Project Database
RNG Delivery Method / Number of
Project Size—LFG Flow (cfm)
Project Type Projects
Local / CNG 6 49 to 201 (average 145)
Local / LNG 1 2,410
Pipeline Injection / Vehicle
53 413 to 10,417 (average 2,753)
Fuel
Pipeline Injection / Industrial,
5 757 to 5,833 (average 2,940)
Electricity or Other
Municipal WRRFs
In 2013, about 48 percent of the total wastewater flow in the United States was treated through AD. 41
According to the U.S. GHG Inventory, in 2017 approximately 18,260 million gallons per day (MGD) of
wastewater effluent were sent to WRRFs with AD. 42 In 2019, 13 WRRF biogas projects (listed in Table 4)
were creating RNG. 43,44
Table 4. WRRF Digester Gas-to-RNG Projects Operating in the United States in 2019
WRRF Average Flow Rate in
WRRF Project Location Start Year
MGD
91st Avenue, Phoenix, AZ 2019 138
City of San Mateo, CA 2016 15.7
Las Gallinas Valley Sanitary District, CA 2017 2.67
Point Loma, CA 2012 175
Persigo (Grand Junction), CO 2015 8.5
South Platte Water Renewal Partners, CO 2019 ~24
Honouliuli, HI 2016 26.1
Dubuque, IA 2017 7
Warrior Biogas Reuse Project, KS 2018 5.5
Newark, OH 2011 8
San Antonio Water Systems, TX 2010 94.7
South Treatment Plant, WA 1987 70
Janesville, WI 2012 13
Livestock Farms
According to the EPA AgSTAR project database, as of March 2020 there are 255 operational digester
projects that accept livestock manure. The majority (79 percent) of the manure-based digester projects
41
U.S. DOE. July 2016. 2016 Billion-Ton Report: Advancing Domestic Resources for a Thriving Bioeconomy.
https://www.energy.gov/sites/prod/files/2016/12/f34/2016_billion_ton_report_12.2.16_0.pdf.
42
Working spreadsheet for 2017 U.S. GHG Inventory for Wastewater Treatment.
43
Mintz, M., P. Vos, M. Tomich, and A. Blumenthal. October 2019. Database of Renewable Natural Gas (RNG) Projects:
2019 Update. Argonne National Laboratory. https://www.anl.gov/es/reference/renewable-natural-gas-database.
44
Gilbert, D. November 2019. “Biogas” Project Up and Running at Wastewater Plant.
https://littletonindependent.net/stories/biogas-project-up-and-running-at-wastewater-plant,288922.
15are at dairy farms, and 14 percent are at swine farms. The remainder process a mix of animal manure
effluents, including those from poultry and beef cattle. 45
The earliest U.S. manure-based digester project to create RNG began in 2004 at Whitesides Dairy in Idaho.
The Whitesides project was the first biogas production facility at a large commercial dairy in the state and
provided approximately 10 million cubic feet of RNG annually to Intermountain Gas until 2009, when the
project ended. 46
The majority (84 percent) of manure-based digester projects are generating electricity, and many of them
are also recovering waste heat in combined heat and power 47 (or cogeneration) projects. More than 20
manure-based digester projects are currently producing RNG from their biogas with a variety of RNG end
uses including electricity, vehicle fuel and pipeline gas. 48
Organic Waste Management Operations
EPA’s 2018 AD survey results show that of the 43 stand-alone facilities that reported on their biogas end
use, five produce CNG for either company vehicles or for sale to other customers, while none provide RNG
for pipeline injection. 49
6.0 CONSIDERATIONS FOR PROJECT FEASIBILITY AND POTENTIAL FOR
GROWTH
In addition to the sites discussed in Section 5.0 that are recovering biogas as a renewable energy resource,
there are many other biogas-producing sites in the United States that could potentially capture their
biogas for energy. Based on market conditions and incentives, several of the sites already recovering
biogas for electricity generation or other applications could switch to producing RNG instead; several LFG
energy projects have already made this change. In addition, more organic waste in this country could be
digested for energy recovery instead of being landfilled. A subset of the sources in these categories could
produce RNG.
Considerations for the feasibility of an RNG project include:
• The quantity and quality of biogas available for conversion (e.g., LFG and WRRF biogas tend to
require more constituent removal than manure-based or organic waste AD projects);
• Economic considerations (e.g., financing options, available incentives);
• End user availability for the RNG (e.g., proximity to a fossil natural gas pipeline without physical
connection barriers, a local distribution company’s interest in taking RNG, a local vehicle fuel
demand, a natural gas-consuming business with sustainability goals); and
• A reliable power source for the compression and cleanup processes.
45
U.S. EPA. March 2020. Livestock Anaerobic Digester Database. https://www.epa.gov/agstar/livestock-anaerobic-
digester-database.
46
U.S. EPA. March 2020. Livestock Anaerobic Digester Database. https://www.epa.gov/agstar/livestock-anaerobic-
digester-database.
47
Combined heat and power or cogeneration projects recover and beneficially use the waste heat from the
combustion unit that is generating electricity, thus providing a greater overall efficiency.
48
U.S. EPA. March 2020. Livestock Anaerobic Digester Database. https://www.epa.gov/agstar/livestock-anaerobic-
digester-database.
49
U.S. EPA. September 2019. Anaerobic Digestion Facilities Processing Food Waste in the United States (2016).
EPA/903/S-19/001. https://www.epa.gov/anaerobic-digestion/anaerobic-digestion-facilities-processing-food-waste-
united-states-survey.
16Higher flows of biogas (e.g., greater than 1,000 cfm for LFG-sourced projects) are needed for pipeline
injection projects to be financially feasible, but local-use RNG-to-vehicle fuel projects are feasible at lower
flows (e.g., as low as 50 cfm for LFG-sourced projects). Gas conditioning technology improvements have
allowed smaller biogas volumes to be economically treated when used directly in onsite vehicle fueling
stations or aggregated with output from other sites to make use of one fossil natural gas pipeline
interconnect.
Prior to implementing any type of biogas energy project, an end user (or buyer of environmental
attributes) must be identified and appropriate agreements must be in place. For RNG projects, if onsite
vehicle fueling, direct pipeline injection or virtual pipeline transport is not feasible, an otherwise attractive
project may not be viable.
MSW Landfills
There is a significant opportunity for growth in RNG from LFG. LMOP defines a “candidate” landfill as a
landfill that is currently accepting waste or has been closed five years or less, has at least one million tons
of waste, and does not have an operational, under-construction or planned LFG energy project. A landfill
can also be designated as a candidate landfill based on actual interest for a project at the site. As of March
2020, there were approximately 480 candidate landfills with the potential to collect a combined 500
mmscfd of LFG. Out of these 480 landfills, approximately 375 have between 100 and 1,000 cfm of LFG
available, and approximately 90 have greater than 1,000 cfm of LFG. There are also landfills with
operational energy projects that are flaring excess LFGapproximately 85 of these landfills have 100 to
1,000 cfm of excess gas, and approximately 30 have more than 1,000 cfm of excess gas. 50
Municipal WRRFs
A 2014 National Renewable Energy Laboratory report analyzed flow rate data from approximately 18,000
WRRFs to estimate their CH4 potential. After subtracting out the biogas used for combined heat and power
projects at WRRFs, the National Renewable Energy Laboratory estimated 1.9 million metric tons of CH4
available for recovery from these facilities. 51
The Water Environment Federation (WEF) maintains a “phase 1” database that lists information for
approximately 1,250 WRRFs that have AD on site or send sludge to another facility to be treated by AD. 52
The economic viability of a WRRF biogas project primarily depends on the amount of organic feedstock
(e.g., wastewater sludge, commercial or industrial waste) that is available for AD. Typically, a larger WRRF
(in terms of influent flow) has a greater opportunity for biogas capture and use. In March 2015, Argonne
National Laboratory analyzed data in the WEF database, which included a summary of the counts of biogas
utilization projects for varying WRRF capacities, as shown in Table 5.
50
U.S. EPA. March 2020. Landfill and Landfill Gas Energy Project Database. https://www.epa.gov/lmop/landfill-gas-
energy-project-data.
51
Saur, G., and A. Milbrandt. July 2014. Renewable Hydrogen Potential from Biogas in the United States. NREL/TP-
5400-60283. https://www.nrel.gov/docs/fy14osti/60283.pdf.
52
WEF. 2015. Biogas Data. http://www.resourcerecoverydata.org/biogasdata.php. Accessed March 27, 2019.
17Table 5. Number of Biogas Utilization Projects for Varying WRRF Capacities 53
WRRF Average Number of WRRFs Number Using Biogas /
Flow Rate in MGD with AD Number Not Using BiogasDOE, nearly 1.5 billion cubic feet of digester gas from farms that could be recovered for energy are flared
each year. 56
AgSTAR estimates that more than 8,000 large swine or dairy farms could create RNG from manure-based
digesters, including nearly 800 dairies in California alone (the largest dairy-producing state). 57 As of March
2020, there were approximately 10 dairy digester projects under construction in California and another
31 under development. 58 If all 8,000 of the candidate farms produced and captured biogas to produce
RNG, AgSTAR estimates they could create the equivalent of 1.3 billion diesel gallons, enough to fuel nearly
150,000 refuse trucks. 59
Organic Waste Management Operations
EPA reports that about 94 percent of the food that is thrown away in this country is either landfilled or
combusted for energy. Of the 40.7 million tons of food waste generated in 2017, 30.6 million tons were
landfilled and 7.5 million tons were combusted with energy recovery. The remaining approximately 2.6
million tons were composted. 60 In 2015, EPA and the U.S. Department of Agriculture created the U.S. 2030
Food Loss and Waste Reduction Goal, which includes a goal to reduce food waste going to landfills or
combustion with energy recovery by 50 percent over a 2010 baseline. 61
AD facilities can process food waste that would otherwise be landfilled or combusted. In 2015, it was
estimated that the number of stand-alone AD facilities could double in the next five to ten years, while
processing capacity could quadruple in the next five years.62 It is also estimated that AD of 100 tons of
organic waste per day can generate enough biogas to create between 900 and 1,400 gasoline gallon
equivalents (GGE) of CNG per day, depending on the type of organic waste, AD technology used and CH4
capture efficiency of the RNG technology used. 63,64,65
56
U.S. DOE. July 2016. 2016 Billion-Ton Report: Advancing Domestic Resources for a Thriving Bioeconomy.
https://www.energy.gov/sites/prod/files/2016/12/f34/2016_billion_ton_report_12.2.16_0.pdf.
57
U.S. EPA. June 2018. Market Opportunities for Biogas Recovery Systems at U.S. Livestock Facilities.
https://www.epa.gov/sites/production/files/2018-06/documents/epa430r18006agstarmarketreport2018.pdf.
58
U.S. EPA. March 2020. Livestock Anaerobic Digester Database. https://www.epa.gov/agstar/livestock-anaerobic-
digester-database.
59
U.S. EPA. June 2018. Market Opportunities for Biogas Recovery Systems at U.S. Livestock Facilities.
https://www.epa.gov/sites/production/files/2018-06/documents/epa430r18006agstarmarketreport2018.pdf.
60
U.S. EPA. November 2019. Advancing Sustainable Materials Management: 2017 Fact Sheet. EPA/530/F-19/007.
https://www.epa.gov/facts-and-figures-about-materials-waste-and-recycling/advancing-sustainable-materials-
management.
61
U.S. EPA. United States 2030 Food Loss and Waste Reduction Goal. https://www.epa.gov/sustainable-management-
food/united-states-2030-food-loss-and-waste-reduction-goal. Accessed March 5, 2020.
62
EREF. August 2015. Anaerobic Digestion of Municipal Solid Waste: Report on the State of Practice.
63
U.S. EPA. March 2008. Anaerobic Digestion of Food Waste. Final Report. Table ES-1.
https://nerc.org/documents/anaerobic_digestion_report_march_2008.pdf.
64
U.S. EPA. May 2017. LFGcost-Web. Version 3.2. https://www.epa.gov/lmop/lfgcost-web-landfill-gas-energy-cost-
model.
65
U.S. EPA. May 2019. Documentation for Greenhouse Gas Emission and Energy Factors Used in the Waste Reduction
Model (WARM). Organic Materials Chapters. https://www.epa.gov/sites/production/files/2019-
06/documents/warm_v15_organics.pdf.
19You can also read