Ammonium nitrate promotes sulfate formation through uptake kinetic regime
←
→
Page content transcription
If your browser does not render page correctly, please read the page content below
Atmos. Chem. Phys., 21, 13269–13286, 2021
https://doi.org/10.5194/acp-21-13269-2021
© Author(s) 2021. This work is distributed under
the Creative Commons Attribution 4.0 License.

Ammonium nitrate promotes sulfate formation
through uptake kinetic regime
Yongchun Liu1,5 , Zemin Feng1 , Feixue Zheng1 , Xiaolei Bao2,7 , Pengfei Liu3 , Yanli Ge3 , Yan Zhao3 , Tao Jiang4 ,
Yunwen Liao5 , Yusheng Zhang1 , Xiaolong Fan1 , Chao Yan6 , Biwu Chu3,6 , Yonghong Wang6 , Wei Du6 , Jing Cai6 ,
Federico Bianchi6 , Tuukka Petäjä6,8 , Yujing Mu3 , Hong He3 , and Markku Kulmala1,6
1 Aerosol   and Haze Laboratory, Advanced Innovation Center for Soft Matter Science and Engineering,
Beijing University of Chemical Technology, Beijing, 100029, China
2 Hebei Provincial Academy of Environmental Sciences, Shijiazhuang, 050037, China
3 State Key Joint Laboratory of Environment Simulation and Pollution Control, Research Center for Eco-Environmental

Sciences, Chinese Academy of Sciences, Beijing, 100085, China
4 Hebei Provincial Meteorological Technical Equipment Center, Shijiazhuang, 050021, China
5 College of Chemistry and Chemical Engineering, China West Normal University, Nanchong, 637002, China
6 Institute for Atmospheric and Earth System Research/Physics, Faculty of Science, University of Helsinki,

P.O. Box 64, 00014, Finland
7 Hebei Chemical & Pharmaceutical College, Shijiazhuang, 050026, China
8 Joint International Research Laboratory of Atmospheric and Earth System Sciences (JirLATEST),

University of Helsinki and Nanjing University, Nanjing 210023, China

Correspondence: Yongchun Liu (liuyc@buct.edu.cn) and Xiaolei Bao (bxl5@163.com)

Received: 5 April 2021 – Discussion started: 7 May 2021
Revised: 30 July 2021 – Accepted: 2 August 2021 – Published: 7 September 2021

Abstract. Although the anthropogenic emissions of SO2            significantly promoted the uptake of SO2 and subsequently
have decreased significantly in China, the decrease in SO2−4     the SOR, while NO2 had little influence on SO2 uptake and
in PM2.5 is much smaller than that of SO2 . This implies         SOR in the presence of NH3 .
an enhanced formation rate of SO2−    4 in the ambient air,
and the mechanism is still under debate. This work investi-
gated the formation mechanism of particulate sulfate based
on statistical analysis of long-term observations in Shiji-      1   Introduction
azhuang and Beijing supported with flow tube experiments.
Our main finding was that the sulfur oxidation ratio (SOR)       Atmospheric particulate matter (PM) is a worldwide concern
was exponentially correlated with ambient RH in Shiji-           due to its adverse effect on human health, such as its as-
azhuang (SOR = 0.15+0.0032×exp(RH/16.2)) and Beijing             sociation with respiratory and cardiovascular diseases, lung
(SOR = −0.045 + 0.12 × exp(RH/37.8)). In Shijiazhuang,           cancer, and premature death (WHO, 2013; Lelieveld et al.,
the SOR is linearly correlated with the ratio of aerosol water   2015). The Chinese government has made great efforts to
content (AWC) in PM2.5 (SOR = 0.15+0.40×AWC/PM2.5 ).             improve the air quality (Cheng et al., 2019). For example,
Our results suggest that uptake of SO2 instead of oxidation      the annual PM2.5 concentration in Beijing decreased from
of S(IV) in the particle phase is the rate-determining step      89.5 µg m−3 in 2013 to 58 µg m−3 in 2017 due to the strin-
for sulfate formation. NH4 NO3 plays an important role in        gent reduction of local and regional emissions (Cheng et al.,
the AWC and the change of particle state, which is a cru-        2019; Ji et al., 2019). However, the PM2.5 concentrations in
cial factor determining the uptake kinetics of SO2 and the       most regions of China (Cheng et al., 2019; Q. Chen et al.,
enhanced SOR during haze days. Our results show that NH3         2019; Huang et al., 2019; Tian et al., 2019) are still sig-
                                                                 nificantly higher than the PM2.5 standard recommended by

Published by Copernicus Publications on behalf of the European Geosciences Union.
13270                                                             Y. Liu et al.: Ammonium nitrate promotes sulfate formation

the World Health Organization (WHO) (WHO, 2006). Haze                topic measurements (He et al., 2018), while it was 31 % even
events also occur with high frequency, especially, in autumn         in the nighttime calculated by an observation-based model-
and winter.                                                          ing (OBM) (Xue et al., 2016). Gas-phase oxidation by OH
   Secondary inorganic aerosol (SIA) including sulfate               could explain 33 %–36 % of SO2−     4 production in the Beijing–
(SO2−                 −                    +
     4 ), nitrate (NO3 ), ammonium (NH4 ) and secondary or-          Tianjin–Hebei region (L. Liu et al., 2019), while it was neg-
ganic aerosol (SOA) usually contribute to ∼ 70 % of PM2.5            ligible based on isotopic measurements (He et al., 2018) and
mass concentration in different regions (Huang et al., 2014;         OBM simulations (Xue et al., 2016). As for the oxidation
                                                                                                                                 2−
An et al., 2019). SIA often accounts for more than a half of         of S(IV) species, which includes SO2 , HSO−       3 and SO3 , in
PM2.5 mass in severe pollution events (Zheng et al., 2015;           aqueous phase, oxidation by H2 O2 (T. Liu et al., 2020; P. Liu
Wang et al., 2016). Even SO2−   4 exceeds more than 20 % of          et al., 2020; Ye et al., 2021), NO2 (J. F. Wang et al., 2020;
PM2.5 mass (Guo et al., 2014; Wang et al., 2016; Xie et al.,         Wang et al., 2016; Cheng et al., 2016), O3 (Fang et al., 2019),
2015; He et al., 2018). Interestingly, the anthropogenic emis-       or TMI (Mn2+ ) (Wang et al., 2021) was proposed as the most
sions of SO2 in 2017 reduced by ∼ 90 % when compared                 important pathway by different researchers. However, the
with 2000 in Beijing (Cheng et al., 2019; Lang et al., 2017).        relative importance of these oxidation paths varied greatly
However, the decrease rate of particulate SO2−    4 concentra-       among different researches. For instance, TMI-catalyzed ox-
tion (Lang et al., 2017; C. Li et al., 2017) is much smaller         idation could explain ∼ 69 % of aqueous sulfate formation in
than SO2 (Lang et al., 2017; Zhang et al., 2020; Liu et al.,         North China Plain based on isotopic measurements and mod-
2021). For example, the annual mean concentration of SO2−    4       eling (Shao et al., 2019), while oxidation by NO2 or O2 was
decreased by 0.1 µg m−3 yr−1 from 2000 to 2013, followed             the dominant oxidation path (66 %–73 %) based on isotopic
by 1.9 µg m−3 yr−1 from 2013 to 2015 in Beijing, while it de-        measurements in another study (He et al., 2018). It should
creased by 3.8 µg m−3 yr−1 for SO2 (Lang et al., 2017). This         be noted that some reaction mechanisms mentioned above
implies an enhanced oxidation rate of SO2 in the atmosphere          were proposed based on case studies in short-term observa-
(Lang et al., 2017). However, the mechanisms and kinetics            tions. Thus, long-term observations at different environments
of particulate SO2−4 formation in the real atmosphere are still      are required to verify whether these mechanisms are statisti-
open questions in many regions of China although they have           cally important. In addition, the previous studies mainly fo-
been extensively discussed (Ervens, 2015; Warneck, 2018).            cused on oxidation process of SO2 in particle phase, while
   Particulate SO2− 4 can be formed through homogeneous              it is unclear what are the controlling factors of the S(IV)-to-
oxidation of SO2 by hydroxyl radicals (OH) and stabilized            S(VI) conversion from the gas phase to the particle phase. In
Criegee intermediates (SCIs) in the gas phase and subse-             particular, it has been found that the mass fraction of NO−     3
quent uptake onto particles, while the OH pathway is the             and NH+   4 is increasing gradually (Lang et al., 2017; Li et
dominant gas-phase oxidation pathway (Seinfeld and Pan-              al., 2018). This will modify its physical properties, such as
dis, 2006; L. Liu et al., 2019). Modeling studies greatly un-        morphology, phase-state and so on. The feedback between
derestimated (∼ 54 %) SO2−  4 concentration in serve pollution       aerosol physics and aerosol chemistry is still poorly under-
events in Beijing if only considering gas-phase oxidation of         stood.
SO2 , while the normalized mean bias (NMB) decreased sig-                In this work, 1-year field observations have been per-
nificantly after heterogeneous oxidation of SO2 being con-           formed in Shijiazhuang and Beijing, synchronously. The for-
sidered (Zheng et al., 2015). Several heterogeneous and/or           mation mechanism of particulate sulfate has been statistically
multiphase oxidation pathways, such as oxidation of SO2              investigated to identify the controlling factors. The role of
or sulfite by H2 O2 (Huang et al., 2015; Maaß et al., 1999;          mass transfer of SO2 and the oxidation of S(IV) in particle
P. Liu et al., 2020; Ye et al., 2021; Liu et al., 2021), HONO        phase have been discussed based on flow tube experiments
(J. F. Wang et al., 2020), and O3 (Maahs, 1983) or photo-            and field measurements. The conversion ratio of SO2 to sul-
chemical oxidation of SO2 (Yu et al., 2017; Xie et al., 2015),       fate is statistically and linearly correlated to the aerosol water
catalytic oxidation of SO2 by transition metal ions (TMI)            content (AWC), which is strongly modulated by particulate
(Warneck, 2018; Martin and Good, 1991; Wang et al., 2021)            ammonium nitrate. The reaction kinetics and other factors
and oxidation of SO2 by NO2 (He et al., 2014; Clifton et             affecting sulfate production have also been discussed.
al., 1988; Wang et al., 2016; Cheng et al., 2016; Wu et al.,
2019; Spindler et al., 2003) in aqueous phase and heteroge-
neous oxidation of SO2 on black carbon (Zhao et al., 2017;           2     Material and methods
Zhang et al., 2020; Yao et al., 2020), have been proposed
based on field measurements and laboratory and modeling              2.1    Field measurements
studies. However, the relative contribution of these pathways
to the SO2−
          4 production is still controversial. For example, the      Field measurements were performed at Shijiazhuang Uni-
contribution of heterogeneous oxidation to SO2−                      versity (SJZ; 38.0281◦ N, 114.6070◦ E) and the west
                                                  4 production
had been evaluated to be (48 ± 5) % based on oxygen iso-             campus of Beijing University of Chemical Technology
                                                                     (BUCT; 39.9428◦ N, 119.2966◦ E) from 15 March 2018 to

Atmos. Chem. Phys., 21, 13269–13286, 2021                                             https://doi.org/10.5194/acp-21-13269-2021
Y. Liu et al.: Ammonium nitrate promotes sulfate formation                                                                   13271

15 April 2019. The SJZ station is on a rooftop of the main        2.2   Uptake kinetics of SO2 on dust internally mixed
teaching building (5 floors, ∼ 23 m above the surface), which           with NH4 NO3
is around 250 m from the Zhujiang Road of Shijiazhuang.
The BUCT station is on a rooftop of the main building (5          To understand the influence of RH on uptake kinetics (γSO2 ),
floors, ∼ 18 m above the surface), which is around 550 m          the γSO2 on dust internally mixed with NH4 NO3 was mea-
from the 3rd Ring Road of Beijing. The distance between the       sured using a coated-wall flow tube reactor. The configu-
two stations, which are the representative cities of Beijing-     ration of the reactor and data process protocol have been
Tianjin-Hebei (BTH), is 260 km (Fig. S1). Both stations are       described in detail previously (Han et al., 2013; Liu et al.,
surrounded by traffic and residential emissions, thus, are typ-   2015). The γ parameter, presenting the mass transfer kinetic
ical urban observation sites. The details about the observation   of gas-phase SO2 to particle phase, is defined by the net
stations have been described in our previous work (Y. Liu et      loss rate of SO2 per collision onto the surface (Ravishankara,
al., 2020c, b, a).                                                1997; Usher et al., 2003), namely,
   Ambient air was drawn from the roof of the correspond-
ing building. At the SJZ station, the mass concentration of                − dc
                                                                             dt   2kobs rtube
                                                                  γobs =        =             ,                                 (1)
PM2.5 was measured by a beta attenuation mass monitor                       ω
(BAM-1020, Met One Instruments, USA) with a smart heater
                                                                  where −dc/dt is the net loss rate of SO2 when the surface is
(model BX-830, Met One Instruments Inc., USA) to con-
                                                                  exposed to SO2 (molecules s−1 ); ω is the collision frequency
trol the RH of the incoming air to 35 % and a PM2.5 in-
                                                                  (s−1 ); kobs , rtube , and < c > are the first-order rate constant
let (URG) to cut off the particles with diameter larger than
                                                                  of SO2 , the flow tube radius, and the average molecular ve-
2.5 µm. Particle-phase total concentrations of iron and man-
                                                                  locity of SO2 , respectively. A correction for gas-phase dif-
ganese were measured using a heavy-metal analyzer (EHM-
                                                                  fusion limitations was considered for γobs calculations using
X100, Skyray Instrument). Water-soluble ions (Na+ , K+ ,
                         2−                                       the Cooney–Kim–Davis (CKD) method (Cooney et al., 1974;
Mg2+ , Ca2+ , NH+               −          −
                   4 , SO4 , Cl and NO3 ) in PM2.5 and gas        Murphy and Fahey, 1987). The Brunauer–Emmett–Teller
pollutants (HCl, HONO, HNO3 , SO2 and NH3 ) were mea-
                                                                  (BET) uptake coefficient (γSO2 ,BET ) was obtained from the
sured using an analyzer for monitoring aerosols and gases
                                                                  mass dependence of γobs as follows (Han et al., 2013; Liu et
(MARGA, ADI 2080, Applikon Analytical B.V., the Nether-
                                                                  al., 2015):
lands) with 1 h of time resolution. At the BUCT station,
the mass concentration of PM2.5 was the mean concentra-                            Ag
tion obtained from four surrounding monitoring stations (in-      γSO2 ,BET = slope      ,                                      (2)
                                                                                    SBET
cluding Wanliu, Gucheng, Wanshouxigong and Guanyuan)
of China Environmental Monitoring Centre (http://www.             where [slope] is the slope of the plot of γobs versus the sample
cnemc.cn, last access: 31 December 2020). The chemical            mass in the linear regime (mg−1 ), Ag is the inner surface area
composition of PM2.5 was measured using a time-of-flight          of the sample tube (cm2 ) and SBET is the specific surface area
aerosol chemical speciation monitor (ToF-ACSM, Aero-              of the particle sample (cm2 mg−1 ).
dyne) after the ambient air went through a PM2.5 inlet (URG)         Similar to a previous work (Zhang et al., 2019), dust in-
and a Nafion dryer (MD-700-24, Perma Pure). The configu-          ternally mixed with NH4 NO3 was used in the kinetics study,
ration and the operation protocol of ToF-ACSM have been           because it was difficult to deposit enough real ambient par-
described in previous work (Fröhlich et al., 2013). The ion-      ticles onto the inner surface of the sample holder. Although
ization efficiency (IE) calibration for ACSM was performed        the composition of the model particles is much simpler than
using 300 nm dry NH4 NO3 every month. Ambient air was             that of ambient particles, it is still meaningful, because we
drawn from the roof using a Teflon sampling tube (BMET-S,         mainly focused on the influence of RH or aerosol water con-
Beijing Saak-Mar Environmental Instrument Ltd.) with the          tent (AWC) on uptake kinetics of SO2 . The mixture (mass
residence time
13272                                                             Y. Liu et al.: Ammonium nitrate promotes sulfate formation

sample holder was covered with particles. The wall loss of           was calculated with the mass of the salt and the mass-based
SO2 on the remained surface (the inner surface of the outside        growth factor at the corresponding RH. The AWC of model
tube and the outside surface of the sample holder) was sub-          particles for laboratory studies was also calculated with the
tracted at a steady-state condition at the corresponding RH          known composition, while the aerosol pH values in Bei-
before the uptake experiment as done in our previous work            jing were not calculated, because the concentrations of Na+ ,
(Liu et al., 2015). The mean concentrations of SO2 , NO2 and         Ca2+ , K+ and Mg2+ were unavailable.
NH3 were 8.3 ± 5.2 (0.4–49.1), 31.5 ± 13.2 (2.5–85.1) and               Similar to previous studies (P. Liu et al., 2020; Cheng
41.0 ± 18.4 (0.3–126.4) ppb, respectively, in polluted events        et al., 2016), four oxidation pathways of S(IV) in aqueous-
(with the PM2.5 concentration higher than 75 µg m−3 and the          phase were accounted for, i.e., oxidation by O3 , H2 O2 , NO2
RH less than 90 %) in Shijiazhuang. The initial concentra-           and TMI (Fe3+ and Mn2+ ), according to the following equa-
tions of SO2 , NO2 and NH3 in the reactor were 190 ± 2.5,            tions (Seinfeld and Pandis, 2006; Cheng et al., 2016; P. Liu
100 ± 2.5 and 50 ± 2.5 ppb, respectively. The initial concen-        et al., 2020):
trations of NO2 and NH3 were close to their ambient con-
centrations, while a high initial SO2 concentration was used              d [S (IV)]
                                                                                          = k0 SO2,aq + k1 HSO−

                                                                     −                                                  3
here to obtain a good signal to noise ratio for γSO2 measure-                 dt       O3
ments. In this work, we aimed to understand the influence                                      h       i
                                                                                           +k2 SO2−

of AWC on the uptake kinetics of SO2 . Therefore, we fixed                                           3     O3,aq ,                     (4)
the initial concentrations of pollutants and the temperature at                                 k3 H+ HSO−

                                                                          d [S (IV)]                           3     H2 O2 , aq
300 K. SO2 and NO2 were measured using the correspond-               −                       =
                                                                                                                   +
                                                                                                                                  ,    (5)
                                                                              dt       H2 O2             1+K H
ing analyzer (Thermo 43i and 42i), and NH3 was measured
by an ammonia analyzer (EAA-22, LGR, USA). The spe-                       d [S (IV)]              α h 2+ i h 3+ i
                                                                     −                      = k 4 H+      Mn        Fe      [S (IV)] ,
cific surface area of the mixture of A1 dust and NH4 NO3                      dt       TMI
was 0.813 m2 g−1 , measured by a nitrogen BET physisorp-                                                                               (6)
tion analyzer (Quantachrome Autosorb-1-C). RH from 0 to
                                                                          d [S (IV)]


80 % was adjusted by varying the ratio of dry to wet zero            −                      = k5 NO2 , aq [S (IV)] ,                   (7)
                                                                              dt       NO2
air (water bubbler) and measured by a RH sensor (HMP110,
Humicap). Control experiments demonstrate that adsorption            where k0 = 2.4×10⁴ M−1 s−1 , k1 = 3.7×10⁵ M−1 s−1 , k2 =
of SO2 on the quartz tube is negligible. It should be noted          1.5 × 10⁹ M−1 s−1 , k3 = 7.45 × 10⁷ M−1 s−1 , K = 13 M−1 ,
that the wall loss of SO2 in the presence of NH3 and/or NO2          k4 = 3.72 × 10⁷ M−1 s−1 , and α = −0.74 (for pH ≤ 4.2)
would be larger in the absence of seed aerosols. Additional          or k4 = 2.51 × 10¹³ M−1 s−1 , α = 0.67 (for pH > 4.2), and
control experiments in the presence of NO2 and NH3 demon-            k5 = (1.24–1.67) ×107 M−1 s−1 (for 5.3 ≤ pH ≤ 8.7; the lin-
strate that the contribution of wall loss of SO2 should be less      ear interpolated values were used for pH between 5.3 and
than 3 % to the measured γ .                                         8.7) at 298 K (Clifton et al., 1988; P. Liu et al., 2020; Tilgner
                                                                     et al., 2021; Liu et al., 2021). [O3 , aq], [H2 O2 , aq] and [NO2 ,
2.3   Calculations of AWC, aerosol pH and production
                                                                     aq] were calculated according to the Henry’s constants,
      rates of sulfate in aerosol liquid water
                                                                     which are 1.1 × 10⁻² , 1.0 × 10⁵ and 1.2 × 10⁻² M atm−1 at
The AWC and aerosol pH in Shijiazhuang were calculated               298 K for O3 , H2 O2 and NO2 , respectively (Seinfeld and
using the ISORROPIA II model using the measured concen-              Pandis, 2006). H2 O2 concentrations were unavailable during
trations of SO2−      +            −            −          +         our observations. It was fitted based on temperature like in
              4 , NH4 , NH3 , NO3 , HNO3 , Cl , HCl, Na ,
    2+   +         2+
Ca , K and Mg , as well as RH and temperature as in-                 previous work (Fang et al., 2019). Figure S2 shows the de-
put. The particles were assumed in metastable phase using            rived H2 O2 concentrations and the diurnal curves of H2 O2
a forward method (Song and Osada, 2020; Shi et al., 2019).           in winter in Shijiazhuang. The H2 O2 concentrations varied
The dataset with RH lower than 35 % was excluded (Pye et             from 0.05 to 3.7 ppbv, with a mean value of 0.62 ± 0.52 ppbv.
al., 2020) due to large uncertainties of aerosol pH (Ding et         Overall, the wintertime H2 O2 concentrations derived in this
al., 2019; Guo et al., 2016; Pye et al., 2020). The pH was           work are comparable with those reported in the literature (Ye
then calculated according to Pye et al. (2020) and Ding et al.       et al., 2018). The concentrations of Fe3+ and Mn2+ were cal-
(2019):                                                              culated according to the measured total Fe and Mn concen-
                                                                     trations assuming 18 % of total Fe and 30 % of total Mn were
                                   1000γH+ cH+                       soluble (Wang et al., 2014; Cui et al., 2008) and the precipi-
pH = −log10 (γH+ mH+ ) = −log10                ,           (3)
                                      AWC                            tation equilibriums of Fe(OH)3 and Mn(OH)2 depending on
                                                                     pH. The concentrations of Fe and Mn before December 2018
where γH+ is the activity coefficient of H+ , and mH+ is the         were estimated according to their mean ratios to PM2.5 mass
molality of H+ . The deliquescence curves of inorganic salts         concentration (Wang et al., 2014), because the instrument
were calculated at 298.5 K using the E-AIM model (Clegg              was unavailable.
et al., 1998). Then, the AWC attributed to individual salt

Atmos. Chem. Phys., 21, 13269–13286, 2021                                             https://doi.org/10.5194/acp-21-13269-2021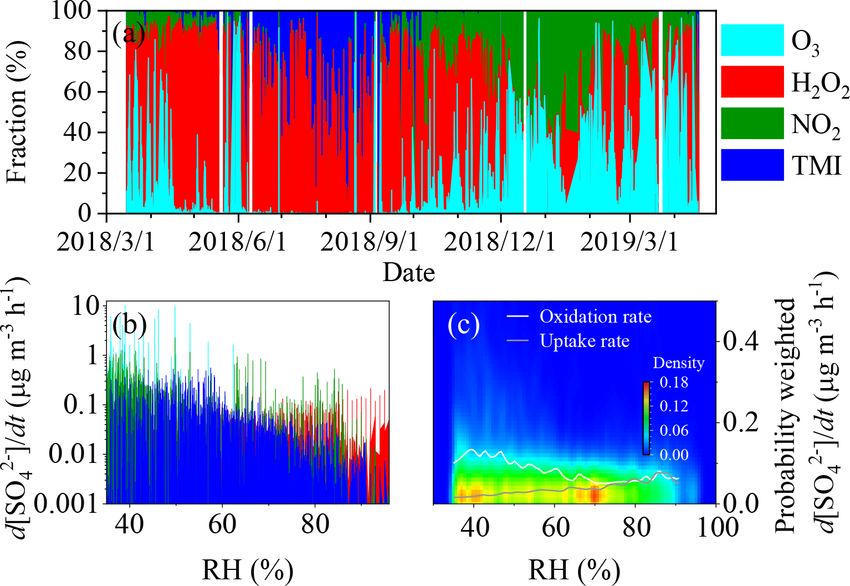
Y. Liu et al.: Ammonium nitrate promotes sulfate formation                                                                  13273

3     Results and discussion                                      higher than that in Shijiazhuang. Thus, the annual mean SOR
                                                                  in Beijing (0.42 ± 0.29) was comparable with that reported in
3.1    Variation of sulfate in PM2.5                              literature (Fang et al., 2019), while it was significantly higher
                                                                  than that in Shijiazhuang (0.31 ± 0.19) at the 0.05 level. The
Figure 1a shows the hourly mean mass concentration                high primary emissions of SO2 in Shijiazhuang should lead
of PM2.5 measured at SJZ and BUCT stations from                   to a lower SOR than that in Beijing. On the other hand, sec-
15 March 2018 to 15 April 2019. The mass concentration            ondary transformation of SO2 to sulfate should also have an
of PM2.5 in Shijiazhuang generally coincided with that in         influence on the SOR. The Ox (Ox = NO2 +O3 ) concentra-
Beijing. This highlights the regional characteristic of air       tion in Shijiazhuang was usually higher than that in Beijing
pollution in BJH. However, Shijiazhuang usually showed            (Fig. 1f). The annual mean Ox concentration in Shijiazhuang
significantly higher PM2.5 concentration than that in Bei-        was 55.2 ± 22.3 ppb, which was significantly higher than that
jing. The hourly mean PM2.5 concentration varied in the           in Beijing (50.7 ± 21.5 ppb) at the 0.05 level. This is incon-
range of 0–650 µg m−3 with an annual mean concentration           sistent with the observed higher SOR in Beijing if gas-phase
of 86.4 ± 77.8 µg m−3 . The corresponding values in Beijing       oxidation mainly contributed to sulfate formation. These re-
were 1.5–556 and 55.0 ± 51.0 µg m−3 . Particularly, the win-      sults suggest that heterogeneous and/or multiphase reactions
tertime mass concentration of PM2.5 in Shijiazhuang was           may also play important roles in particulate sulfate formation
around 2.4 times as that in Beijing. This is consistent with      during transport (Zheng et al., 2015; Martin and Good, 1991;
previous results that Shijiazhuang is suffering from more se-     Wu et al., 2019).
rious air pollution (D. Chen et al., 2019b) because of its           Figure 2a–c show the mass concentration of PM2.5 colored
larger density of heavy industries and more intensive emis-       according to the mass concentration of sulfate, the fraction
sions than in Beijing (D. Chen et al., 2019a).                    of sulfate in the soluble PM and the SOR in Shijiazhuang. In
   Like the mass concentration of PM2.5 , both the mass con-      most serve pollution events, high PM2.5 mass concentration
centration (Fig. 1b) and the fraction of sulfate in PM2.5         coincided with the high sulfate concentration, the fraction of
(Fig. 1c) in Shijiazhuang were usually higher than those in       sulfate and the SOR (colored in grey color). For example,
Beijing. The annual mean sulfate concentrations in Shiji-         the mean PM2.5 concentration was 411.7 ± 98.1 µg m−3 dur-
azhuang and Beijing were 11.7 ± 12.7 and 5.4 ± 6.9 µg m−3 ,       ing the pollution event that occurred from 08:00 on 12 Jan-
which annually contributed 15.3 ± 8.7 % and 10.7 ± 7.3 % to       uary 2019 to 00:00 on 15 January 2019 (All times in this pa-
the PM2.5 mass concentrations, respectively. However, the         per are given in local time unless stated otherwise.). The cor-
                             2−
molar ratio of NO−  3 to SO4 (3.37 ± 3.05), corresponding         responding sulfate concentration, fraction of sulfate in solu-
to the mass ratio 2.17 ± 1.97 in Beijing was significantly        ble PM and SOR were 80.6 ± 24.0 µg m−3 , 39.4 ± 3.6 % and
higher than that in Shijiazhuang (2.69 ± 1.80, correspond-        0.79 ± 0.09, respectively. Other pollution episodes, which
ing to mass ratio of 1.77 ± 1.72) at the 0.05 level. This is      were highlighted in grey color in Fig. 2, showed a similar
consistent with the emission inventories of air pollutants, in    trend. The variations of the sulfate concentration, the fraction
which Shijiazhuang had larger SO2 emissions than Beijing,         of sulfate in nonrefractory PM2.5 and the SOR with PM2.5
and vice versa for NOx emissions (Yang et al., 2019; F. Liu       mass concentration in Beijing were similar to Shijiazhuang
et al., 2017; D. Chen et al., 2019a). A decrease of sulfate       and shown in Fig. S3. These results confirm that the conver-
concentration (5.4 ± 6.9 µg m−3 ) in Beijing was significant      sion rate of SO2 to sulfate is promoted in pollution days when
even when compared with that in PM1.0 (8.1 ± 8.3 µg m−3 )         compared with that in clean days.
measured from July 2011 to June 2012 (Sun et al., 2015),
                                   2−
while the mass ratio of NO−  3 /SO4 (2.17 ± 1.97) in Beijing      3.2   Role of aerosol water content in sulfate formation
showed an obvious increase compared with those in 2011–
2012 (1.3–1.8) (Sun et al., 2015) and 2008 (0.8–1.5) (Zhang       Previous studies have found that severe pollution events are
et al., 2013). This can be ascribed to the effective reduction    frequently accompanied with high RH (Zhang et al., 2018;
of SO2 emissions but less effective reduction of traffic emis-    Tang et al., 2016; Wu et al., 2018; Y. Liu et al., 2019; Clifton
sions in Beijing.                                                 et al., 1988; Maahs, 1983; Martin and Good, 1991). As
   The ground surface concentrations of pollutants are prone      shown in Fig. 2d, the high concentration of sulfate positively
to be affected by variation of mixing layer height (MLH)          correlated with high RH in most cases, which are shaded in
(Zhong et al., 2018; Tang et al., 2016). Sulfur oxidation ratio   grey columns. However, some pollution events (shaded in
(SOR), which is defined as the molar ratio of sulfate to total    purple columns) also occurred under high RH, but the sul-
sulfur (Wang et al., 2005; Fang et al., 2019),                    fate concentration or sulfate fraction in soluble PM was not
             nSO2−                                                so high. This means that high RH is a necessary but not a
                 4
SOR =                  ,                                    (8)   sufficient condition for sulfate conversion in severe haze pol-
         nSO2− + nSO2
             4                                                    lution events. Thus, it is difficult to fully understand the gen-
was calculated and should be less affected by the MLH vari-       eral regularity behind the dataset or overemphasize the im-
ation. As shown in Fig. 1e, the SOR in Beijing was overall        portance of a specific process in the atmosphere based on

https://doi.org/10.5194/acp-21-13269-2021                                       Atmos. Chem. Phys., 21, 13269–13286, 2021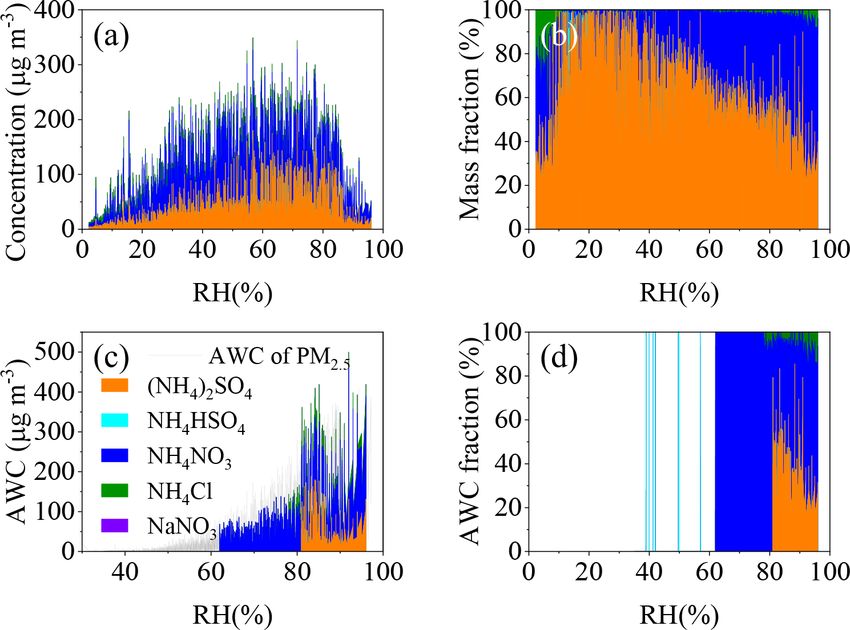
13274                                                               Y. Liu et al.: Ammonium nitrate promotes sulfate formation

Figure 1. The hourly mean (a) mass concentration of PM2.5 , (b) sulfate concentration, (c) sulfate fraction in PM2.5 , (d) molar ratio of
nitrate to sulfate, (e) sulfur oxidation ratio (SOR) and (e) Ox (= NO2 +O3 ) concentration in Shijiazhuang and Beijing from 15 March 2018
to 15 April 2019.

Figure 2. Mass concentration of PM2.5 colored according to (a) sulfate concentration, (b) sulfate fraction in soluble PM, (c) SOR, (d) RH
and (e) AWC in Shijiazhuang. The shade areas in grey indicate the pollution events with high concentration of sulfate at high RH, while the
purple ones the mean pollution events with low sulfate fraction at high RH.

case studies. This might be the reason why contrary conclu-                Figure 3a and b show the 2D kernel density graphs be-
sions about the formation path of sulfate were drawn by dif-            tween the SOR and the RH in Shijiazhuang and Beijing. The
ferent researchers. We statistically analyzed the relationship          color bar shows the density of data points. Although the SOR
between the SOR and the RH. All the hourly mean data of the             varied obviously at a certain RH, the most probable distribu-
SOR and RH have been binned into 100 × 100 boxes. Then,                 tion of SOR could be exponentially fitted as a function of
the density of data points, which statistically indicates the oc-       RH in Shijiazhuang (Fig. 3a); i.e., SOR = 0.15 + 0.0032 ×
currence of the events at given values of RH and SOR, was               exp(RH/16.2) (R = 0.79). This is consistent with the depen-
calculated using a bivariate kernel density estimator (Wand             dence of SOR on RH based on previous studies (Tian et al.,
and Jones, 1993).                                                       2019; Wu et al., 2019). It should be noted that both SOR and

Atmos. Chem. Phys., 21, 13269–13286, 2021                                                https://doi.org/10.5194/acp-21-13269-2021
Y. Liu et al.: Ammonium nitrate promotes sulfate formation 13275
RH showed obvious diurnal variation (Fig. S4). Their diurnal In a previous work (Zhang et al., 2019), it has been found
variations were somewhat similar, but a 4 h time lag was ob- that all the uptake of SO2 on dust or nitrate-coated dust can
served between their minimum values. This means that the be transformed into sulfate over the timescale of the uptake
diurnal variations of SOR and RH might also contribute to experiment using the similar coated-wall flow tube reactor.
the strong dependency of SOR on RH (Fig. 3a and b). How- Another study also observed a quick formation of sulfate on
ever, the exponential dependency of SOR on RH was still the surface of aqueous microdroplets under acidic conditions
observable in the night or in the day (Fig. S5a and b). It did (pH < 3.5) without the addition of other oxidants, which was
so in winter or summer (Fig. S5c and d). This means that explained by the direct interfacial electron transfer from SO2
aqueous reactions are important for sulfate formation even if to O2 on the aqueous microdroplets (Hung et al., 2018). The
the influence of diurnal and seasonal variations are ruled out pH of deliquesced NH4 NO3 is 4.2 as calculated using the
(Wang et al., 2016; Cheng et al., 2016). ISORROPIA II model. This means that oxidation of S(IV)
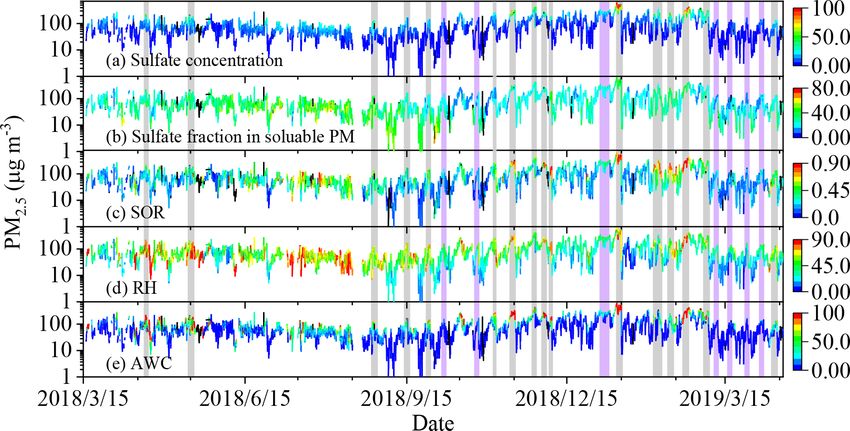
In Fig. 3a, 72.5 % of the data points of Shijiazhuang might not be a RDS of sulfate formation. The oxidation pro-
(6509 over 8980 effective points) were in the domain cesses can be ascribed to catalytic oxidation by O2 in the
with the RH range of 10 %–70 % and the SOR range presence of transition metals, oxidation by O2 and nitric acid
of 0.05–0.42, while 10.1 % of data points were in the promoted by protons in the presence of nitrate (Zhang et al.,
region with the RH greater than 70 % and the SOR 2019) and the oxidation by other dissolved oxidants in liq-
greater than 0.42. The first region corresponded to a uid phase (T. Chen et al., 2019; Cheng et al., 2016; Wang
lower mean PM2.5 concentration, sulfate concentration et al., 2016). To further validate this assumption, the forma-
and SOR (76.1 ± 62.78 µg m−3 , of 8.1 ± 6.3 µg m−3 , and tion rates of SO2− 2−
4 (d[SO4 ]/dt) in aerosol liquid phase were
0.21 ± 0.09, respectively) compared with the second one calculated according to the method used in previous work
(115.7 ± 96.7 µg m−3 , 22.4 ± 20.4 µg m−3 and 0.62 ± 0.14, (P. Liu et al., 2020; Cheng et al., 2016). If oxidation of S(IV)
respectively). As shown in Fig. 3b, the SOR also expo- is the rate-determining step, the formation rate should show
nentially increased as a function of RH in Beijing. A per- a similar dependence on RH like the SOR.
centage of 74.6 % of 8169 data points were in the first re- As shown in Fig. 4a, the relative contributions of different
gion. The mean PM2.5 concentration, sulfate concentration oxidation paths of S(IV) varied obviously case by case. In
and SOR were 48.2 ± 44.8 µg m−3 , 2.9 ± 3.0 µg m−3 and summer and autumn, oxidation by H2 O2 was the most im-
0.21 ± 0.10, respectively, in the low RH region, while they portant path followed by TMI. In winter, however, NO2 , O3
were 69.9 ± 50.9 µg m−3 , 9.4 ± 8.5 µg m−3 and 0.83 ± 0.15 or H2 O2 could contribute to the major oxidation path. This
in the high RH region. The most probable distribution of might be the reason why these oxidation paths showed incon-
SOR in Beijing could also be exponentially fitted as a func- sistent relative importance of among different studies even
tion of RH (SOR = −0.045 + 0.12 × exp(RH/37.8), R = using the same method, such as isotopic measurements (Shao
0.92). However, the SOR was more sensitive to RH in Bei- et al., 2019; He et al., 2018). Figure 4b and c show the de-
jing than that in Shijiazhuang. This might be explained by the pendence of the formation rates of sulfate on RH in the range
increased importance of sulfate formation via gas-phase re- of 35 %–100 % in Shijiazhuang. The dataset for RH below
actions in Beijing (Fang et al., 2019; Hollaway et al., 2019), 35 % was omitted due to the large uncertainty in aerosol pH
because the PM2.5 mass concentrations in Beijing were sig- calculations (Ding et al., 2019; Guo et al., 2016; Pye et al.,
nificantly lower than that in Shijiazhuang (Fig. 1). 2020). The relative contributions of different oxidation paths
Formation of particle-phase sulfate through heteroge- of S(IV) also varied obviously as a function of RH. NO2 and
neous or multiphase oxidations includes the uptake of SO2 O3 played important role in aqueous S(IV) oxidation when
and the following oxidation in particle phase. Thus, it RH was from 35 % to 45 %, while TMI became the domina-
is meaningful to identify the rate-determining step (RDS) tor when RH ranged from 45 % to 70 %. Above 70 % RH, the
for understanding the evolution of the SOR. As shown in contribution of H2 O2 was dominant, which is consistent with
Fig. 3, the initial γSO2 ,BET increased exponentially from 0 several recent studies (P. Liu et al., 2020; T. Liu et al., 2020).
to (1.13 ± 0.21) × 10−5 when the RH increases from 2 % However, the total formation rate of sulfate in aerosol liquid
to 80 % in the presence of 50 ± 2.5 ppb NH3 with or with- phase slightly decreased as RH increased. A weak downward
out 100 ± 2.5 ppb NO2 . The dependence of γSO2 ,BET on RH trend of the d[SO2−4 ]/dt rate with RH was also observable in
was γSO2 ,BET = 2.44E −7+6.69E −8×exp(RH/17.4) with the 2D kernel density graphs as shown in Fig. 4c. This is op-
a correlation coefficient of 0.96. A transition region of the posite to the dependencies of the SOR and the γSO2 on RH as
γSO2 ,BET versus the RH was observable when the RH ranged discussed above, which means the RDS for sulfate formation
from 60 % to 80 %. When the RH was higher than 70 %, the should be the uptake of SO2 instead of oxidation of S(IV)
γSO2 ,BET increased quickly as a function of the RH. The sim- in aqueous phase. We further calculated the production rate
ilar dependency on RH for the γSO2 ,BET and the SOR sug- of sulfate through uptake of SO2 (mass transfer to aerosol
gests that the uptake kinetic of SO2 might determine sulfate
formation.
https://doi.org/10.5194/acp-21-13269-2021 Atmos. Chem. Phys., 21, 13269–13286, 202113276 Y. Liu et al.: Ammonium nitrate promotes sulfate formation
Figure 3. Relationship between SOR and γSO2 ,BET on dust internally mixed with NH4 NO3 (2 : 1) and RH in (a) Shijiazhuang and (b)
Beijing and the correlation of (c) SOR in Shijiazhuang and (d) γSO2 ,BET with AWC/PM2.5 . The initial concentrations of SO2 , NO2 and/or
NH3 in the flow tube reactor were 190 ± 2.5, 100 ± 2.5 and/or 50 ± 2.5 ppb, respectively. The grey lines are the fitting curves for the most
probable SOR, and the white lines are the fitting curves for the γSO2 ,BET .
particles) according to al., 2017) under the typical urban environment in Beijing
h i based on rebound fractions measurements. It was also con-
d SO2− 4 96 γSO2 As ωcSO2 firmed that haze particles displayed a solid–aqueous equilib-
= 3600 · · , (9) rium state when the RH was around 60 %–80 % using an in-
dt 64 4
dividual particle hygroscopicity system (Sun et al., 2018). As
where As is the surface area concentration of PM2.5 , ω is shown in Fig. S6, the most probable distribution of the AWC
the mean molecular velocity of SO2 and cSO2 is the mass exponentially increased with the RH (AWC = −5.76+5.15×
concentration of SO2 . As shown in Fig. 4c, the probability- exp(RH/36.1), R = 0.98) in Shijiazhuang. An obvious tran-
weighted production rate of sulfate through uptake of SO2 sition region of the RH between 60 % and 80 % was also ob-
(the grey line) is lower than that through aqueous oxidation served. These results indicate that the liquid-phase aerosol
of S(IV), in particular, when RH is lower than 70 %. It should should appear when the RH is higher than ∼ 60 % (Y. Liu
be noted that the mass transfer of SO2 was not assumed to be et al., 2019, 2017) and subsequently promote the conver-
the RDS using a large mass accommodation coefficient of sion of SO2 to sulfate. The SOR increased as a power func-
SO2 (α = 0.11) (Cheng et al., 2016). According to the re- tion of AWC (SOR = 0.072 + 0.043 × AWC0.53 , R = 0.78),
lationship between the mass accommodation coefficient (α) while it was linearly correlated with the ratio of AWC/PM2.5
and the uptake coefficient (γ ) of SO2 (Kulmala and Wagner, (SOR = 0.15 + 0.40 × AWC/PM2.5 , R = 0.78) as shown in
2001), the αSO2 on particles is on the same order of the γSO2 . Fig. 3c. Similarly, the AWC of dust internally mixed with
This means that mass transfer rate might have been overesti- NH4 NO3 was also calculated using the ISORROPIA II
mated by Cheng et al. (2016). model. The γSO2 ,BET also showed a similar trend as a func-
Phase state is a crucial factor determining the mass trans- tion of AWC/PM2.5 (γSO2 ,BET = 3.08E − 5 × AWC/PM2.5 ,
fer of pollutants from gas phase to particle phase (Davis et R = 0.95) (Fig. 3d), although the ranges of AWC/PM2.5
al., 2015; Marshall et al., 2018; Shiraiwa et al., 2011; Liu et were different due to the difference in aerosol composition.
al., 2014), while the AWC or RH greatly affects the phase This means that the fraction of aerosol liquid water governs
state of aerosol particles (Duan et al., 2019; Y. Liu et al., both the conversion of SO2 to sulfate and uptake kinetics of
2019; Shiraiwa et al., 2017). For example, ambient particles SO2 .
were found to change from semisolid to liquid state when It should be noted that although the SOR showed a simi-
the RH was above ∼ 60 % (Y. Liu et al., 2019, 2017), corre- lar RH dependence as the SO2 , a deviation was observed in
sponding to the AWC higher than ∼ 15 µg m−3 (Y. Liu et both Shijiazhuang and Beijing (Fig. 3). The γSO2 was mea-
Atmos. Chem. Phys., 21, 13269–13286, 2021 https://doi.org/10.5194/acp-21-13269-2021Y. Liu et al.: Ammonium nitrate promotes sulfate formation 13277
Figure 4. (a) The relative importance of oxidation paths of S(IV) in aqueous phase, the dependence of (b) sulfate formation rates and (c) the
probability-weighted sulfate formation rates on RH in Shijiazhuang.
2−
sured at a fixed temperature and initial SO2 concentration. In the molar ratio of NH+
4 to SO4 (RNH4 +/SO2− ) accord-
4
the atmosphere, both of them varied obviously. This might ing to the following rules: (i) if 013278 Y. Liu et al.: Ammonium nitrate promotes sulfate formation
Figure 5. Variations of (a) the mass concentrations and (b) the mass fractions of molecular composition in PM2.5 , (c) the estimated AWC
attributed to different composition and (d) the corresponding AWC fraction as a function of RH in Shijiazhuang.
dominated the AWC when the RH ranged from 60 % to 80 %, weak increase followed by a decrease was observed for the
in which the SOR and the γSO2 were very sensitive to RH. AWC/PM2.5 as the fraction of (NH4 )2 SO4 increased, while
These results suggest that NH4 NO3 should be the most im- a negative correlation between the AWC/PM2.5 and the frac-
portant mediator to AWC and subsequently the uptake of tion of NH4 Cl was observed. It did so for the SOR and the
SO2 in the transition regime of RH in Fig. 3a. It should fraction of NH4 Cl. These phenomena were overall consis-
be noted that (NH4 )HSO4 has a lower DRH than NH4 NO3 tent with the sequence of their hygroscopicity. In addition,
(Y. J. Li et al., 2017). However, 98.4 % of the data points chloride is a primary pollutant mainly from coal combustion
showed an RNH4 +/SO2− higher than 2.0 in Shijiazhuang. This and biomass burning (Bi et al., 2019). Besides chloride, other
4
means that the contribution of (NH4 )HSO4 to PM2.5 should primary particles from combustion such as soot, which were
be negligible because of the abundance of atmospheric NH3 not accounted for in this work, might also decrease the up-
in northern China. In previous work, it has been found that take capability of water and subsequently be unfavorable for
SO2 oxidation can be promoted by particulate nitrate through SO2 uptake.
the accumulation of proton (Zhang et al., 2019) and the for- To assess the relative importance of sulfate and nitrate (the
mation of NO+ NO− 3 (Kong et al., 2014). Our results fur-
major SIA component) to AWC, the sensitivity of their frac-
ther showed the importance of NH4 NO3 in the AWC, which tion to AWC in Shijiazhuang was tested using the ISOR-
possibly determines the phase state of particles and subse- ROPIA II model and shown in Fig. S9. The base case means
quently the uptake kinetics of SO2 and the SOR as discussed the AWC was calculated using the measured concentration
above. To further confirm the role of NH4 NO3 in the uptake of the ions. Then, we reduced the fraction of NH4 NO3 or
of SO2 , uptake experiment of SO2 on pure dust has been car- (NH4 )2 SO4 from 0 to 80 % individually compared with the
ried out at 2 % and 80 % RH. The corresponding γSO2 ,BET base case. Figure S9a shows the time series of the calculated
was 1.10 ± 1.05 × 10⁻⁷ and 1.66 ± 0.28 × 10⁻⁷ on pure dust AWC after reducing 50 % of NH4 NO3 or (NH4 )2 SO4 . Re-
sample in the presence of NH3 and NO2 . However, as dis- duction of either NH4 NO3 or (NH4 )2 SO4 resulted into obvi-
cussed above, it was 0 and 1.12 ± 0.15 × 10⁻⁵ on dust inter- ous decrease of AWC during pollution events. In most cases,
nally mixed with 33 % NH4 NO3 . This directly confirmed the the reduction amplitude of AWC was larger when reduc-
role of NH4 NO3 in SO2 uptake via aerosol liquid water. ing 50 % of NH4 NO3 than (NH4 )2 SO4 . Figure S9b shows
Figure S8 shows the dependencies of the AWC/PM2.5 the mean ratio of AWC at a certain reduction fraction of
and SOR on the fraction of the individual molecular compo- NH4 NO3 or (NH4 )2 SO4 to that under the base case. When
nent. Both the AWC/PM2.5 and SOR statistically increased NH4 NO3 was reduced from 0 % to 80 %, the AWC linearly
as the fraction of NH4 NO3 increased (Fig. S8a and d). A reduced from 0 % to 61.1 ± 0.1 % with a slope of 0.48 %.
Atmos. Chem. Phys., 21, 13269–13286, 2021 https://doi.org/10.5194/acp-21-13269-2021Y. Liu et al.: Ammonium nitrate promotes sulfate formation 13279
It varied from 0 % to 66.0 ± 0.2 % for (NH4 )2 SO4 (with a be positively correlated to NO2 concentration if it can pro-
slope of 0.41 %). This means that the AWC is more sensi- mote the conversion of SO2 to sulfate or the uptake of SO2 .
tive to the fraction of NH4 NO3 than (NH4 )2 SO4 in Shiji- However, both sulfate fraction and SOR were negatively cor-
azhuang. This also implies the importance of NH4 NO3 in the related with the concentration of NO2 from the point of view
observed high AWC in haze days. On the other hand, reduc- of statistics. A same trend was observed in Beijing (Fig. S10).
ing 10 % of NH4 NO3 can lead to a reduction of 5.2 ± 1.0 % This is similar to recent studies that observed the oppo-
AWC during haze days. Subsequently, we can roughly esti- site correlation between SOR and NOx concentration in the
mate that the SOR might be reduced by ∼ 4 % through a lin- Sichuan Basin (Tian et al., 2019) and in Beijing (Fang et al.,
ear interpolation according to the equation of the SOR and 2019). This means that NO2 concentration is statistically not
the AWC/PM2.5 (SOR = 0.15 + 0.40 × AWC/PM2.5 ) fitted a determining factor for sulfate formation in the atmosphere.
in Fig. 3c. This means reduction of NOx and NH3 should This is well supported by the uptake kinetics of SO2 mea-
lead to additional reduction of particulate sulfate. sured using a flow tube reactor. As shown in Fig. 3a and b,
when 50 ± 2.5 ppb of NH3 presenting in the reactant gases,
3.4 Influence of other factors on sulfate formation no difference was observable for the γSO2 ,BET between the
presence (red squares) and absence of 100 ± 2.5 ppb of NO2
Several studies have proposed out that NO2 can promote the (white triangles). This is consistent with these previous stud-
oxidation of SO2 on particle surfaces and in aqueous phase. ies that found NO2 to be having no influence on SO2 uptake
For example, laboratory studies have found that parts per mil- when NH3 was abundant in the atmosphere (Wu et al., 2019;
lion (ppm) levels of NO2 can promote sulfate formation on Wang et al., 2021). In addition, it is consistent with the fact
the surface of dust through NO+ NO− 3 which is dispropor- that H2 O2 dominated the oxidation of S(IV) in aerosol liquid
tionated from N2 O4 intermediate (He et al., 2014; Liu et al., water when RH was higher than 60 % (Fig. 4a). It should be
2012; Ma et al., 2008) or parts per million levels of NO2 can pointed out that the γSO2 at 80 % RH was 1.7 ± 0.3 × 10⁻⁶
promote the oxidation of SO2 in the deliquesced oxalic acid on the mixture of dust and NH4 NO3 in the absence of NH3
(Wang et al., 2016). This is supported by the evidence that a and NO2 (Fig. 3). It increased to 3.7 ± 0.2 × 10⁻⁶ in the pres-
high fraction of sulfate in PM2.5 is positively correlated with ence of NO2 . This is consistent with the promotion effect of
NO2 concentration (Xie et al., 2015) and that a high PM2.5 NO2 for converting SO2 to sulfate in the absence of NH3 as
concentration is accompanied with high ratio of NO2 /SO2 observed in both a smog chamber (Wang et al., 2016) and
in several case studies (He et al., 2014). The importance of a bubbling reactor (T. Chen et al., 2019). However, the en-
the SO2 oxidation by NO2 in aqueous phase has also been hanced uptake of SO2 induced by NO2 might be too low to
confirmed in modeling studies (Cheng et al., 2016; Xue et be measured in the presence of NH3 . Therefore, the weak
al., 2016). However, this reaction path is still under debate promotion effect by NO2 alone cannot explain the negative
because of the following reasons. (1) The concentration of correlation between the SOR and the concentration of NO2
NO2 in laboratory studies was about 2 orders of magnitude in Fig. 6f.
higher than that in ambient air. This will affect the surface Both the fraction of sulfate and the SOR in Shijiazhuang
concentration of the intermediate (N2 O4 ) and the concen- statistically decreased as a function of SO2 and CO concen-
tration of solved NO2 in aqueous phase. (2) The dissolved tration, respectively (Fig. 6b, c, g and h). This might be ex-
NO2 concentration is highly sensitive to pH. The pH value in plained by the high concentration of primary aerosol compo-
aerosol was 5.6–6.2 estimated in modeling study (Cheng et nents when pollution events occurred with high concentra-
al., 2016). However, a recent work found that it varied from tions of primary gas-phase pollutants. However, the fraction
3.8 to 4.5 at RH > 30 % and showed a moderate acidity be- of sulfate increased as a function of O3 (Fig. 6d). When the
cause of the thermodynamic equilibrium between NH+ 4 and O3 concentration was greater than 50 ppb, the SOR slightly
NH3 (Ding et al., 2019). (3) The previous calculations were increased with the O3 concentration (Fig. 6i). A more obvi-
conducted using a high reaction rate constant of the NO2 re- ous positive dependence of sulfate fraction on O3 concen-
action with dissolved S(IV) (Clifton et al., 1988; Cheng et al., tration was observed in Beijing (Fig. S10e). This means ox-
2016), while a smaller value was reported in the more recent idation capacity also plays an important role in sulfate for-
study (Spindler et al., 2003; Tilgner et al., 2021). (4) The rel- mation, especially in Beijing. This is consistent with the re-
ative importance of each path depends on the concentration cent finding that O3 plays an important role in SO2 oxi-
of the relevant pollutants including H2 O2 and TMI (P. Liu et dation at different locations (Fang et al., 2019; Tian et al.,
al., 2020). Therefore, it is necessary to verify the importance 2019; Duan et al., 2019). As shown in Fig. 6j, the SOR
of this process by long-term observation at different environ- positively correlated with the concentration of NH3 in Shi-
ments. jiazhuang. This means that NH3 can promote the conver-
Figure 6 shows the 2D kernel density graph of the sul- sion of SO2 to sulfate. This is well in agreement with lab-
fate fraction in soluble PM and the SOR in Shijiazhuang as oratory studies that observed the promotion effect by NH3
a function of the concentration of different gas-phase pollu- to the heterogeneous reaction of SO2 on different mineral
tants. It should be pointed out that the SOR or the γSO2 should oxides (Yang et al., 2016). In addition, flow tube experi-
https://doi.org/10.5194/acp-21-13269-2021 Atmos. Chem. Phys., 21, 13269–13286, 202113280 Y. Liu et al.: Ammonium nitrate promotes sulfate formation
Figure 6. Dependence of the sulfate fraction in soluble PM and the SOR on gaseous pollutant concentration in Shijiazhuang.
ments were also carried out by exposing the internal mix- RH from the point of view of statistics, which was similar to
ing sample (2 : 1 dust and NH4 NO3 ) to 200 ± 2.5 ppb SO2 the RH dependence of the γSO2 on the model particles con-
in the absence of NH3 and NO2 at 2 % and 80 % RH, re- taining 33 % NH4 NO3 in the presence of NH3 . The SOR and
spectively. As shown in Fig. 3a and b, the γSO2 ,BET was γSO2 linearly increased as a function of the fraction of aerosol
zero regardless of the reactants under dry condition (2 % water content in PM2.5 . The enhanced uptake coefficient of
RH), while it increased to (1.66 ± 0.28) × 10−6 at 80 % SO2 at high RH after the liquid-phase aerosol appeared might
RH. However, it was significantly smaller than the γSO2 ,BET explain the increased SOR, because uptake of SO2 was the
((1.13 ± 0.21) × 10−5 ) in the presence of 50 ± 2.5 ppb NH3 rate-determining step for the conversion of SO2 to particu-
with or without 100 ± 2.5 ppb NO2 . These results further late sulfate. NH4 NO3 played an important role in the AWC,
confirm that NH3 can promote the uptake of SO2 at high RH, the phase state of aerosol particles and subsequently the up-
possible through enhancing the solubility of SO2 in water take kinetics of SO2 in haze days under high RH conditions.
(T. Chen et al., 2019; Cheng et al., 2016; Wang et al., 2016), The contribution of nitrate to PM2.5 is increasing in China
because the effective solubility of SO2 can be enhanced due (Li et al., 2018; Tian et al., 2019) due to the intensive emis-
to the increase of the aerosol pH. sions of NOx from steel production and cement manufac-
Aerosol acidity is one of the important factors affecting the turing (Wu et al., 2018; Qi et al., 2017) as well as the in-
sulfate formation and the partitioning of semivolatile gases creasing NOx emissions from traffic (Liu et al., 2007; Wang
in the atmosphere (Liu et al., 2021). As shown in Fig. S11, et al., 2011). The mean fraction of nitrate in PM2.5 was
when aerosol pH is lower than 4.5, the oxidation rate of 21.4 ± 12.4 % in Shijiazhuang and 15.8 ± 13.4 % in Beijing.
S(IV) in aerosol liquid phase decreases with decreasing pH, They were close to the reported values in PM1.0 during the
because the oxidation of S(IV) by transition metals is the summer of Beijing (24 %) (Li et al., 2018) and in PM2.5 dur-
dominant path and is decreasing with aerosol pH. However, ing the winter of Chengdu (23.3 %) and Chongqing (17.5 %)
the oxidation rate of S(IV) increases when the aerosol pH is (Tian et al., 2019). It has been found that the fraction of ni-
higher than 4.5. This can be explained by the fact that the trate and ammonium usually increases as a function of PM2.5
solubility and effective Henry’s law constant of SO2 are pos- mass concentration (Li et al., 2018). Therefore, NOx should
itively dependent on pH (Cheng et al., 2016; Liu et al., 2021; be an urgent air pollutant in the future in China even from the
P. Liu et al., 2020), which is consistent with the promotion point view of its contribution to PM2.5 mass.
effect of sulfate formation by NH3 . As observed in this work, NH4 NO3 has an important con-
tribution to PM2.5 mass concentration, the aerosol water con-
tent and subsequently the phase state of particles in the RH
4 Conclusions and atmospheric implications range of 60 %–80 %. Reduction of NOx emissions should
lead to a decrease in NH4 NO3 concentration and subse-
Based on 1 year of observations, we confirmed that high quently the AWC during serve pollution events. This will
PM2.5 mass concentration in pollution events usually coin- lead to an additional reduction of SO2 uptake and the forma-
cided with the high sulfate concentration, the fraction of sul- tion of particulate sulfate through aqueous reactions. Based
fate, and the SOR in both Beijing and Shijiazhuang. In Shi- on our rough estimation, 4 % of sulfate might be reduced due
jiazhuang, the SOR exponentially increased as a function of
Atmos. Chem. Phys., 21, 13269–13286, 2021 https://doi.org/10.5194/acp-21-13269-2021Y. Liu et al.: Ammonium nitrate promotes sulfate formation 13281
to aqueous reaction in Shijiazhuang if the mass concentration via ATM-GTP 266 (742206) and via ERA-NET-Cofund through
of NH4 NO3 was reduced by 10 %. More work is required SMart URBan Solutions for air quality, disasters and city growth
to quantitatively assess the contribution of nitrate to sulfate (SMURBS/ERA PLANET), the Strategic Priority Research Pro-
formation from aqueous reactions in the future. It should be gram of Chinese Academy of Sciences and Beijing University of
noted that ozone pollution becomes more and more impor- Chemical Technology.
tant in China (Z. Chen et al., 2019; Ziemke et al., 2019).
This requires us to harmoniously reduce NOx and volatile
Review statement. This paper was edited by Harald Saathoff and
organic compounds in the near future. It is also important to
reviewed by two anonymous referees.
take actions on NH3 emission control in the future as NH3
can significantly promote the uptake of SO2 in liquid-phase
aerosol.
References
Data availability. The experimental data are available upon request An, Z., Huang, R.-J., Zhang, R., Tie, X., Li, G., Cao, J., Zhou,
to the corresponding authors. W., Shi, Z., Han, Y., Gu, Z., and Ji, Y.: Severe haze in north-
ern China: A synergy of anthropogenic emissions and atmo-
spheric processes, P. Natl. Acad. Sci. USA, 116, 8657–8666,
Supplement. The supplement related to this article is available on- https://doi.org/10.1073/pnas.1900125116, 2019.
line at: https://doi.org/10.5194/acp-21-13269-2021-supplement. Bi, X., Dai, Q., Wu, J., Zhang, Q., Zhang, W., Luo, R., Cheng, Y.,
Zhang, J., Wang, L., Yu, Z., Zhang, Y., Tian, Y., and Feng, Y.:
Characteristics of the main primary source profiles of particulate
matter across China from 1987 to 2017, Atmos. Chem. Phys., 19,
Author contributions. YoL and XB designed the experiments. YoL
3223–3243, https://doi.org/10.5194/acp-19-3223-2019, 2019.
and YuL wrote the paper. ZF, FZ, YZ, XF, CY, BC, YW, WD and JC
Chen, D., Liu, Z., Ban, J., and Chen, M.: The 2015 and 2016 win-
carried out measurements at BUCT. XB and TJ carried out measure-
tertime air pollution in China: SO2 emission changes derived
ments at SJZ. YG, YZ and YoL carried out flow tube experiments.
from a WRF-Chem/EnKF coupled data assimilation system , At-
PL, YM and YoL performed sulfate formation calculations. YuL,
mos. Chem. Phys., 19, 8619–8650, https://doi.org/10.5194/acp-
FB, TP, YM, HH and MK revised the paper.
19-8619-2019, 2019a.
Chen, D., Liu, Z., Ban, J., Zhao, P., and Chen, M.: Retrospec-
tive analysis of 2015–2017 wintertime PM2.5 in China: re-
Competing interests. The authors declare that they have no conflict sponse to emission regulations and the role of meteorology, At-
of interest. mos. Chem. Phys., 19, 7409–7427, https://doi.org/10.5194/acp-
19-7409-2019, 2019b.
Chen, Q., Sheng, L. F., Gao, Y., Miao, Y. C., Hai, S.
Disclaimer. Publisher’s note: Copernicus Publications remains F., Gao, S. H., and Gao, Y.: The Effects of the Trans-
neutral with regard to jurisdictional claims in published maps and Regional Transport of PM2.5 on a Heavy Haze Event in
institutional affiliations. the Pearl River Delta in January 2015, Atmosphere, 10, 237,
https://doi.org/10.3390/atmos10050237, 2019.
Chen, T., Chu, B., Ge, Y., Zhang, S., Ma, Q., He, H.,
Acknowledgements. The research was financially supported by the and Li, S.-M.: Enhancement of aqueous sulfate forma-
National Natural Science Foundation of China (92044301), the tion by the coexistence of NO2 /NH3 under high ionic
Ministry of Science and Technology of the People’s Republic of strengths in aerosol water, Environ. Pollut., 252, 236–244,
China (2019YFC0214701), Academy of Finland via the Center https://doi.org/10.1016/j.envpol.2019.05.119, 2019.
of Excellence in Atmospheric Sciences (272041, 316114, 315203 Chen, Z., Zhuang, Y., Xie, X., Chen, D., Cheng, N., Yang,
and 1307537), and European Research Council via ATM-GTP 266 L., and Li, R.: Understanding long-term variations of me-
(742206) and via ERA-NET-Cofund through SMart URBan So- teorological influences on ground ozone concentrations in
lutions for air quality, disasters and city growth (SMURBS/ERA- Beijing During 2006–2016, Environ. Pollut., 245, 29–37,
PLANET), the Strategic Priority Research Program of Chinese https://doi.org/10.1016/j.envpol.2018.10.117, 2019.
Academy of Sciences and Beijing University of Chemical Technol- Cheng, J., Su, J., Cui, T., Li, X., Dong, X., Sun, F., Yang, Y.,
ogy. Tong, D., Zheng, Y., Li, Y., Li, J., Zhang, Q., and He, K.:
Dominant role of emission reduction in PM2.5 air quality im-
provement in Beijing during 2013–2017: a model-based de-
Financial support. This research has been supported by the Na- composition analysis, Atmos. Chem. Phys., 19, 6125–6146,
tional Natural Science Foundation of China (grant no. 92044301) https://doi.org/10.5194/acp-19-6125-2019, 2019.
and the Ministry of Science and Technology of the People’s Re- Cheng, Y., Zheng, G., Wei, C., Mu, Q., Zheng, B., Wang, Z., Gao,
public of China (grant no. 2019YFC0214701), Academy of Fin- M., Zhang, Q., He, K., Carmichael, G., Pöschl, U., and Su,
land via the Center of Excellence in Atmospheric Sciences (272041, H.: Reactive nitrogen chemistry in aerosol water as a source
316114, 315203 and 1307537), and European Research Council of sulfate during haze events in China, Sci. Adv., 2, e1601530,
https://doi.org/10.1126/sciadv.1601530, 2016.
https://doi.org/10.5194/acp-21-13269-2021 Atmos. Chem. Phys., 21, 13269–13286, 2021You can also read