Mitigation environmental affairs - SOUTH AFRICA'S GREENHOUSE GAS MITIGATION POTENTIAL ANALYSIS - Department of Environmental Affairs
←
→
Page content transcription
If your browser does not render page correctly, please read the page content below

mitigation                                        REPORT

SOUTH AFRICA’S GREENHOUSE GAS MITIGATION POTENTIAL ANALYSIS

 TECHNICAL APPENDIX G – AGRICULTURE, FORESTRY AND OTHER L AND USE (AFOLU) SECTOR

 environmental affairs
 Department:
 Environmental Affairs
 REPUBLIC OF SOUTH AFRICA

mitigation                                        REPORT

SOUTH AFRICA’S GREENHOUSE GAS MITIGATION POTENTIAL ANALYSIS
 TECHNICAL APPENDIX G – AGRICULTURE, FORESTRY AND OTHER L AND USE (AFOLU) SECTOR

The following citation should be used for this report:

Department of Environmental Affairs, 2014 South Africa’s Greenhouse Gas (GHG)
Mitigation Potential Analysis, Pretoria, South Africa.

The suite of reports that make up South Africa’s Greenhouse Gas (GHG) Mitigation Potential Analysis include the following:

Technical Summary

Main Report

Technical Appendices:

Appendix A: Approach and Methodology

Appendix B: Macroeconomic Modelling

Appendix C: Energy Sector

Appendix D: Industry Sector

Appendix E: Transport Sector

Appendix F: Waste Sector

Appendix G: Agriculture, Forestry and Other Land Use Sector

ii

List of Abbreviations
  Acronym          Definition
  AFOLU            agriculture, forestry and other land use
  CO2              carbon dioxide
  CO2e             carbon dioxide equivalent
  DAFF             Department of Agriculture, Forestry and Fisheries
  DEA              Department of Environmental Affairs
  GHG              greenhouse gas
  GVA              gross value added
  IPCC             Intergovernmental Panel on Climate Change
  ktCO2e           kilotonnes of carbon dioxide equivalent
  MAC              marginal abatement cost
  MACC             marginal abatement cost curve
  MCA              multi-criteria analysis
  MtCO2e           million tonnes of carbon dioxide equivalent
  N 2O             nitrous oxide
  NCCRP            National Climate Change Response Policy
  NPV              net present value
  STRP             Subtropical Thicket Restoration Programme
  TWG-M            Technical Working Group on Mitigation
  UNFCCC           United Nations Framework Convention on Climate Change
  WAM              ‘with additional measures’ scenario
  WEM              ‘with existing measures’ scenario
  WOM              ‘without measures’ scenario
  ZAR/R            South African rand

 Acknowledgements
 The South African Greenhouse Gas Mitigation Potential Analysis was supported by the Deutsche Gesellschaft für Internationale
 Zusammenarbeit (GIZ), on behalf of the Federal Ministry for the Environment, Nature Conservation, Building and Nuclear Safety
 (BMUB) of the Federal Republic of Germany.

 The analysis was conducted by Camco Clean Energy, in partnership with Ricardo-AEA, PDG and Conningarth Economists.

 The project team acknowledges the support of Dr Bruno Merven and Dr Andrew Marquard, both of the Energy Research Centre
 of the University of Cape Town, for providing updated energy price projections based on the South African TIMES model (SATIM).

TECHNICAL APPENDIX G – AGRICULTURE , FORESTRY AND OTHER L AND USE (AFOLU) SECTOR                                            iii

Table of Contents
List of Abbreviations ...........................................................................................................................................................................................................................................iii
Acknowledgements..............................................................................................................................................................................................................................................iii

1.            Introduction .......................................................................................................................................................................................................................................... 1

2.            Reference Case Projection ............................................................................................................................................................................................................ 1
2.1.          Approach .................................................................................................................................................................................................................................................. 1
2.2.          ‘Without Measures’ Reference Case Projection ............................................................................................................................................................. 2

3.            Identification of Mitigation Measures ...................................................................................................................................................................................... 4

4.            Costing and Mitigation Potential of Mitigation Measures ........................................................................................................................................... 6
4.1.          Basis for Costing ................................................................................................................................................................................................................................... 6
4.2.          Marginal Abatement Cost Curves ............................................................................................................................................................................................ 7

5.            Projections ‘With Additional Measures’................................................................................................................................................................................. 9
5.1.          Technical Mitigation Potential ...................................................................................................................................................................................................... 9
5.2.          The ‘With Additional Measures’ Projection ....................................................................................................................................................................... 9

6.            Impact Assessment of Individual Mitigation Measures ............................................................................................................................................. 10
6.1.          Scoring of Each Measure in Relation to Agreed Criteria ..........................................................................................................................................10
6.2.          Net Benefit Curve ............................................................................................................................................................................................................................ 11

7.            References .............................................................................................................................................................................................................................................. 12

List of Tables
     Table 1:                   Reference case projection for AFOLU: Total of all GHG emissions                                                                                                                                                               3
     Table 2:                   List of mitigation opportunities identified by the AFOLU Task Team                                                                                                                                                            4
     Table 3:                   Costing and mitigation potential of mitigation measures for the AFOLU sector                                                                                                                                                  6
     Table 4:                   Technical mitigation potential for the AFOLU sector, assuming all measures are implemented
                                                                                                                                                                                                                                                              9
                                (in ktCO2e)
     Table 5:                   Quantitative data informing the scoring of mitigation options for the AFOLU sector                                                                                                                                           10
     Table 6:                   Distribution of points assigned to each option for the AFOLU sector                                                                                                                                                          10

List of Figures
     Figure 1:                  AFOLU reference case emissions projection                                                                                                                                                                                      2
     Figure 2:                  MACC for 2020 for the AFOLU sector                                                                                                                                                                                             7
     Figure 3:                  MACC for 2030 for the AFOLU sector                                                                                                                                                                                             8
     Figure 4:                  MACC for 2050 for the AFOLU sector                                                                                                                                                                                             8
     Figure 5:                  Emissions projections with all additional measures (WAM) for the AFOLU sector                                                                                                                                                  9
     Figure 6:                  Net benefit curve for the balanced weighting scenario for the AFOLU sector                                                                                                                                                    11

iv
1. Introduction                                                                   2. Reference Case Projection
 This appendix covers projected emissions and mitigation                           The structure for making projections for the GHG mitigation
 potential for the agriculture, forestry and other land use                        analysis as a whole provides for projections of emissions ‘with-
 (AFOLU) sector. Mitigation options covering the follow-                           out measures’ (WOM) and ‘with existing measures’ (WEM).
 ing IPCC emission categories have been considered in this                         The WOM projection assumes that no climate change mit-
 assessment:                                                                       igation actions are implemented between 2000 and 2050.
                                                                                   The WEM projection incorporates the impacts of climate
 •    3A1 enteric fermentation                                                     change mitigation actions including climate change policies
                                                                                   and measures implemented between 2000 and 2010, and
 •    3A2 manure management
                                                                                   projects future emissions to 2050 on this basis.
 •    3B1 forestry land remaining forestry land and land con-
      verted to forest land                                                        In the case of the AFOLU sector, there are no major ‘existing
                                                                                   measures’ which are significant enough to include and, there-
 •    3B1b land converted to forest land                                           fore, the assumption is that the WOM and WEM projections
 •    3B1-6b land converted into other land                                        are identical.

 •    3B2 cropland remaining cropland and land converted
      into cropland                                                                2.1     Approach
                                                                                   The starting point for this analysis is the concept of a pro-
 •    3C4 direct N2O from managed soils
                                                                                   jection of emissions from 2010 to 2050 ‘without measures’.
 •    3C1 biomass burning                                                          From the point of view of GHG emissions, the division of
                                                                                   the sector into productive activity (under the agriculture and
 Emissions projections consider all of these categories but, in                    commercial forestry sectors) and non-productive activity
 the case of forestry, deal only with commercial forestry and                      (associated with changes to natural biomes) needs to be rec-
 not natural forests. In the case of natural biomes, only measures                 ognised. In each case the emissions projections are driven by
 which can be undertaken through managed programmes are                            a different set of factors.
 considered and broader shifts to these biomes resulting from
 unmanaged activities or climate change are not addressed.                         2.1.1 Projections related to productive sectors
                                                                                   In the case of productive activity, projections are driven by:
 The final list of mitigation options presented for the AFOLU
                                                                                   economic growth which may lead to higher levels of produc-
 sector (Table 2) was agreed after correspondence and col-
                                                                                   tion changes to production due to technology and manage-
 laboration with the AFOLU Task Team and other experts and
                                                                                   ment practices which are not related to mitigation measures
 specialists in the field.
                                                                                   constraints to production which limit growth of the sector the
                                                                                   balance between local production and imports.

                                                                                   Based on an analysis of land use data, the opinions of land use
                                                                                   sector specialists and the AFOLU Task Team, discussions, an
                                                                                   important assumption has been made: that land areas under
                                                                                   crop production and commercial forestry are stable.1 There-
                                                                                   fore, economic growth is not a driver of emissions in this sec-
                                                                                   tor. While the demand for agricultural products continues to
                                                                                   grow, this demand is being met through production on areas
                                                                                   which remain largely the same, complemented by growing
                                                                                   imports.

 1. In addition, data on croplands is too unreliable since the Abstract of Agricultural Statistics (DAFF, 2012) reports a decreasing trend, while satellite
    imagery shows that croplands are increasing. It is therefore assumed that cropland and the related indirect emissions from managed soils are stable.

TECHNICAL APPENDIX G – AGRICULTURE , FORESTRY AND OTHER L AND USE (AFOLU) SECTOR                                                                         1
This implies a reference case with stable emissions of nitrous                           mental Affairs has acknowledged the importance of having a
oxide (N2O) from cropland, both direct and indirect. It also                             better understanding of carbon stock changes and hence has
implies zero carbon emissions (or carbon sequestration) from                             initiated a ‘Sinks and Sources’ study which will address these
the commercial forestry sector for the reference case.2 This is                          data gaps. In the interim, and for the purpose of this reference
based on the assumption that the area under commercial                                   case projection, zero net emissions are assumed from natural
forestry is stable with harvested timber replaced continuously                           biomes, other than through biomass burning.
by new growth.3
                                                                                         Emissions from biomass burning show a marginal decrease
In the case of the livestock sector, the reference case projections                      over time and existing data has been used to project the
are driven by the declining trends in herd numbers (DAFF, 2012)                          level of current emissions and the trend (Archibald pers.
and increases in location of cattle on feedlots. Herd numbers are                        comm., 2013).
declining hence emissions from enteric fermentation decline.
Increasing use of cattle feedlots leads to increases in emissions                        2.2   ‘Without Measures’ Reference Case Projection
from manure management for the reference case (Scholes pers.
                                                                                         The reference case for the AFOLU sector is based on a ‘with
comm., 2013; SA Feedlot Association, 2013).
                                                                                         existing measures’ projection that is identical to the ‘without
                                                                                         measures’ projection. The single reference case projection is
2.1.2 Projections relating to natural biomes                                             shown in Figure 1 and Table 1 below. The figures for emis-
The changes in emissions from natural biomes relate to chang-                            sions are calculated based on the IPCC methodology and
ing land areas under various vegetation types and the change                             are consistent with the draft 2010 national GHG Inventory
in plant and soil carbon density on these land areas. There is                           (DEA, 2013) calculations as they were at the time this refer-
data on land area change but, at the time of writing, this was                           ence case projection was finalised in June 2013.5
not considered reliable enough to make projections of car-
bon stock trends.4 However, the Department of Environ-

Figure 1: AFOLU reference case emissions projection

2. N
    ote that this applies to plantation activity only and not to the ‘downstream’ activities associated with processing timber products. The latter are
   covered under the Pulp and Paper sector.
3. It is recognised that there is a shift in density as trees with low density are replaced with higher density species. However, it has not been possible
   to assess the extent of this change.
4. The primary reason for this is the change in land sensing methodology over the past decade.
5. A full set of calculations relating to the reference case is available on request.

2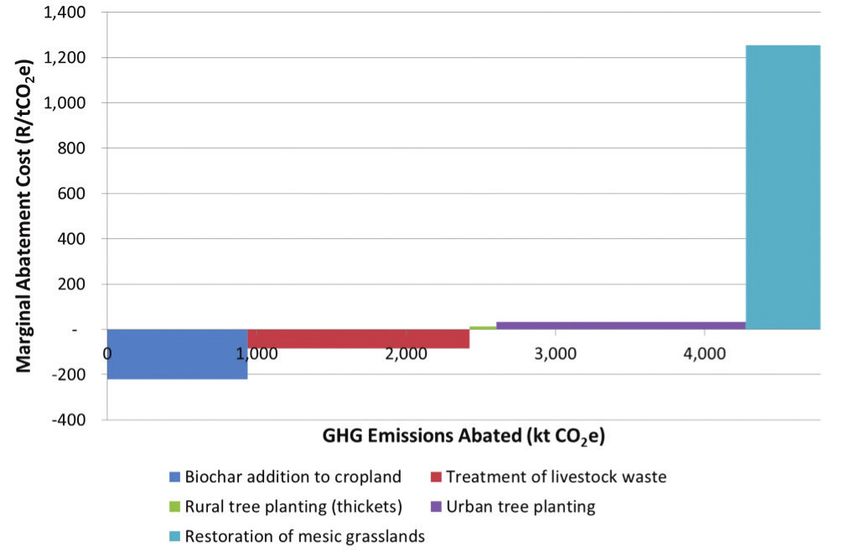
Table 1: R
           eference case projection for AFOLU: Total of all GHG emissions

  CO2 equivalents (kt/yr)                                         2000        2010        2020       2030        2040         2050
  A. Enteric fermentation                                         33,274       30,819     29,199     28,118      27,573       27,306
  B. Manure management                                              2,135       2,297      2,784       3,107       3,363        3,578
  C. Forest land – carbon sequestration*
  D. Cropland – carbon sequestration
  I. GHG emissions from biomass burning                             1,969       1,772      1,861       1,858       1,856        1,853
  D2. Cropland – direct N2O emissions                             15,150       15,150     15,150     15,150      15,150       15,150
  M. Indirect N2O emissions from managed soils                      4,273       4,273      4,273       4,273       4,273        4,273
  Total                                                           56,801      54 311      53,268     52,506      52,216       52,159
  * Forest land is taken here to include both natural and commercial forests. As stated above, there is not sufficient evidence to be
     able to predict a change in either case so no sequestration is provided for (positive or negative). Further research is needed
     in the future to better understand this.

 It is evident from this analysis that there are gaps in the                 is too limited to make projections. Further research is
 data primarily associated with the trends relating to car-                  needed and, to a large extent, will be covered by the
 bon sources and sinks. This applies to forestry where, in                   DEA ‘Sources and Sinks’ study. Further research is also
 the case of commercial forests, the situation is considered                 required to improve the understanding of trends for N2O
 to be stable, as mentioned earlier in this document. In                     emissions which are assumed as constant in the analysis
 the case of cropland the data on carbon sequestration                       summarised above.

TECHNICAL APPENDIX G – AGRICULTURE , FORESTRY AND OTHER L AND USE (AFOLU) SECTOR                                                     3
3. Identification of Mitigation Measures                                    It is notable that the reasons for not including some of the
                                                                            measures relates to a lack of data/research. This is particu-
The starting point for these measures was to put together a                 larly the case with conservation agriculture and veld fire
list of possible measures for consideration, with Table 2 below             management. Research into some of the measures which are
showing the full list of mitigation measures initially identified           included as mitigation measures is also needed to improve
by the AFOLU Task Team. The applicability of these measures                 the data. Biochar addition to cropland and better data on
was then assessed by the project team and debated by the                    South African experience with digestion of manure are cases
AFOLU Task Team. The table includes a summary of the as-                    in point.
sessment of each measure with a motivation for either includ-
ing or excluding the options from the analysis.

Table 2:   List of mitigation opportunities identified by the AFOLU Task Team

                                    Abatement measure/
 Subsector                                                            Motivation for inclusion or exclusion                     Included?
                                    mitigation opportunity
                                                                  Although herd size, age and composition is a
                                                                  practical and substantial intervention, it is not
                                                                  considered an ‘additional measure’ as it is taking
                                    Livestock herd management place as part of existing measures not related to
 3A1 Enteric fermentation           (herd size, age, composition) GHG mitigation initiatives.7 Therefore this is not               No
                                    and diet quality              considered to be a mitigation option. Further,
                                                                  there is not enough evidence on the impact
                                                                  of dietary supplements to consider this as a
                                                                  mitigation measure.
                                    Reducing GHG emissions
                                    from manure management            It is assumed this is an important mitigation option,
 3A2 Manure management              systems: livestock waste          particularly as use of feedlots increases. Considered        Yes
                                    management (treatment             a genuine mitigation option.
                                    through biogas digesters)
                                                                      A practical intervention with potential for
 3B1 Forestry land remaining        Tree planting: plantation         substantial mitigation. However, due to the fact
 forestry land and land             forestry (expansion of            that water availability limits forestry expansion, this      Yes
 converted to forest land 8         plantations)                      mitigation option is analysed as a substitute for
                                                                      irrigated agriculture.
 3B1b Land converted to             Tree planting: urban tree         Practical intervention with growing interest from
                                                                                                                                   Yes
 forest land                        planting                          municipalities.
                                    Tree planting: carbon sink
 3B1b Land converted to                                               Practical intervention with experience in the
                                    projects using trees (thicket                                                                  Yes
 forest land                                                          country increasing.
                                    restoration)
                                    Restoration of degraded
 3B1-6b Land converted into                                           Long range intervention but with important
                                    lands (restoration of mesic                                                                    Yes
 other land                                                           potential benefits.
                                    grasslands)
                             Biochar or other soil                    Although insufficient evidence exists, biochar is
 3B2 Cropland remaining
                             organic amendments                       gaining international acceptance as a feasible means
 cropland and land converted                                                                                                       Yes
                             (Assuming alien vegetation               of sequestering carbon. Therefore it is considered
 into cropland
                             as a source of biochar)                  as a mitigation measure.

4
Abatement measure/
Subsector Motivation for inclusion or exclusion Included?
mitigation opportunity
While there is some contention over this the
balance of research findings indicate that the
reduction in emissions from fertilisers is small.
3C4 Direct N2O from Fertiliser use: type, dose, Further, farming practice in SA is already relatively
No
managed soils placement, timing, adjuvants well developed with limited opportunity for
substantial improvements in terms of emissions. In
any event it is difficult to measure improvements
and label them as mitigation measures.
Improved agricultural practice, specifically
conservation agriculture has been assessed.
Although conservation agriculture has many
Conservation agriculture
3B2 Cropland remaining benefits, there is not enough evidence to confirm
cropland and land converted it as a mitigation option. No
(conservation tillage and
into cropland
cropping systems)
There is no data and therefore experts agreed that
this option could not be quantified in a meaningful
way.
Energy related crops are included under cropland
3B2 Cropland, remaining
Biofuels: dedicated energy, generally. The use of crops for energy (i.e. mitigating
cropland and land converted No
crops fossil fuel emissions) is not part of the AFOLU
into cropland
sector.
Agroforestry is already well developed in South
3B1b Land converted to Tree planting: agro-forestry
Africa and there is very limited opportunity for No
forest land (trees on farms)
further gains in wood density.9
Veld fires are already fairly well managed in SA and
there is thus limited change anticipated. There are
also uncertainties relating to the aggregate benefits
3C1 Biomass burning Veld fire management of fire management. Burning has recognised No
benefits but also recognised negative impacts.
Before this can be considered as a mitigation
measure further research is needed.
This is more appropriately included in the energy
3C1 Biomass burning Residue burning No
sector.
Agreement was reached on the final mitigation opportuni- • urban tree planting
ties after correspondence and collaboration with the AFOLU
• rural tree planting (thickets)
Task Team and other experts and specialists in the field. The
final list includes: • restoration of mesic grasslands
• biochar addition to cropland.
• treatment of livestock waste
• expanding plantations
7. C
hanges in livestock numbers are considered as part of the reference case but not taken into consideration as a mitigation option (in other words
such changes will take place for economic reasons not because of climate change mitigation objectives).
8. The definition of forest land is taken to include urban trees, thickets and other forests. The definition of forests needs to be clarified by the DEA for
the future.
9. At the final AFOLU Task Team meeting, the inclusion of wind breaks for fruit orchards and vineyards was raised as a potential factor. However, the
impact was considered to be too small to merit inclusion as a mitigation measure.
TECHNICAL APPENDIX G – AGRICULTURE , FORESTRY AND OTHER L AND USE (AFOLU) SECTOR 54. Costing and Mitigation Potential of Mitigation Measures
4.1 Basis for Costing
The assumptions used for making mitigation projections and costing the intervention in each case are given in Table 3 below:
Table 3: Costing and mitigation potential of mitigation measures for the AFOLU sector
Mitigation Basis for estimating quantum of
Key data elements Key data sources
option emission mitigation
All pigs are in piggeries; Cattle in feedlots Svoboda, 2003;
Treatment during fattening stage increases at current Manure projections per animal; capital Moser et al., 1998;
of livestock rate to a maximum of 70%. Percentage of and operating costs of digesters taken Scholes pers. com.,
waste piggery and cattle feedlot waste treated from literature. 2013; Stevens pers.
with anaerobic digestion increases to 70%. comm., 2013
Since measure offsets forestry against
Current plans for 100,000 ha of new
agriculture to get water rights, assess-
forests to be implemented. In addition, a
ment of impact on agriculture required.
further 100,000 ha to be developed with
Irrigated maize assumed to be the
Expanding associated loss of water to the agricul- Everard, SAPPI &
counterfactual. Operating and capital
plantations ture sector. Assumption that irrigated Task Team member;
cost of establishing new commercial
maize production will be reduced to
forestry and irrigated maize taken
allow equivalent water to be used for
from current catchment management
commercial forestry.
studies.
Backlog estimates based on assump-
Assumption is one tree per household Data from Basil Reid
tion that low income areas do not
Urban tree with backlog made up over 20 years and based on Cosmo
have trees; literature used for carbon
planting all new urban developments to have this City, pers. comm.,
content per tree; operating costs taken
number of trees. 2013; Stoffberg, 2006
from recent experience.
Assumes thicket regeneration only
Mills, 2006 & 2013;
Rural tree possible in 800,000 ha of Eastern Cape. Area of thicket potential, planting rate,
Knipe, 2013; Powell,
planting Assumes at current planting rate (based quantity captured per annum; cost per
2009; van der Vywer,
(thickets) on STRP), 20% of this area will be plant- ha planted.
2011
ed over 40 years.
Restoration Area of mesic grassland suited for
Restoration assumed to take place only Blignaut et al., 2010;
of mesic restoration; carbon sequestration rates,
on degraded mesic grasslands. Carbutt et al., 2010
grasslands cost per hectare restored.
Carbon content per ha applied,
Biochar Assumes that only alien invasive trees will carbon production from kilns assumed,
addition to be used as feedstock. 30% of wood to be assumes applied to soil at appropriate Shackley et al. 2010
cropland used for biochar. rate, capital and operating costs of
biochar kilns taken from literature.
64.2 Marginal Abatement Cost Curves implemented, a maximum of 5,315 ktCO2e can potentially be
Marginal abatement cost curves (MACCs) provide insight mitigated in the year 2020.
into the marginal costs and associated mitigation potential
In 2030 (Figure 3), expanding plantations, the treatment of
at snapshots in time. In relation to the overall approach in
livestock waste and biochar options all have negative marginal
assessing the relative impact of mitigation measures they only
abatement costs and together mitigate an estimated 7,100
consider one criterion, cost.
ktCO2e. Restoration of mesic grasslands remains the option
In interpreting the results of the MACC in Figure 2 below, it is with the highest marginal abatement cost. In 2030, the total
notable that the expanding plantations measure not only has mitigation potential increases to 10,206 ktCO2e. However,
the lowest marginal abatement cost (cost savings estimated while these may be considered relatively easy measures to
to be -R91/tCO2e), but that it also mitigates the most emis- implement, other impacts need to be considered and are
sions (an estimated 2,400 ktCO2e). The restoration of mesic included as part of the multi-criteria analysis (MCA). This
grasslands has the highest marginal abatement cost (R480/ changes the relative priorities of these measures consider-
tCO2e), while the treatment of livestock waste mitigates the ably, specifically commercial forestry which has high negative
least emissions by 2020 (155 ktCO2e). If all the options are impacts under social and environmental criteria, for example.
Figure 2: MACC for 2020 for the AFOLU sector
TECHNICAL APPENDIX G – AGRICULTURE , FORESTRY AND OTHER L AND USE (AFOLU) SECTOR 7Figure 3: MACC for 2030 for the AFOLU sector In 2050 (Figure 4), the expansion of plantations is no longer a mitigation option since the plantations can no longer expand and the total mitigation potential of the sector drops to 4,775 ktCO2e. Rural tree planting and biochar addition to cropland contribute the most, while the mitigation potential from urban tree planting falls to 181 ktCO2e as it is assumed that planting of existing areas is largely completed and the emphasis moves to newly developed areas. The expanding plantations, treatment of livestock waste and biochar options all have negative marginal abatement costs in 2050. Figure 4: MACC for 2050 for the AFOLU sector 8
5. Projections ‘With Additional Measures’
 5.1   Technical Mitigation Potential
 If all technically available mitigation potential in the AFOLU sector was implemented, then the current analysis shows that GHG
 emissions could be reduced by 5,315 ktCO2e in 2020, 10,206 ktCO2e by 2030 and 4,775 ktCO2e by 2050. This represents a total
 potential reduction of 10%, 19% and 9% (respectively) of reference emissions under the WEM projection (Table 4).

 Table 4: Technical mitigation potential for the AFOLU sector, assuming all measures are implemented (in ktCO2e)

  Measure                                                                                2020                       2030    2050
  Urban tree planting                                                                       539                     1,016   1,671
  Treatment of livestock waste                                                              155                     1,485   1,485
  Biochar addition to cropland                                                              619                      473     939
  Restoration of mesic grasslands                                                           192                      461     499
  Rural tree planting (thickets)                                                         1,392                      1,532    181
  Expanding plantations                                                                 2,418                   5,240          0
  TOTAL                                                                                  5,315                 10,206       4,775
  TOTAL % Reduction (relative to WEM)                                                  10.0%                   19.4%        9.2%

 5.2   The ‘With Additional Measures’ Projection
 Applying all the measures identified above in the order in which they are ranked using the MCA, gives an emissions projection
 curve as shown in Figure 5.

 Figure 5: E
            missions projections with all additional measures (WAM) for the AFOLU sector

TECHNICAL APPENDIX G – AGRICULTURE , FORESTRY AND OTHER L AND USE (AFOLU) SECTOR                                                9
6. Impact Assessment of Individual A quantitative assessment using the costs estimated for each
Mitigation Measures measure and the economic models which provide figures for
gross value added (GVA) (the economic criterion) and jobs
The impact assessment is undertaken using the multi-criteria (part of the social criterion).
analysis (MCA) approach described in Section 12 of the Main
Report and in Technical Appendix A: Methodology. A qualitative assessment based on scoring by the Sector Task
Team.
6.1 Scoring of Each Measure in Relation to Agreed Criteria
In the case of the quantitative analysis which informs the cost,
The criteria for assessing each measure are applied consis- economic and social criteria, the data associated with each
tently across all sectors with the scoring and weighting op- criterion is summarised in Table 5 below.
tions described in the Main Report. Two methods have been
applied for scoring:
Table 5: Q
uantitative data informing the scoring of mitigation options for the AFOLU sector
NPV* of costs GVA** impact Jobs created per
Ratio of unskilled
per ktCO2e per ktCO2e ktCO2e
to total jobs
mitigated mitigated mitigated
R/ktCO2e R/ktCO2e Jobs/ktCO2e
Expanding plantations -1.84 3.09 0.02 0.34
Biochar addition to cropland 12.46 -0.29 0.00 1.37
Treatment of livestock waste 45.16 -2.11 1.12 0.71
Rural tree planting (thickets) 3.03 -0.33 0.24 0.73
Urban tree planting 11.56 -1.25 0.35 0.76
Restoration of mesic grasslands 293.22 -31.70 3.32 0.76
* net present value
** gross value added
Taking both quantitative and qualitative scores into consideration for each criterion, points are allocated to each measure with the
results for the ‘base scenario’ shown in Table 6 below (zero is the worst result and 100 the best).
Table 6: Distribution of points assigned to each option for the AFOLU sector
Economic Social Non-GHG
Option descriptions Cost Implementability
impact impact environmental impact
Expanding plantations 66.71 57.86 20.64 15.00 77.50
Biochar addition to cropland 63.48 52.23 36.94 95.00 50.00
Treatment of livestock waste 56.08 49.21 61.35 60.00 77.50
Rural tree planting (thickets) 65.61 52.17 56.72 95.00 85.00
Urban tree planting 63.68 50.63 83.46 75.00 100.00
Restoration of mesic grasslands 0.00 0.00 75.51 95.00 85.00
10In comparing these results it is evident that, at the one ex- 6.2 Net Benefit Curve
treme, expanding commercial forests has the lowest marginal The concept of net benefit is described in Section 12 of the
abatement cost (forestry is a commercially viable business Main Report. In the case of the ‘balanced weighting’ scenario
and hence also has a positive economic impact) and easy to the net benefit curve is shown in Figure 6 below:
implement (forestry is an established business in SA). How-
ever, forestry scores low on social impact (also in relation The amount of CO2e which can be mitigated for each mea-
to agriculture it displaces) and low on environmental impact sure, for the full period from 2010 to 2050, is shown on the
(uses large amounts of water, reduces biodiversity). horizontal axis. In order to maximise the net benefit (as deter-
mined by the MCA analysis), the measures should be imple-
Almost all of the other measures score high for environmen- mented in order from left to right as they appear in Figure 6.
tal impact but they are all costly. Biochar is a new measure
which has yet to be applied in SA at scale. As conceived for According to the graph, urban tree planting should be imple-
this project, with the biomass feedstock coming from invasive mented first since it achieves the highest integrated net mar-
aliens, it will be difficult to implement and costly. ginal benefit score of 75.8 and mitigates a total of 20 MtCO2e
over the 40 year period. Rural tree planting (thicket resto-
Restoration of mesic grasslands is also a high-cost measure, ration) has an overall weighted score of 71 and mitigates the
with negative economic impact as a consequence. Nonethe- second highest amount of emissions (57 MtCO2e) over the
less, the measure does create jobs, particularly low-skilled period. Although the expansion of plantations mitigates the
jobs. The measure also scores relatively highly for non-GHG highest amount of emissions (81 MtCO2e), it attains the lowest
environmental impacts and implementability. overall weighted score of 46 as shown on the graph below.
Although the restoration of mesic grasslands has high social
and environmental benefits, the option is associated with high
costs and therefore only attains a weighted score of 53.
Figure 6: Net benefit curve for the balanced weighting scenario for the AFOLU sector
TECHNICAL APPENDIX G – AGRICULTURE , FORESTRY AND OTHER L AND USE (AFOLU) SECTOR 11References
Archibald S, 2013: Personal communication, meetings on Moser M, Mattocks R, Gettier S & Roos K, 1998: Benefits,
16 January, 17 April 2013, email correspondence and data costs and operating experience at seven new agricultural
received, 14 and 15 February, 4 March. anaerobic digesters. Presented at BioEnergy, Expanding
Bioenergy Partnerships, Madison, Wisconsin 4–8 October.
Basil Reid, 2013: Personal communication, discussions
regarding Cosmo City, February 2013. Powell M, 2009: Subtropical Thicket Restoration
Programme (STRP), the Working-for-Woodlands
Blignaut J, Mander M, Schulze R, Horan M, Dickens C, Programme. Presentation, Kirstenbosch, 12 October 2009.
Pringle C, Mavundla K, Mahlangu I, Wilson A, McKenzie M
& McKean S, 2010: Restoring and managing natural capital Scholes B, 2013: Systems ecologist fellow at CSIR, personal
towards fostering economic development: Evidence from communication, meetings on 16 January, 11 March and
the Drakensberg, South Africa. Ecological Economics 69, 6: 17 April.
1313–1323.
SA Feedlot Association, 2013: Personal communication,
Carbutt A, Tau M, Stephens A & Escott B, 2011: Dave Ford executive director of SA Feedlot Association,
The conservation status of temperate grasslands in email correspondence 14 and 15 February, 8 April.
Southern Africa. The Grasslands Society of Southern
Africa 11,1:17–23. Shackley SJ and Sohi SP (eds) 2010. An assessment of
the benefits and issues associated with the application of
Department of Agriculture, Forestry and Fisheries (DAFF), biochar to soil. Department for Environment, Food and
2012: Abstract of Agricultural Statistics, 2012. Pretoria, DAFF. Rural Affairs, London, UK
Department of Environmental Affairs (DEA), 2013: Stevens, L., 2013: Personal communication, meetings on
GHG Inventory for South Africa, 2000–2010 (Draft), 16, 17 & 24 January, 12 April, 17 April, University of the
Pretoria, DEA. Witwatersrand.
Everard D, 2012: Division Environmental Manager, Sappi Stoffberg G, 2006, Growth and carbon sequestration by
Forests & Task Team member, email correspondence, street trees in the City of Tshwane, South Africa, PhD
10 & 14 April. thesis, University of Pretoria, Pretoria. Available at: http://
upetd.up.ac.za/thesis/available/etd-03192010-193526/
Knipe A, 2013: Area Manager of DEA spekboom projects,
personal communication, email correspondence 10 April 2013. Svoboda, F., 2003: Anaerobic digestion, storage, oligolysis,
lime, heat and aerobic treatment of livestock manures.
McCarl B, Peacocke C, Chrisman R, Kung C, & Sands R, Final Report: Provision of research and design of pilot
2009: Economics of biochar production, utilisation and schemes to minimise livestock pollution to the water
emissions. In Lehman J & Joseph S, (eds.) Biochar for environment in Scotland, FEC Services Ltd, Kenilworth,
Environmental Management. London, Earthscan. Warwickshire.
Mills A & Cowling R, 2006: Rate of carbon sequestration Van der Vyver, M.L., 2011: Restoring the biodiversity of
at two thicket restoration sites in the Eastern Cape, South canopy species within degraded spekboom thicket. Msc
Africa. Restoration Ecology 14,1:38–49. thesis, Nelson Mandela Metropolitan University.
Mills A, 2013: Soil carbon on the international market:
triggering changes in land use? Presentation at Soil Carbon
Day, Stellenbosch University, 15 February 2013.
12Department of Environmental Affairs
Environment House,
473 Steve Biko,
Arcadia,
Pretoria, 0083
South Africa
www.environment.gov.za
Deutsche Gesellschaft fuer Internationale Zusammenarbeit (GIZ) GmbH
Hatfield Gardens, Block C, Groundfloor
333 Grosvenor Street
Hatfield 0028
Pretoria, South Africa
www.giz.de
First publication in 2014
Copyright © 2014 Department of Environmental Affairs (DEA) / GIZ
Pretoria, South Africa
S-1566 • www.studio112.co.zaYou can also read