ADDIS ABABA CITY (2021 to 2025) - AIR QUALITY MANAGEMENT PLAN - US ...
←
→
Page content transcription
If your browser does not render page correctly, please read the page content below
ADDIS ABABA CITY
AIR QUALITY MANAGEMENT PLAN
     (2021 to 2025)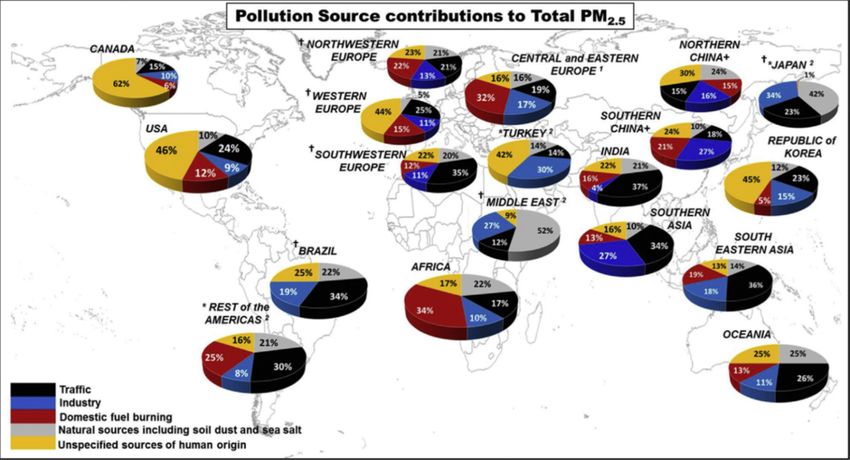
Acknowledgements

This document was developed under a partnership between the Addis Ababa Environmental
Protection and Green Development Commission, with support from the United States
Environmental Protection Agency, the United States Embassy in Addis Ababa and     UN
Environment.
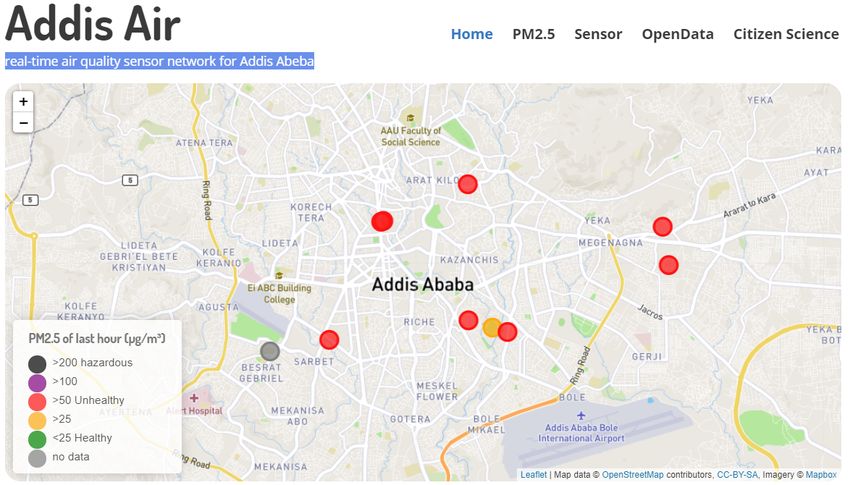
TABLE OF CONTENTS

TABLE OF CONTENTS
Table of Contents ...................................................................................................................................................... 3
Forward Message...................................................................................................................................................... 4
Executive Summary ................................................................................................................................................. 6
1.        Introduction and Background of Air Quality in Addis Ababa .................................................... 8
2.        AQMP Development Process ................................................................................................................ 12
3.        Summary of Baseline Air Quality Characterization .................................................................... 15
3.1    Emission sources .......................................................................................................................... 15
3.2    Expected emissions trends .......................................................................................................... 21
3.3    Ambient air quality ...................................................................................................................... 22
3.4 Health implications of the baseline air quality scenario..................................................................... 30
3.5    Capacity assessment .................................................................................................................... 38

4.        Gaps and Issues .......................................................................................................................................... 41
4.1           Enhancing AQ monitoring capabilities ......................................................................................... 41
4.2           Improve emissions inventories .................................................................................................... 42
4.3           Improve access to laboratory facilities ........................................................................................ 43
4.4           Improve national-city cooperation .............................................................................................. 43
4.5           Enhance education and outreach on air pollution issues ............................................................ 43

5.        Overall Objective and Goals of the AQMP ....................................................................................... 44
6.        Implementation Plan ............................................................................................................................... 45
7.        Monitoring and Evaluation.................................................................................................................... 56
FORWARD MESSAGE

   MAYOR ADANECH ABIBEBIE

Air pollution is the most significant environmental contributor to premature death across Africa, outpacing deaths
from malaria and HIV. We know that levels of harmful air pollutants are too high and present an unacceptable health
burden on the people who make Addis Ababa their home. We also know that this health burden has real economic
implications for the city and the nation as a whole. Health effects associated with air pollution limit healthy time
that could be available for work or school and present a direct social and economic cost for healthcare to treat
asthma, serious respiratory symptoms, and many other health effects, including premature death.
     Through recent cooperation with the U.S. under their Megacity Partnership, local experts have calculated that
our city experienced 2,700 premature deaths in 2017 from this level of pollution in our city. With no action, this will
grow to 6,000 premature deaths by 2025. And we know that it’s not just premature death, air pollution impacts
everyone’s quality of life and has many other health consequences that will only get worse if we do not take action.
     I want to assure you that we can tackle this challenge together while also sustaining rapid economic growth.
The idea that environmental needs counter our economic or development needs is a false choice. Advances in
environmental standards can improve economic performance. In fact, without action we can anticipate harm to
both health and economic development.
     So, what can we do? To address this serious challenge, today I am launching an Air Quality Management Plan
for the city of Addis Ababa. This plan offers a vision for our city’s future that includes blue skies and cleaner air than
we have today. Action is supported by the data from the U.S. monitors and satellite data to make a compelling case
that the time to act is now. The plan also includes strategies for a rapidly expanding network of air quality sensors
and other local data, as well as specific actions to reduce emissions.
     When implemented by partners across local and federal government, the private sector and academia, this plan
will help us realize the following types of air pollution reduction strategies: reduce open burning, create vehicle
emissions standards, improve vehicle emissions testing and enforcement, create stronger standards for fuel quality
with an emphasis on decreasing the concentration of sulfur in our diesel fuel, and expand of our air quality
monitoring abilities to evaluate change over time. We cannot solve this problem overnight, but by launching this
plan, I am committing to take the steps needed to clean our air and improve the health for all our residents.
     The good news is that we also have support from the international community to begin to take immediate action
to implement the objectives and activities outlined in the AQMP. The U.S. government support includes the U.S.
Environmental Protection Agency, the State Department, NASA, and USAID. They will work in close collaboration
with UNEP, C40, WRI, the World Bank, Vital Strategies, and Addis Ababa University’s GeoHealth Hub along with
committed representatives from the EFCCC, MoT, MoH, under the leadership of the EPGDC. I will ask the EPGDC
Commissioner to chair a steering committee to coordinate the growing efforts to improve air quality in our city.
Together, we can and must make progress.
    We have seen rapid growth in the number of air quality sensors in the city and will have much better data for
future monitoring and action. However, there is no need to wait for perfect data to know that the air we breathe is
unhealthy and people are dying from it. This AQMP includes plans for concrete steps to reduce emissions, not just
measure them. We can look at large developing cities around the world to know that the air will get much worse
without concrete action today to slow down the rate of emissions growth. In doing so, we can save lives, improve
worker productivity with fewer sick days, improve our tourist revenues, and make Addis Ababa a city the “New
Flower” that its name embodies.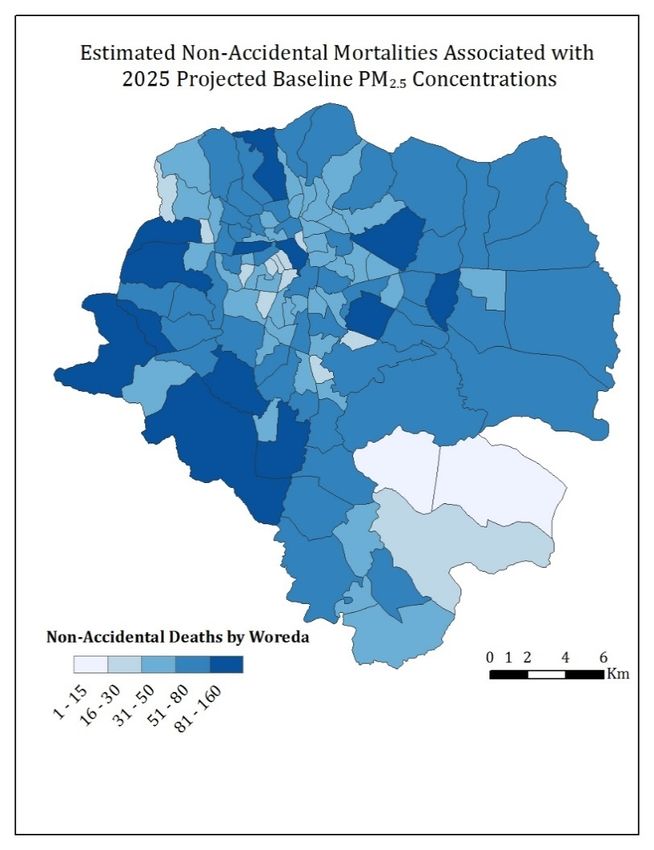
EXECUTIVE SUMMARY
Indoor and outdoor pollution are currently the most significant environmental contributors to premature
death in Africa, outpacing that of malaria and HIV. Yet for many African governments, addressing air
pollution has only recently become a key public health concern. According to present knowledge, one in
nine of today’s global deaths is a result of exposure to air pollution - either (outdoor) ambient air pollution
(AAP) or (indoor) household air pollution (WHO (2018a, 2018b), jointly causing an estimated 8 million
deaths per year. The State of Global Air 2020 indicates that air pollution was the fourth leading risk factor
for premature death in 2019 (Health Effects Institute, 2020). Without multi-pronged action, the growing
rural-urban migration and increase in population being experienced in Ethiopia, and in Addis Ababa in
particular, is likely to outpace and challenge the already inadequate infrastructure that exists to manage
air pollution.

Ethiopia’s first Air Quality Management Plan (AQMP) focuses on the Addis Ababa region for three reasons:
    • Current conditions, as characterized by available ambient particulate matter data from air quality monitor
         readings and satellite data, present an unacceptable health burden for the population of Addis Ababa.
         Ambient concentration levels are estimated to be at least 2-3 times both the Ethiopian standard and WHO
         guidelines for air quality.
    • The health burden associated with high PM2.5 concentrations has clear economic implications for Addis
         Ababa and the nation as a whole. Health effects associated with PM2.5 limit healthy time that could be
         available for work or school and present a direct social and economic cost for healthcare to treat asthma,
         serious respiratory symptoms, and many other health effects.
    • Without action, economic and population growth is very likely to lead to higher air pollutant emissions in
         the vehicular, household and commercial open burning, and industrial sectors, which will worsen air
         quality over time. When implemented, this AQMP can reverse harmful emissions trends.

Common sources of ambient air pollution in Addis Ababa include vehicle emissions from fuel-inefficient,
aging vehicles, incomplete combustion from diesel vehicles, unpaved roads, industrial sources, and
construction. Other sources include household cooking and heating, open burning of solid waste, and
transport of pollution from industrial areas outside of Addis Ababa. The health burden of these emissions
is considerable. In the Addis Ababa Region, a multi-agency air quality management workgroup estimates
that in 2017, 2,700 lives were prematurely lost due to the effects of air pollution, or about 21% of all non-
                                                        1
accidental deaths in the 25- to 99-year-old age group . Without action to control air pollution, by 2025
this figure is estimated to rise to 6,200 and account for 32% of deaths in this age group. Meeting existing
Ethiopian ambient air quality standards can reduce those deaths by more than 75%. Additional negative
health outcomes associated with air pollution, such as premature mortality among youth and children,
asthma cases and missed school and work days, can also be reduced.

1
 This is the age range for which data is available. Impacts are also expected in younger ages, but estimates are not
available.
The Addis Ababa Environmental Protection and Green Development Commission (AAEPGDC) and other
partners developed this comprehensive AQMP for the Addis Ababa Region as the next step in addressing
these problems. Key features of this plan include:

    •   Baseline air quality characterization and projected emission trends
    •   Health burden estimates
    •   Institutional commitment to updating and enforcing source-specific and ambient air quality
        standards
    •   Efforts to augment and standardize the air quality monitoring network
    •   A detailed AQMP implementation plan

The AAEPGDC expects to update this plan again in five years to take advantage of new knowledge, new technologies,
and continually work to improve the public health of those who live, work and play in Addis Ababa.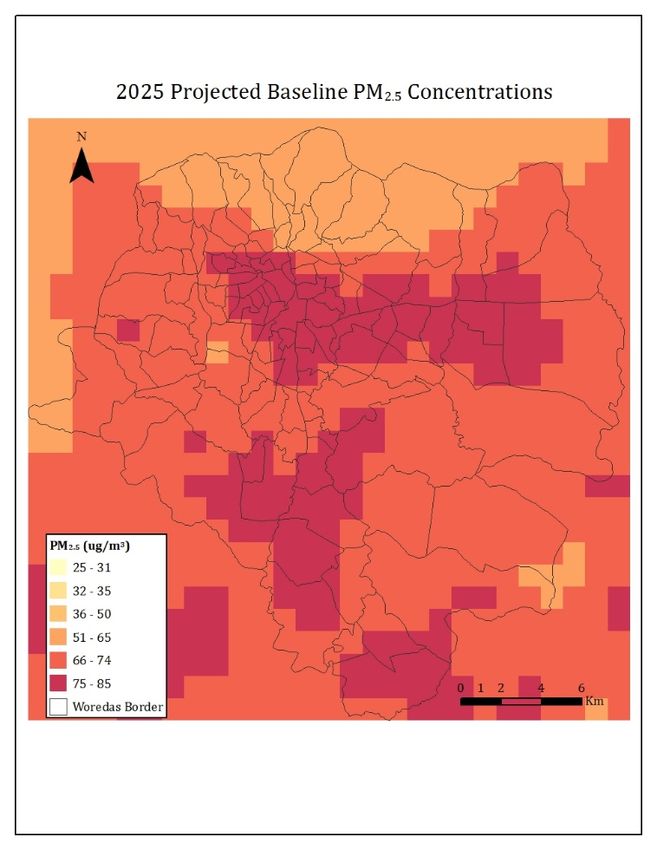
1. INTRODUCTION AND BACKGROUND OF AIR QUALITY IN ADDIS ABABA
As Addis Ababa grows both economically and spatially, air pollution from vehicle emissions, residential combustion,
open burning of waste, and other sources is an increasing health concern in the metropolitan area. The legal basis
for air quality management and general environmental policy is included in the Ethiopian Constitution, which
ensures that every citizen has the right to a clean environment and that the government will prevent environmental
pollution and the associated negative health effects (Tefera et al., 2014). Proclamation 295/2002 furthers the
constitutional right of environmental protection by establishing a federal, independent, environmental protection
authority (now the Environmental Forestry and Climate Change Commission, EFCCC), the Environmental Council,
who provide high-level oversight of regulation, policy, and environmental standards (Tefera et al., 2014), and
regional environmental protection authorities located in Addis Ababa and Dire Dawa (Addis Ababa Institute of
Technology, 2012). This Air Quality Management Plan (AQMP) is an important step toward providing the clean and
healthy environment necessary for Addis Ababa city and its residents to develop, grow, and prosper.

Under the Environmental Pollution Control Law, the EFCCC is responsible for setting environmental standards and
enforcing compliance with the standards (Tefera et al., 2014). Other relevant agencies with jurisdiction over air
quality management include:
    • federal Ministry of Transport and Addis Ababa Transport Authority, which are responsible for monitoring
         and enforcement of emissions from mobile sources and collection and maintenance of statistics on the
         vehicle fleet,
    • National Meteorological Agency, which is responsible for collecting, managing, and disseminating
         meteorological and air quality monitoring data,
    • Ministry of Health, which has a Hygiene and Environmental Health Directorate that includes case teams
         focused on water quality, food sanitation, and air/climate. They rely predominantly on Health Extension
         Workers at the grassroots level for outreach, preventative health tips, and education of the population
         (Tefera et al., 2014). The Ministry of Health adopted a national framework for climate resilience (FMOH
         2014).
    • Addis Ababa City Administration Health Bureau, which has created the structure of the Environmental
         Health Department, including structure at the sub-city and woreda level where Environmental Health
         Professionals engage on environment-related activities. In addition, the Urban Health Extension is designed
         to raise awareness of the health risks including air pollution and empowerment of women and children,
         who experience the highest levels of exposure in their communities. Because the Environmental Health
         Program is yet adequately supported and lacks concrete evidence to confirm air pollution (Indoor and
         outdoor) associated health effects, policy decisions must rely on incomplete information.
    • At the city level, the authority and responsibility to maintain a healthy and clean environment within the
         region of Addis Ababa city is formally held by the Addis Ababa Environmental Protection and Green
         Development Commission (AAEPGDC).
    • In addition, the Solid Waste Management Agency, the Addis Ababa Planning and Development Commission,
         and the City and Federal Transportation Ministry can play particularly constructive roles in addressing air
         pollution.

Ethiopia has established national ambient air quality standards for various pollutants, including fine particulate
matter (PM2.5). PM2.5 is an inhalable mixture of solid and liquid particles present in the air that measure less than 2.5
microns in diameter. There is significant evidence of the relationship between exposure to PM2.5 and harmful human
health impacts, as PM2.5 is associated with the greatest proportion of adverse health impacts related to air pollution
worldwide. Ethiopia’s national standards were created with reference to World Health Organization (WHO) guideline
                                                                                     3
target. WHO suggests annual average PM2.5 concentrations not exceed 10 µg/m , though maintains interim targets
to allow stepwise achievements in air quality management. These interim targets are meant to help countries to
develop their own air quality management standards progressively and demonstrate improvement over time.

                                                                                                                       8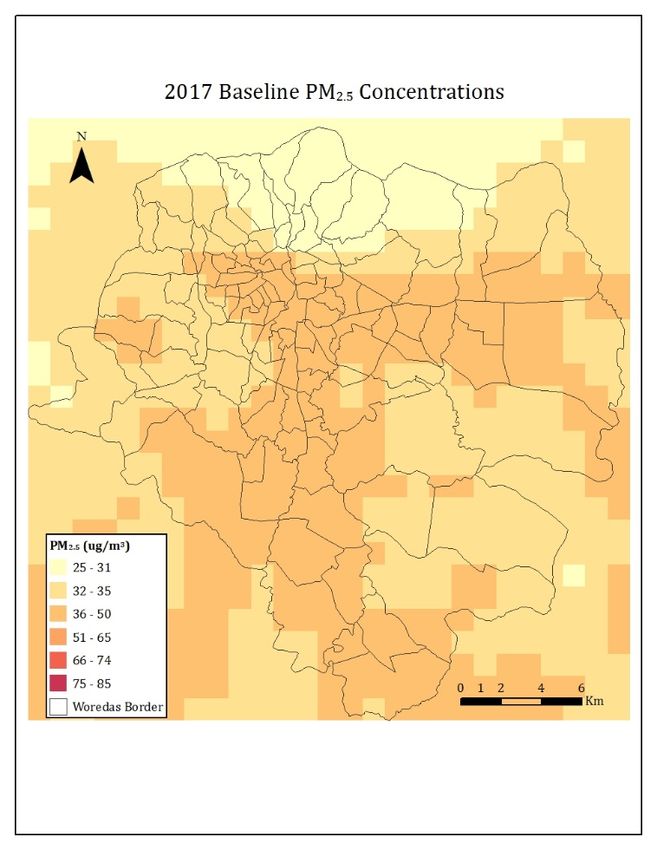
At the time of developing Ethiopian standards in 2003, there were no national baseline air quality data available.
                                                                                                             3
Ethiopian standards were set between WHO interim targets 1 (annual average PM2.5 concentration 35 µg/m ) and 2
                                               3
(annual average PM2.5 concentration 25 µg/m ). According to Environmental Pollution Control Proclamation No.
300/2002 section 6 (4) Ethiopian law establishes the right for regional environmental protection authorities, such as
the AAEPGDC, to set more stringent ambient and emissions standards than the national standards if they so choose,
but the national standards establish a minimum stringency level for all parts of Ethiopia.

In Addis Ababa, both mobile (vehicle) and point (mostly industrial) emission sources contribute to carbon monoxide
(CO), nitrogen oxides (NOx), ozone (O3), sulfur dioxide (SO2), coarse particulate matter (PM10), and PM2.5 pollution in
                       2
the metropolitan area. The main sources of ambient air pollution in the city are
     • Vehicle emissions from fuel-inefficient aging vehicles,
     • incomplete combustion from diesel vehicles,
     • Dust from unpaved roads,
     • Open burning of trash,
     • Home heating and cooking using biomass, and
     • Industrial sources.
Plans outlined in Ethiopia’s Growth Transformation Plan Part One (GTPI) and Part Two (GTPII) illustrate Ethiopia’s
commitment to developing national, renewable energy sources for electricity generation (mainly hydropower, but
also geothermal) and replacing vehicles with light rail transit and bus rapid transit systems within the city. Overall,
the infrastructure projects undertaken show a significant push towards improving the efficiency and low- to no-
emission components of the transport and energy sectors, which will help reduce the burden of air pollution in Addis
Ababa.

In addition, despite an aging vehicle fleet, there are several policies in place and currently being drafted under the
Climate Resilient Green Economy (CRGE) and Global Fuel Economy Initiative (GFEI) regarding vehicles standards. The
CRGE is drafting vehicular emission standards for emissions and promoting fuel blends of ethanol, gasoline, and
biodiesel through the EFCCC. Using blended fuel will reduce the country’s reliance on imported fuel with high sulfur
content from Sudan (other fuels are imported from Saudi Arabia and Kuwait.) Currently, every car in Ethiopia must
undergo an annual inspection to ensure the vehicle meets safety standards. There are standards for vehicle exhaust
emissions limits for smoke and CO, established by the Ethiopian government under the EFCCC and codified within
the Transport Authority to measure compliance (Addis Ababa Institute of Technology, 2012). However, vehicle
emissions enforcement is not yet happening. Recently, EFCCC altered the federal tax on vehicle imports to reduce
the incentives to import older vehicles and reduce the disincentive to import newer, more fuel-efficient and cleaner
vehicles. Addis Ababa city banned commercial vehicles during daylight hours and banned motorcycles from city
streets in an effort to reduce congestion and improve fuel-efficiency. Other measures to control vehicle emissions
and update the vehicle fleet are also being considered as part of this AQMP.

Ethiopia’s standards for industrial pollution control were developed by the federal EPA in 2003 based on
international best practice. At that time there were no national baseline data to guide the development of national
targets. The standards require refreshing based on current national and city level air quality status as well as air
quality goals. A source apportionment study conducted in 2004 concluded that between 35 and65% of PM10 in Addis
Ababa was geologic in origin, with unpaved roads as the main source (Etyemezian et al., 2005). With an increasing
number of vehicles on the road and a large unpaved road network, the concentration of suspended dust particles
from unpaved roads could increase, though efforts over the past decade to pave roads within Addis Ababa city show
promise in this area. Another potential area of concern is emissions from construction activity.

2
 Given its important relationship with harmful human health impacts, this AQMP focuses specifically on analysis of
and efforts to control PM2.5 in the city of Addis Ababa.

                                                                                                                     9
Open burning of waste is a common problem in Addis Ababa. Some studies have suggested that that nearly 55
percent of the population in Addis Ababa use open burning as their primary means of waste disposal, a figure slightly
higher than the overall national average of the population using open burning as their primary waste disposal means
(Cheever 2011).
Efforts to monitor and manage air pollution emissions, both prior to this AQMP and ongoing, have had an impact on
air quality, but significant gaps remain and further progress is expected. To bridge these gaps, the AAEPGDC has
developed this draft AQMP, in conjunction with other federal and city authorities, to address air quality within Addis
Ababa.
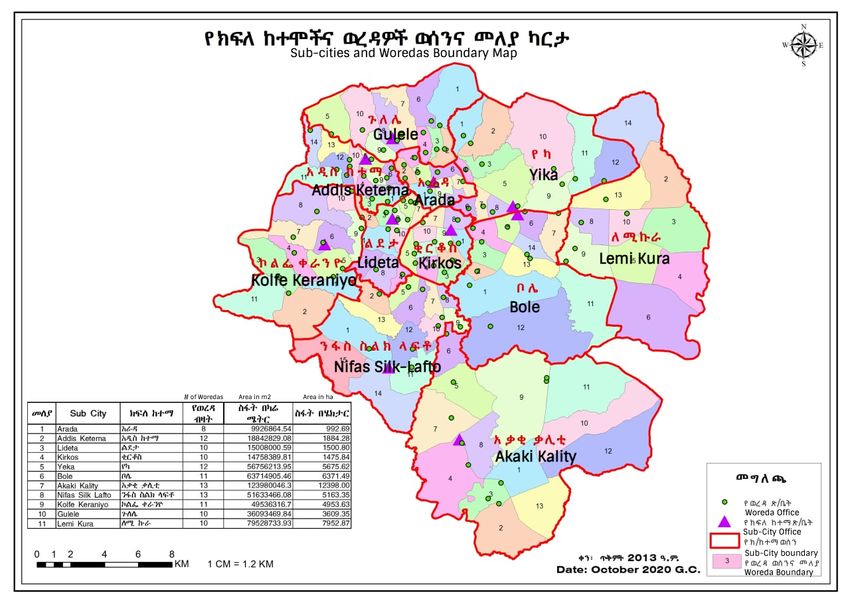
FIGURE 1-1: ADDIS ABABA MAP
The goal of the plan is to reduce the concentration of hazardous fine particulate matter (PM2.5) in the Addis Ababa
region to a level that is in compliance with the national air quality standard. This first AQMP has been developed by
AAEPGDC in collaboration with the United States Environmental Protection Agency (USEPA) to take advantage of
USEPA’s significant and broad experience in air quality management.
Ethiopia’s first AQMP focuses on the Addis Ababa region for three reasons:
• Current conditions, as characterized by available ambient fine particulate matter data from air quality
monitor readings and satellite data, present an unacceptable health burden for the population of Addis
Ababa. Current PM2.5 concentrations are not in line with international standards for air quality.
• The health burden associated with high PM2.5 concentrations has clear economic implications for Addis
Ababa and the nation. Health effects associated with PM2.5 limit healthy time that could be available for
work or school and present a direct social and economic cost for healthcare.
• Without action, economic growth is very likely to lead to higher emissions in the vehicular, household and
commercial open burning, and industrial sectors, which will worsen air quality over time.
10The focus of the AQMP is ambient particulate matter (PM) pollution in Addis Ababa. PM pollution is classified by the
size of the particles—PM10 stands for particulate matter comprised of particles less than 10 microns in diameter and
PM2.5 refers to fine particulate matter comprised of particles less than 2.5 microns in diameter. The length of
exposure and particle size a person is exposed to can cause differential health impacts; for example, PM2.5 penetrates
more deeply into the lungs and has been found to have greater toxicity at lower exposure levels than PM10. Similarly,
the impacts of long-term, chronic exposure to particles can differ from the impacts of exposures occurring within
the course of a single day. Therefore, ambient air quality standards include different standards for PM10 versus PM2.5
and daily versus annual exposure times. As noted in Section 1, this AQMP focuses on PM2.5 specifically
112. AQMP DEVELOPMENT PROCESS
Section 2 of this AQMP provides an overview of the various processes that contributed to its development. More
details are provided within each subsection.
2.1 STAKEHOLDER ENGAGEMENT IN THE AQMP DEVELOPMENT PROCESS
The USEPA and United Nations Environment Programme (UN Environment) worked together to support AAEPGDC
in the development of actionable air quality management policies beginning in early 2018. Stakeholder buy-in is a
3
critical part of any air quality management planning process. The Megacities Partnership was launched by the U.S.
4
Ambassador, the Ethiopian EFCCC and UN Environment. Stakeholders engaged in these events included:
• Addis Ababa Transport Authority
• Addis Ababa University
• National Meteorological Agency
• Kotebe Metropolitan University
• Addis Ababa City Administration Health Bureau
• National Ministry of Health
• National Ministry of Transport
• World Bank
• Addis Ababa Driver & Vehicle Licensing & Control Authority
• Population, Health and Environment Consortium
These same stakeholders reconvened in November 2018 and again in June 2019 to continue training and to build
expertise in the application of the BenMAP-CE tool, air quality management planning, and communication and public
involvement strategies.
3
The first event was organized by UN Environment on May 3, 2018. This inception workshop was designed to assess
the recent, on-going and planned air quality related work in Addis Ababa. At that time, UN Environment also
presented an outline of their planned situational analysis.
4
This first workshop was followed by a joint USEPA-UN Environment training workshop in September 2018 that
included a formal launch of the Megacities Partnership. The launch event included participation by a number of
senior officials, press and interested members of the public. The workshop was a more detailed training event
designed to build capacity within Addis Ababa to apply tools and analysis and motivate action to address air
pollution. Participants learned about the current state of air quality and relevant policies, the basics of air quality
management and how to design and analyze AQM strategies and policies that can improve public health. In addition,
a small group of technical staff gained familiarity with both source apportionment techniques using USEPA’s Positive
Matrix Factorization (PMF) software; and AQMP benefits analyses using USEPA’s Environmental Benefits and
Mapping Analysis Program – Community Edition (BenMAP-CE) tool.
12While these stakeholders received detailed training in components of AQM planning, the AAEPGDC aimed to receive
additional input from external experts in the form of a Clean Air Advisory Committee. The institutions represented
by members of the Advisory Committee were:
1) Said Abdella, Addis Ababa Environmental Protection and Green Development Commission
2) Gutema Moroda, Addis Ababa Environmental Protection and Green Development Commission
3) Hirut Jifara Abdi , Ministry of Health
4) Berhanu Assefa, Addis Ababa University
5) Gezahegn Bekele, National Meteorology Agency
6) Tadesse Weyuma, Kotebe University
7) Abera Kumie, Addis Ababa University/GeoHealth Hub
8) Ahmed Mohammed, PHEEC (NGO)
9) Girma Samuel, AA Transport Authority
10) Yehalem Tesera, Driver and Vehicle Licensing Control Authority
The Advisory Committee meetings were conducted as part of each USEPA mission and were chaired by AAEPGDC.
They received report-outs from the individual trainings and also provided feedback on the interim products
developed under the Partnership, including the inception report and workplan.
2.2 STATUS OF THE MONITORING NETWORK OR OTHER DATA SOURCES
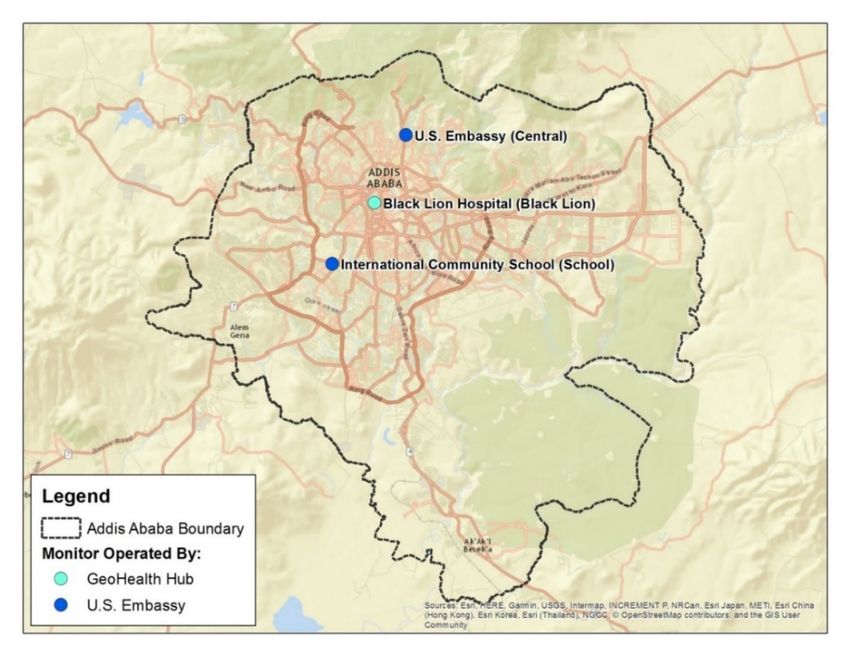
To measure air quality, there are currently three PM2.5 air quality monitors in Addis Ababa—one maintained by Addis
5
Ababa University through their work with the East Africa GeoHealth Hub (though), and two maintained by the
6
United States Embassy (which are publicly available through the AirNow-International program). The Addis Ababa
University PM2.5 monitor is located at the College of Health Sciences at the Black Lion Hospital and the US Embassy
monitors are at the US Embassy and the Addis Ababa International Community School, respectively. When combined
with recently published estimates based on remote sensing data from satellite sources, these monitors provide a
broad picture of the most and least polluted areas of Addis Ababa. This initial snapshot of the air quality surface
provides sufficient rationale for actions set forth in this AQMP; however, it is worth emphasizing that ground-level
measurements are not routinely collected for much of the city. Expansion of monitoring will enable city officials to
refine air quality estimates and better identify highly exposed populations. Future improvements to this AQMP will
include important pollutants other than PM2.5, including ozone, nitrogen oxides, carbon monoxide, sulfur dioxide,
and others.
The Megacities Partnership currently underway in Addis Ababa includes expansion of monitoring at more sites
throughout Addis using low-cost sensor technology. As of April 2021, UN Environment has deployed 5 low cost
sensors across the city to measure PM2.5. AAEPGDC is analyzing some of the data generated through these sensors.
For sustainable delivery of information, the staff needs to be strengthened around calibration, data analysis and
maintenance of the sensors. Part of that deployment includes a calibration period where low-cost sensors are co-
located with a reference grade monitor such as those at the U.S. Embassy or Black Lion Hospital to help identify and
5
These data are not publicly available and have not been shared with EPGDC or Megacities Partnership project
partners.
6
Data are publicly available through the US AirNow-International program at
https://www.airnow.gov/international/us-embassies-and-consulates/#Ethiopia$Addis_Ababa_School
13correct for any persistent bias in the low-cost sensor measurements. Furthermore, a citizen science civil society
group Menged Lesew and Addis Air have established a network of 9 low-cost optical sensors visible at addisair.org.
While the deployment of these devices is a valuable first step towards improving the mapping of air quality in Addis
Ababa, planning for the future air quality monitoring network in Addis Ababa will likely require a mix of technologies
to produce comprehensive and reliable real-time air quality measurements.
2.3 AQMP Development: Analytic Steps
This AQMP has been developed through a process of collaboration and consultation with stakeholders in industry
and government, and support from USEPA. The process has included the following steps:
1. Review of the existing emissions and ambient standards.
2. Analysis of emissions source contributions.
3. Evaluation of AQ monitoring data.
4. Estimation of current and projected future health burden of air quality.
5. Establishment of goals and objectives for the plan.
6. Development of a detailed implementation plan. Achieving the goals and objectives of the plan requires
a detailed implementation plan – this is proposed in Section 6 of this plan and will be continuously updated
through stakeholder engagements and as part of the ongoing monitoring and evaluation of the plan’s
effectiveness, which is outlined in Section 7.
143. SUMMARY OF BASELINE AIR QUALITY CHARACTERIZATION
The air quality baseline reflects all air pollution regulations and policies currently in effect. The baseline is
thenadjusted to reflect a future economic growth scenario where emissions grow at the rate of projected population
and GDP growth. The baseline reflects current emission sources, their expected trends for the foreseeable future,
and current air quality. Current air quality is characterized here using three years of regulatory-grade monitor data
from the U.S. Embassy monitors combined with calibrated remote-sensed satellite data for the most current
available year, as described below. Projections of an air quality baseline are based on available information for
current trend and available source apportionment studies, which provide a means to estimate the relative
contribution of sources to ambient air quality. In general, there is limited publicly available historical data beyond
the regulatory-grade monitors in Addis Ababa which monitor relatively clean areas of the city; further data are
needed concerning emissions quanitities and trends particularly in the central region of the city; and further research
is needed on air pollution source apportionment. For this reason, this plan also includes specific goals and measures
designed to improve gradually over time the information and evidence that can be used to support air quality
management. Current air quality also has implications for health status, also reviewed in this section. The baseline
further includes the state of governmental air quality management capacity at the national and local level.
.
3.1 EMISSION SOURCES
In Addis Ababa, both mobile and point emission sources contribute to CO, NOx, O3, SO2, PM10, and PM2.5 pollution in
the metropolitan area. Common sources of ambient air pollution in Addis Ababa are vehicle emissions from fuel-
inefficient, aging vehicles, incomplete combustion from diesel vehicles, unpaved roads, industrial sources, and
construction. Other sources include household cooking and heating, open burning of solid waste, and transport of
pollution from surrounding areas. Detailed future studies on speciation of the particulate will help determine the
impact of these emitters. However, trends like the diurnal spikes in particulate around rush hour point toward
vehicles as an important driver. Plans outlined in the Growth and Transformation Plans (GTPs I and II) illustrate
Ethiopia’s commitment to developing national, renewable energy sources for electricity generation (mainly
hydropower, but also geothermal) and replacing vehicles with light rail transit and bus rapid transit systems within
the city. Overall, the infrastructure projects undertaken show a significant push towards improving the efficiency
and low- to no-emission components of the transport and energy sectors, which will help reduce the burden of air
pollution in Addis Ababa.
VEHICLE FLEET AND EMISSIONS
Ethiopia had approximately 935,888 vehicles in use in 2018, with the number of vehicles registered growing at a rate
of 16% per year (Ministry of Transport, 2019). Vehicles emit various pollutants including NOx, CO, hydrocarbons
(HCs), and PM into the atmosphere. Diesel vehicles release black carbon, and more SO2 and PM than comparable
petrol vehicles (Roychowdhury et al., 2016; Addis Ababa Institute of Technology, 2012). Older vehicles also
contribute significantly to ambient air pollution from their low fuel efficiency.
Both Addis Ababa Institute of Technology (2012) and Roychowdhury et al. (2016) have done extensive research on
the vehicle fleet composition and emissions in Addis Ababa. Data on the number of vehicles and types of vehicles
registered were collected from the Addis Ababa Transport Authority and data on imported vehicles can be gathered
from the Ethiopian Revenues Custom Authority. The Transport Authority is not responsible for private cars, but
15manages all public buses, public minivans, freight vehicles and private taxis in the city. Their findings show that the
vehicle fleet is increasingly aged, and the proportion of diesel vehicles is rising (Roychowdhury et al., 2016). Figure
3-1, from Roychowdhury et al. (2016), shows the breakdown of cars by age class in 2014-2015.
Although the number of vehicles is increasing, around 91% of Addis Ababa’s population utilizes public transportation
(Roychowdhury et al., 2016). The public transportation system is based around a bus and light-rail transit system
(LRT). The buses and minibuses can hold 12-24 people and travel along designated bus routes throughout the city.
Most light-duty vehicles (LDVs) are imported, but Ethiopia began local assembly of vehicles between 2005 and 2008.
Many of the LDVs emit substantial pollution; AACTA estimates that 31 % of the overall fleet lack catalytic converters.
Because of the public’s significant usage of the bus system, buses of all sizes accounted for nearly 39% of PM emission
load from vehicles in 2014-2015 (Roychowdhury et al., 2016).
Figure 3-1. Breakdown of vehicles and cars by age class, 2014
To reduce the dependence on buses and lower emissions from public transportation, the CRGE and GTPI established
measures to expand and upgrade the LRT in Addis Ababa Metropolitan Area and between Addis Ababa and Djibouti.
Constructing and renovating the LRT in Addis Ababa was a substantial infrastructure project implemented under the
GTPI. The LRT in Addis Ababa has since been completed and 41 additional km are planned to be constructed in GTPII.
The LRT was not finished when the CSE report and Figure 3-2 below were published. The usage mix of public
transportation is likely to change with the completion of the LRT. Moreover, the emissions trend line in Figure 3-2
may be outdated as people begin using the LRT over the buses as their mode of transport; however, traffic
congestion created by LRT may contribute to air pollution within the city. Additional data on LRT capacity and
ridership would be needed to assess potential impacts of this change.
Figure 3-2 also shows the significant contribution of PM from freight vehicles (i.e. vehicles with machinery, liquid
cargo, tractor, trailer, dry cargo). Because Ethiopia is landlocked, most exported goods must be transported from
Addis Ababa to Djibouti’s port. Freight vehicles account for 75% of greenhouse gas (GHG) emissions in the transport
sector and account for 23% of PM emissions (Roychowdhury et al., 2016; Federal Democratic Republic of Ethiopia,
162013). Construction of the LRT between Addis Ababa and Djibouti is complete and operating with some interruptions
at present. Truck traffic on the road still dominates shipping volume.
Figure 3-2. Trend of Increased Particulate Matter Emission Load from Different Vehicle Types
Once the train line is complete and fully operational (it began service in 2018), goods traditionally carried by diesel
freight trucks will be transported via electric rail, reducing GHG and PM emissions in the future. Similarly, the
proportion of PM emissions from freight in Figure 3-2 will also likely become outdated after the LRT completion.
The population’s reliance on public transportation, rather than personal vehicles, can partly be credited towards the
city’s tax incentives to use public transportation and discourage personal vehicles. New cars specifically are taxed at
100%, where old cars are taxed at a lower rate but now the government of Ethiopia drafting policy that discourage
old vehicles by increasing taxes up to 500% Excise Tax Proposed on Secondhand Cars (Ethiopian Monitor, 2019).
Recently, Ethiopia banned importing vehicles older than a specific manufacturing date, which will lessen the number
of aged vehicles on the road in the future (Tefera et al., 2014), but there is currently no retirement age for vehicles
already registered in the country. Consequently, the high importation duties prevent people from buying new cars
and leads to a large proportion of aged, inefficient, and polluting vehicles.
Despite an aging vehicle fleet, there are several policies in place and currently being drafted under the CRGE and
GFEI regarding vehicles standards. The CRGE is drafting vehicular emission standards for emissions and promoting
fuel blends of ethanol, gasoline, and biodiesel through the EFCCC. Using blended fuel will reduce the country’s
reliance on imported fuel with high sulfur content from Sudan (other fuels are imported from Saudi Arabia and
Kuwait.) Currently, every car in Ethiopia must undergo an annual inspection to ensure the vehicle meets safety
standards, and at that time emissions are checked in some fashion; however, we are not aware of standards
established by the Transport Authority to measure compliance (Addis Ababa Institute of Technology, 2012).
17INDUSTRIAL SOURCES
At the end of the GTPI, agriculture, industry, and services shared 38.5%, 15.1%, and 46.3% respectively of the
Ethiopian economy (Federal Democratic Republic of Ethiopia, 2015). Of the industrial sector, the manufacturing
subsector made up 5% of the GDP and grew at an average rate of 14.6% per year. The manufacturing subsector
contains garment and textile processing, leather processing, agro-processing, paint and dye manufacturing,
pharmaceuticals, metal manufacturing, glass manufacturing and concrete manufacturing. There is little quality data
on industrial emissions in Ethiopia making enforcement difficult. The EPGDC did succeed in banning the use of high-
polluting fossil fuel in a glass manufacturing plant in Addis Ababa after neighborhood complaints of the smoke.
The construction sector is possibly the most notable growth industry. The construction subsector grew at a rate of
28% over the GTPI period and its share of GDP increased from 4% to 8.5% (National Planning Commission, 2016).
The construction industry was largely driven by the infrastructure projects undertaken during the GTPI
implementation. Cement creation accounted for the largest source of industrial GHG emissions. The EFCCC has set
national air pollutant emissions standards for each of these industries.
Table 3-1. Emissions standards for cement manufacturing
Limit Values for Emissions to Air
Parameter Limit value
Total particulates 150 mg/Nm3
Sulphur dioxide (as SO2) 1000 mg/Nm3
Nitrous oxide (as NO2) 2000 mg/Nm3
Source: Provisional Standards for Industrial Pollution Control in Ethiopia
ROAD NETWORK
As part of the urban development and housing section of the GTPI, almost 3,800 km of cobblestone roads were
constructed in urban areas over the five-year period (Federal Democratic Republic of Ethiopia, 2015). Nationally, the
paved road network expanded from 48,800 km to 63,604 km over the GTPI period, with an additional 46,810 km of
unpaved roads. This spike in demand for concrete and asphalt led to a dependence on imported materials at the
beginning of the GTPI period. By 2012, however, the local cement industry supplied all of the cement necessary for
infrastructure projects (Federal Democratic Republic of Ethiopia, 2015).
Despite growth in local industry supporting paved roads, only 13% of the roads in Ethiopia are paved. Part of the
GTPII plan is to increase the ratio of paved to unpaved roads to 16% (Federal Democratic Republic of Ethiopia, 2015).
The high proportion of unpaved roads significantly impacts ambient air pollution. A source apportionment study
conducted in 2004 concluded that between 35-65% of PM10 in Addis Ababa was geologic in origin, with unpaved
roads as the main source (Etyemezian et al., 2005). With an increasing number of vehicles on the road and a large
unpaved road network, the concentration of suspended dust particles from unpaved roads could increase.
POWER GENERATION
Strategic directions of the GTPI and GTPII include increases in renewable power generation. The current electric
generation capacity is 4,180 MW and will expand dramatically with renewable energy generation including the
completion of the Grand Ethiopian Renaissance Dam (GERD), geothermal IPPs, solar IPPs, and wind farms. Electric
capacity and expansion have important implications for electric rail transportation as discussed above. However,
since most power generation is renewable, it will not contribute to air pollution. However, power distribution
18through transmission lines and transformers is not keeping up with the rapid population expansion of the city leaving
intermittent power supply issues leading to regular use of diesel generators which impact air quality.
OPENING BURNING OF TRASH
Open burning of trash is believed to be a major issue in Addis Ababa, though minimal supporting information is
currently available to characterize these emissions in a comprehensive fashion (see for example, Tefera et al. 2016).
A global literature review of source attribution studies found that in Africa as a whole, the contribution of household
combustion sources to ambient PM air pollution is about 34%, based on the results of four studies in Ghana, Nigeria,
South Africa, and Tanzania, while traffic accounts for about 17% (Efobi etal, 2018). These results may not necessarily
accurately reflect the source contribution of household burning for urban locations, and there is no information on
the contribution of trash burning to this broader household combustion category. Further, there is no evidence yet
available to confirm that household combustion would account for this percentage of ambient PM in Addis Ababa.
The AAEPGDC nonetheless is aware of ongoing work within the GeoHealth Hub of Addis Ababa University to develop
new source attribution estimates specific to Addis Ababa city, which remain under development at the time of the
drafting of this AQMP.
HOUSEHOLD COOKING AND HEATING
Household cooking and heating are believed to be a major contributor to health impacts from indoor air pollution
exposure (CCA 2019; UN-Habitat 2017), but little information exists to clarify the role of household cooking and
heating as a contributor to ambient air pollution. Etyemezian et al. (2005) concluded that the timing of particulate
matter spikes over 24 hour periods suggest a major role for traffic, household cooking, and household heating in
Addis Ababa, but more information is needed to confirm the specific role of household cooking and heating on
ambient air quality in Addis Ababa.
Some data do exist to suggest that indoor air exposures from household cooking and heating are very high and could
be significantly reduced by policies and campaigns to improve the efficiency of household cooking and heating
devices, and/or to improve the fuel quality. For example, Sanbeta et al. (2014) concluded that changes in cookstove
type and fuels could reduce the health burden of indoor air exposures to particulate matter by as much as 70% for
households that switch from solid fuels to clean fuels. During January and February 2012, they measured the
concentration of fine particulate matter (PM2.5) in 59 households using the University of California at Berkeley
Particle Monitor (UCB PM). The measurements yielded a geometric mean of 24-h indoor PM2.5 concentration of
3 3
approximately 818 μg/m overall, with 24-hr estimates as high as 1134 μg/m for households using solid fuel;
3 3
637 μg/m for households using kerosene; and 335 μg/m for households using clean fuel. Additional evidence of
the exposure reducing effects of changes in fuel types and cookstoves was provided by Pennise et al. (2009), who
examined cookstove use and indoor exposures in low-income areas of Addis Ababa. Household surveys in Ethiopia
conducted by the Ministry of Health find that in urban locations about one quarter of households utilize a location
in the house for cooking (FMOH 2016). Further, households in urban locations use a range of fuels for cooking;
42.5% burn wood, 27.8% burn charcoal, and 24.2% use electricity – the remaining 5.5% employ either gas, liquid, or
other biomass sources (FMOH 2016, Table 2.4, page 21).
19EMISSION SOURCE ATTRIBUTION
Emission source apportionment or source attribution is a quantitative analysis that identifies the share of ambient
air pollution that can be attributed to a specific class of emissions sources within a city or region. The results are
expressed as percentage contributions for categories such as traffic, industry, or domestic fuel burning. An example
of this type of results is provided below in Figure 3-3 from Karagulian et al. (2015), a comprehensive review of source
apportionment studies conducted world-wide, in urban and rural areas, to provide a basis for comparing the relative
role of emissions sources in different areas of the world. As the figure shows, for Sub-Saharan Africa as a whole it is
estimated that the domestic fuel burning source accounts for the largest share of fine particulate matter in the
ambient air (34%), followed by natural sources (22%), traffic and unspecified sources of human origin (each 17%),
and industry (10%). The role of domestic fuel burning in Africa is much larger than in most other locations, while the
role of traffic and industry is somewhat less. These results, however, do not necessarily represent urban areas of
Africa, where we could reasonably expect traffic and industry to be more concentrated and to play a larger role, and
domestic fuel burning to play a lesser role as a result of urban electrification and the presence of at least some
centralized waste management.
Figure 3-3. Emission Source Attribution Results Based on a Global Literature Search
Source: Karagulian et al. (2015)
For Addis Ababa, some specific information exists, but it is less specific than a rigorous source attribution study could
provide. Etyemezian et al. (2005) conducted a pilot study during the dry season of 2004, which measured PM10, CO,
and O3 concentrations at 12 sites throughout the city and collected 21 samples total. In addition to measuring
20concentration levels, the study examined the composition of the particles (using broad categories) to estimate the
relative contribution of different emissions source. The 12 sites were situated in both urban and suburban locations
in order to compare different concentrations and sources between the two settings. Figure 3-4 displays the PM10
concentrations from the 21 samples and the average concentration at each of the 12 locations. The green line
represents the WHO guideline for daily PM10 concentrations. The study also found that the PM10 concentrations
were made up of 30-60% geologic material, indicating that unpaved roads contributed significantly to PM10
concentrations – vehicle emissions and household burning are also identified as key sources of PM air pollution,
based on the diurnal pattern of concentrations. The results, however, are slightly outdated—especially when
considering the dramatic increase in PM concentrations from vehicles between 2004-2015 (Figure 3-2 above,
showing estimated PM emissions from the transport sector).
Figure 3-4. PM10 concentrations from each sampling site
Source: Etyemezian et al. (2005)
3.2 EXPECTED EMISSIONS TRENDS
In many urban locations, there are six main sources of air pollution emissions: energy production, particularly electric
energy from fossil fuel-fired generating units; mobile sources – vehicles including trucks, buses, and transit; industrial
sources; household and open burning of biomass, waste, and heating fuel; all other man-made sources, such as
construction, off-road engines, and resuspended dust from unpaved and paved roads; and natural sources. These
categories are often used, for example, in source apportionment studies, such as Karagulian et al. (2015). The
following analysis will examine these six sources as they relate to Addis Ababa.
In the energy sector, Ethiopia in general, and Addis Ababa in particular, has the potential to generate electric energy
almost entirely from renewable sources, through use of hydropower. As a result, we would expect that the
emissions trend from this source would be downward or, at worst, relatively flat. Until the electric grid reliability
improves however, there remains a concern about potential growth in the use of diesel generators for backup
electric power. Any efforts to mitigate air quality in this sector should target upgrading electricity transmission and
21distribution networks that have not kept up with the rapidly growth urban population and demand for electricity.
Improving the steady supply of power will impact diesel emissions from generators.
Natural sources of air pollution in Addis Ababa are believed to be a relatively small contributor to current air quality
concerns much like electricity generation.
As noted in the previous section, the transport sector has a high potential for growth, in both the number of vehicles
and their potential to emit air pollution, owing largely to an aging vehicle fleet. Vehicle registrations have grown
approximately 12 percent per year from 2011-2015 (CSE, based on Addis Ababa Transport Authority Data) – and
more recent data suggesting a more rapid growth rate of 16 percent per year through 2018 (Ministry of Transport,
2019). With no changes to vehicle emissions rates, we could expect that transport emissions could grow at a similar
rate, absent immediate action to reduce emissions. Data presented in the previous section suggest this expectation
of growth in emissions from this sector is warranted, though the rate of growth is certainly subject to uncertainty,
particularly in light of recent actions taken to provide stronger incentives to import newer vehicles, and reduced
incentives to import older vehicles.
The trends in industrial source emissions are largely unknown – the same could be said for other man-made sources
of emissions. Absent data, it is reasonable to expect that industrial and “other” sector emissions could grow at the
rate of increase of economic activity. The World Bank recently estimated GDP growth from 2011 to 2016 of 10
percent per year and future projections are just below this value. Without significant improvements in monitoring
and enforcement, it is unlikely that this economic growth would not increase air pollution.
The trends in emissions from open burning of waste, and household fuel use, are not well-documented, but few if
any controls on these sources have been implemented. As a result, it is reasonable to expect that these sources will
grow by a rate consistent with population growth. Based on the Central Statistical Agency’s population projections
for 2022 and 2027, it is possible that these source emissions could grow by 12 percent annually to 2022, and by 11
annually from 2023 to 2027.
There are many examples of cities and countries where trends in emissions are substantially different from trends
in drivers of emissions such as population and GDP – the rate of growth can be slower, or can be negative, while
population and GDP grow rapidly. Given the known factors of current emissions, it is possible to model future
emissions under alternative scenarios (Figure 3-10 below, for example). The key to achieving improvements in air
quality while maintaining GDP and population growth, however, is a well-established and functioning system of air
pollutant emissions control and enforcement. This AQMP is an important first step toward achieving that goal.
3.3 AMBIENT AIR QUALITY
With two years of regulatory-grade air quality data it is clear that annual averages are at least two to three times
3
higher than the WHO guideline of 10 μg/m . There are three PM2.5 air quality monitors in Addis Ababa—one
maintained by Addis Ababa University through their work with the East Africa GeoHealth Hub, and two maintained
by the United States Embassy (Figure 3-5). The Addis Ababa University PM2.5 air quality monitor is located at the
College of Health Sciences at the Black Lion Hospital.
Data from the Black Lion monitor and ten other temporary monitors associated with a Black Lion/GeoHealth
longitudinal study of children’s health are not yet publicly available, though summary data for one year have been
provided and are reflected in the estimates of air quality presented below. The temporary monitors are no longer
in operation, but there remains a permanent monitor at Black Lion Hospital.
22Of the two US Embassy monitors, one is located on Embassy grounds in the northern area of the city and the other
is located at the Addis Ababa International Community School in the south (see Figure 3-6). The two monitors are
called Central and School, respectively, on the USEPA AirNow-International website. The monitors began collecting
data in mid-2016 at the School site, and in late 2016 at the Central (Embassy) site. Annual average PM2.5
concentrations recorded at each monitoring station from the previous five years are presented in Table 3-2.
Table 3-2. 24-hour average and maximum measured PM2.5 concentration
PM2.5 Concentration, µg/m3
Site (n = number of hourly measurements)*
2016 2017 2018 2019 2020 2021
25.1 25.6 25.6 20.2 24.4 20.3
Central
(n = 2776) (n = 8466) (n = 8017) (n = 6874) (n = 8337) (n = 1836)
36.5 33.2 37.4 30.8
School Unavailable** Unavailable**
(n = 2935) (n = 5908) (n = 3156) (n = 316)
*Note: Monitoring at Central site and School site began in late-2016 and mid-2016, respectively. Annual
concentration for 2021 references January – March only.
**School site concentrations are unavailable from December, 2018 through December, 2020.
7
Historical PM2.5 concentrations measured at these two stations are available online from the AirNow-DOS system .
Since the start of monitoring in mid-2016, the mean 24-hour average PM2.5 concentration recorded at the Central
3 3
site is 24 µg/m and the mean 24-hour average PM2.5 concentration recorded at the School site is 34 µg/m , both of
which exceed both the daily and annual PM2.5 WHO guideline. Figures 3-7 and 3-8 below show diurnal and monthly
PM2.5 concentrations measured at each site, respectively.
Figure 3-5 Map of Monitor Locations in Addis Ababa
Sources: Addis Ababa Boundary – Urban Planning Commission, received 2018.
7
See https://airnow.gov/index.cfm?action=airnow.global_summary
23Figure 3-6 Monitor Locations – Google Maps and USEPA AirNow
Source: AirVisual online tool shows three of the UNEP monitors that are currently online plus the U.S. Embassy
monitor at the top.
Diurnal patterns at both the Central and School sites show increased concentrations during the morning and
afternoon rush hours as well as possibly a temperature inversion in the morning, with concentrations at the School
site higher than at the Central site. The School site shows higher concentrations overnight than during the day – this
is likely related to the ventilation of pollutants during the day and trapping of pollutants overnight, and potentially
due to local emissions sources near the school that are unrelated to commuting (e.g. emissions from waste burning
at the local landfill). To provide additional context, the WHO PM2.5 health guideline indicates that daily PM2.5
3
concentrations should not exceed 25 μg/m ; daily mean values depicted in Figure 3-7 at both the School and Central
sites exceed this guideline. Average monthly PM2.5 concentrations are shown in Figure 3-8.
24You can also read