A System-Wide Understanding of the Human Olfactory Percept Chemical Space
←
→
Page content transcription
If your browser does not render page correctly, please read the page content below
Chemical Senses, 2021, Vol 46, 1–13
                                                                                                      doi:10.1093/chemse/bjab007
                                                                                                                   Original Article
                                                                                       Advance Access publication 26 February 2021

                                                                                                                                                               Downloaded from https://academic.oup.com/chemse/article/doi/10.1093/chemse/bjab007/6153471 by Oklahoma State University (GWLA) user on 11 August 2021
Original Article

A System-Wide Understanding of the Human
Olfactory Percept Chemical Space
Joel Kowalewski1, Brandon Huynh2 and Anandasankar Ray1,2,
1
 Interdepartmental Neuroscience Program, University of California, 3401 Watkins Drive, Riverside, CA 92521, USA
and 2Department of Molecular, Cell and Systems Biology, University of California, 3401 Watkins Drive, Riverside, CA
92521, USA

Correspondence to be sent to: Anandasankar Ray, Department of Molecular Cell and Systems Biology, University of
California Riverside, 3401 Watkins Drive, Riverside, CA 92521, USA. e-mail: anand.ray@ucr.edu

Editorial Decision 16 February 2021.

Abstract
The fundamental units of olfactory perception are discrete 3D structures of volatile chemicals that
each interact with specific subsets of a very large family of hundreds of odorant receptor proteins,
in turn activating complex neural circuitry and posing a challenge to understand. We have applied
computational approaches to analyze olfactory perceptual space from the perspective of odorant
chemical features. We identify physicochemical features associated with ~150 different perceptual
descriptors and develop machine-learning models. Validation of predictions shows a high success
rate for test set chemicals within a study, as well as across studies more than 30 years apart in
time. Due to the high success rates, we are able to map ~150 percepts onto a chemical space of
nearly 0.5 million compounds, predicting numerous percept–structure combinations. The chemical
structure-to-percept prediction provides a system-level view of human olfaction and opens the
door for comprehensive computational discovery of fragrances and flavors.

Key words: flavors, fragrances, machine learning, olfaction, prediction

Introduction                                                                       perceptual descriptions for the same chemical (Dravnieks 1985; Keller
                                                                                   and Vosshall 2016), implying an underlying physicochemical basis for
Human perceptual descriptions for olfactory stimuli are less stereo-
                                                                                   human olfactory perception. In fact, predicting percepts from physico-
typic than for vision or auditory stimuli where perception can be pre-
                                                                                   chemical features is becoming increasingly plausible (Khan et al. 2007;
dicted by clearly defined properties such as wave frequency. In fact,
                                                                                   Haddad et al. 2010; Snitz et al. 2013; Nozaki and Nakamoto 2016;
olfactory perception may vary without an apparent relationship to
                                                                                   Keller et al. 2017; Kepple and Koulakov 2017; Licon et al. 2019).
the physicochemical properties of an odorant nor the molecular and
                                                                                   However, the breadth and complexity of the human olfactory percep-
cellular organization of the olfactory system (Buck and Axel 1991;
                                                                                   tual space and its physicochemical correlates remain poorly under-
Vassar et al. 1993; Mombaerts et al. 1996; Mombaerts 1999, 2001).
                                                                                   stood except for a select few (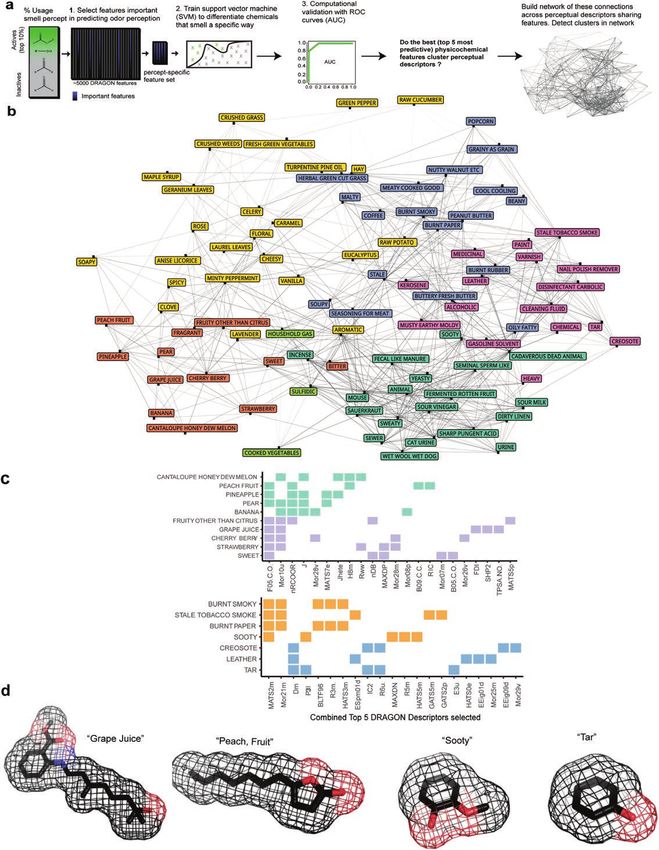
2                                                                                                          Chemical Senses, 2021, Vol. 46

    Previous attempts to predict ratings of odor perception from         2015), we primarily considered a sample of industry professionals
the physiochemical features of molecules have been successful to         as reported in the atlas of odor character profiles (Dravnieks 1985).
some degree, although these examples represent a small fraction          Notably, the semantic descriptors (odor characters or perceptual de-
of the perceptual descriptor space (Khan et al. 2007; Nozaki and         scriptors) were sparsely used in some cases among the general public
Nakamoto 2016; Keller et al. 2017). In these previous efforts, sev-      volunteers, suggesting that averaged ratings for a given descriptor

                                                                                                                                                   Downloaded from https://academic.oup.com/chemse/article/doi/10.1093/chemse/bjab007/6153471 by Oklahoma State University (GWLA) user on 11 August 2021
eral perceptual descriptors tested were hard to predict and these        (odor character) might represent a very small proportion of the re-
descriptors may have been difficult to evaluate by study volunteers      spondents. This becomes particularly important for generating pre-
or lack a strong physicochemical basis. Nevertheless, a natural lan-     dictive models since missing data points (e.g., chemicals or odorants
guage processing approach could successfully predict perceptual          that are not rated by some participants) must be dealt with such
descriptors across studies, suggesting that descriptions of olfactory    as by averaging ratings for the nearest neighboring (k) odorants or
perceptual content are likely structured and not totally subjective      filling-in with the median/mean rating across all odorants. Although
(Gutiérrez et al. 2018). These earlier studies create an underlying      these approaches are valid in predictive modeling, they are a signifi-
framework that points to the intriguing possibility that the per-        cant modification of the respondent data; the failure to provide a
ceptual descriptions humans select to characterize odorants are          rating is a potentially important source of information. We main-
associated with key physicochemical features, even those that            tained, as a result, the 0–100 scale for the general public volunteer
are seemingly abstract and currently not well defined. Although          data but converted ratings to a % usage metric instead. Dilution was
prior structure–activity studies predate modern machine learning,        not considered, averaging % usage over the different dilutions. In
indicating features enriched among chemicals with shared percep-         preliminary analyses, there was however some evidence that models
tual qualities (Rossiter 1996), some exceptions arise.                   might benefit from training on data from a single dilution. Similarly,
    A few recent studies have modeled odor perception using large        a small number of replicates that were performed in this study were
databases, training deep neural networks to predict perceptual de-       not included in the final training and testing data sets.
scriptors from chemical features (Sanchez-Lengeling et al. 2019;              Although with the % usage each odorant is assigned numeric
Tran et al. 2019). These studies have suggested that many complex        values more naturally, this modification was also in line with the
perceptual descriptors are predictable. The chemical representation      Dravnieks (1985) study data. The % usage therefore provided a
or input in these studies undergoes modification, in which the pre-      means to compare 2 sources that to a first approximation appear
dictive features are the weights of the neurons in the neural network,   very different. Dravnieks (1985) also reports a percent applicability
making them challenging to interpret. We have established a pipeline     metric. The percent applicability is the sum of the ratings for a chem-
to clarify the physicochemical properties that best predict diverse      ical or odorant over all participants divided by the maximum pos-
perceptual descriptors and to rigorously test using different metrics    sible sum. This was not used for our cross-study comparisons as
and controls that ensure the machine-learning models are consistent      ratings from an experienced participant panel might scale differently
with biological expectations. We find that chemical feature models       and the sample size between the 2 studies is very different. Because
can address many complex, biologically relevant tasks. As this sug-      cross-study comparisons are not well defined, we opted for the sim-
gests the important or predictive features that we identify are a re-    plest possible metric, the % usage.
source for further research, we finally annotate a large commercially
available chemical database with predicted odor qualities. These         Atlas of odor character profiles, Dravnieks (1985)
predictions reveal enriched structural motifs that help interpret the    Dravnieks (1985) summarizes odor profiles for 180 odorants, rep-
machine-learning models.                                                 licates, and mixtures, with the latter not being used for predictions,
                                                                         from 507 industry professionals in total across 12 organizations.
                                                                         Each chemical was rated by between 120 and 140 participants.
Materials and Methods                                                    The participants scored a set of replicates, which were used to pro-
Psychophysical data                                                      vide an index of discriminability for the data as the inverse of the
Keller (2016) study                                                      squared correlation coefficient between replicates (RV). For this
We used data from 55 general public volunteers (Keller and Vosshall      study, RV = 0.11. The scoring metric was on the range of 1–5 with
2016) for external validation (Figures 1 and 2, Supplementary            1 being slightly and 5 being extremely relevant. Raw scores were
Figures 1–5). Due to limited diversity in the selection of odor de-      subsequently processed into 2 numeric values summarizing the par-
scriptors supplied by naive volunteers and evidence indicating ex-       ticipants’ responses. We only focused on the % usage; the fraction
perience with odor language improves the quality of perceptual data      of participants providing any response, 1–5 because it is the sim-
(Lawless 1984; Dubois and Rouby 2002; Olofsson and Gottfried             plest metric to interpret and relate to other studies. The perceptual

Software and data resources

Type                  Designation         Source or reference                                Identifiers   Additional information

Software, algorithm   R 3.5.1             https://github.com/tidyverse/ggplot2                             ggplot2 (R)
Software, algorithm   R 3.5.1             https://github.com/igraph/igraph                                 igraph (R)
Software, algorithm   R 3.5.1             https://github.com/tgirke/ChemmineR                              ChemmineR (R)
Software, algorithm   R 3.5.1             https://github.com/topepo/caret                                  caret (R)
Data                  Keller (2016)       https://doi.org/10.1186/s12868-016-0287-2
Data                  GoodScents          http://www.thegoodscentscompany.com/index.html
Data                  DREAM               https://github.com/dream-olfaction/                              407 Train, 69 Test chemical IDs for
                                            olfaction-prediction                                             Keller (2016) data
Data                  Dravnieks (1985)    http://doi.org/10.1520/DS61-EB                                   Data from the original 1985 edition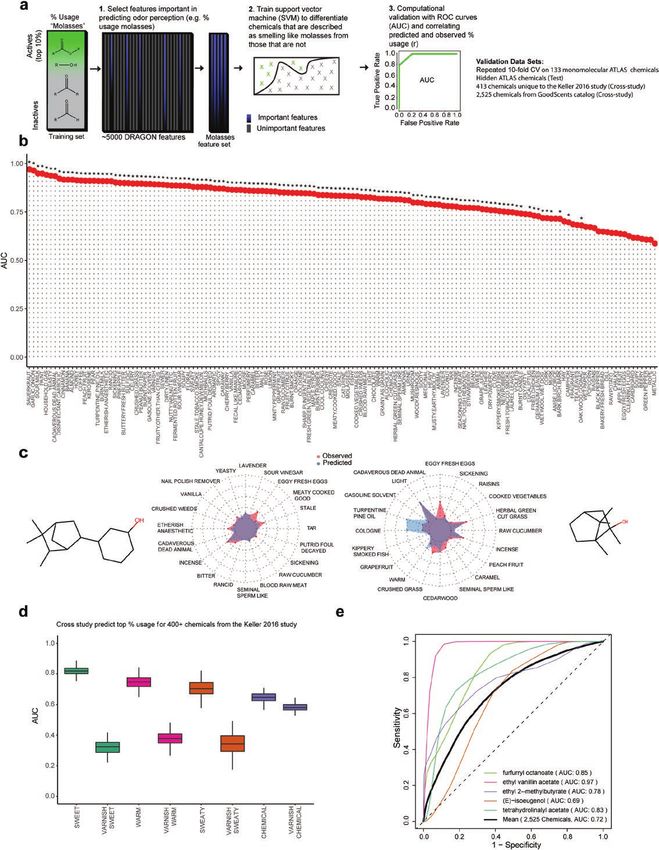
Chemical Senses, 2021, Vol. 46                                                                                                                3

descriptor (or character) set available for the Dravnieks (1985) study    prediction error—here, the error in predicting the % usage value—
was extensive but empirically driven. Recommendations from the            many lack a well-defined method for quantifying feature import-
American Society for Testing and Materials (ASTM) sensory evalu-          ance. Feature importance and ranking must, in these instances, be
ation committee winnowed an initial set of 800 possible odor char-        supplied externally such as by nonlinear regression models for each
acters (perceptual descriptors) for sensory analyses down to 160.         predictor and outcome compared with a constant.

                                                                                                                                                    Downloaded from https://academic.oup.com/chemse/article/doi/10.1093/chemse/bjab007/6153471 by Oklahoma State University (GWLA) user on 11 August 2021
Prompted by additional research, this figure was later revised to 146         Including cross-validation with the RFE partitions the training
relevant perceptual descriptors, a final set that addressed concerns      data into multiple folds. This step avoids biasing performance esti-
in which clear perceptual differences could result in identical de-       mates but results in lists of top predictors over the cross-validation
scriptor usage from study participants. This final set of 146 percep-     folds such that importance of a predictor is based on a selection rate.
tual descriptors and the percent usage was subsequently prepared for
machine-learning analyses.                                                Random forest
                                                                          Random forest is an extension of basic decision trees that overcomes
GoodScents test data                                                      the often-poor generalizability of these models by aggregating the
GoodScents is a database of 2000+ chemicals, containing basic phys-       predictions from multiple trees trained on bootstrap samples and dif-
icochemical information as well as perceptual descriptor labels, if       ferent predictor sets, effectively limiting redundancy between trees.
available, from published reference materials. Since it is not possible   Rows that are excluded as part of bootstrapping process are used
to predict a descriptor for which there is no Dravnieks (1985) equiva-    to estimate prediction performance on new data. This also provides
lent, we had to define exclusionary criteria to properly evaluate the     a method for assigning importance to features through randomiza-
predictions. This included in addition to removing nonunique chemi-       tion; the % increase in prediction error after randomizing a feature is
cals those without descriptor labels matching or similar to Dravnieks     accordingly the ranking metric that was used for tabulating chemical
(1985), leaving 2525 chemicals for test set validation. Examples of       feature importance (shown in Supplementary File 1).
similar descriptors in GoodScents include “weedy” and “nutty,”
which correspond with “crushed weeds,” and “walnut” and “peanut           Selection bias
butter in Dravnieks (1985), respectively.” The 146 Dravnieks (1985)       Selecting features or predictors on the same dataset used for cross
descriptor models assigned a probability score. Receiver operating        validation results in models that have already “seen” possible parti-
characteristic (ROC) curves were subsequently computed using the          tions of the data and therefore performance metrics will be biased.
observed descriptor labels for each of the 2525 chemicals. A chem-        Selection bias (Ambroise and McLachlan 2002) was addressed by
ical described simply as “nutty,” for example, is expected to have        bootstrapping and cross-validation, which ensure some separation
high probabilities for “peanut butter” and “walnut,” but not for “or-     between predictor/feature selection and model-fitting/validation. In
ange” and “chemical.” Cases where descriptors were correlated in          addition to these methods, we used hidden test sets and also showed
Dravnieks (1985) (>0.85) were also defined as a set to avoid overly       that the models could be used to predict perceptual responses from
penalizing the assignment of redundant descriptors to new chemi-          a completely different experiment, removing methodological biases
cals. We identified earlier that models with this level of correlation    arising from odorant preparation and presentation or any unfore-
are often interchangeable, with only a non-significant reduction in       seen regularities that machine-learning algorithms could exploit but
prediction performance. Namely, machine-learning assignment of            that are fundamentally task irrelevant for the analyst or researcher
“Chemical” to an odorant described as “Varnish” was not incor-            interested understanding rather than predicting.
rect given the data. The ROC assesses that high probabilities are
correctly assigned to the observed descriptors. When the machine-
                                                                          Selecting optimal machine-learning algorithms
learning models predict descriptors that are unlike those observed,
                                                                          The support vector machine (SVM) with the radial basis function
the area under the ROC curve decreases. An independent t-test
                                                                          (RBF) kernel outperformed random forest, regularized linear models
comparison was made between actual areas under the ROC curve
                                                                          (ridge and lasso), and linear SVM, tuning over L1 versus L2 regu-
(AUCs) and those using random probability scores.
                                                                          larization (Figure 1). However, gradient boosted decisions trees and
                                                                          tree ensembles such as random forest nevertheless approximated
Selecting optimally predictive chemical features                          performance of RBF SVMs on the public volunteer data (Keller
Optimizing chemical structures                                            2016), which was used in part for the DREAM analysis, and in cer-
Chemical features were computed with DRAGON 6 for Dravnieks               tain cases outperformed it. This emphasizes that the optimal algo-
(1985) (Figures 1A and 2A). Chemical structures were optimized            rithm is context dependent. To ensure consistency in our analysis of
and 3D coordinates computed with OMEGA. Molecular or chem-                different psychophysical data sources, we did not report the results
ical features were precomputed and made publicly available for the        in this manner, that is, fitting the best-performing algorithm each
DREAM study, and these data files were used as is for analysis of the     time. We instead aggregated multiple SVM models to improve gen-
55 public volunteers reported in the Keller’s (2016) study.               eralizability. Algorithm selection and training was done using the R
                                                                          package, caret (classification and regression training) (Kuhn 2008; R
Chemical feature ranking and importance                                   Development Core Team 2016).
Cross-validated recursive feature elimination
Recursive feature elimination (RFE) iteratively selects subsets of        Cross-study predictions
features to identify optimal sets. The algorithm is a “wrapper” and       For cross-study predictions, models were fit as shown in the
therefore relies on an additional algorithm to supply predictions and     Figure 1a pipeline with Dravnieks (1985) data (Figure 1 and
quantify importance. Often this is a decision tree such as random         Supplementary Table 2). Multiple SVM models were fit with
forest, which was used here, since the algorithm computes feature         slightly different chemical features and their predictions were ag-
importance internally. This distinction between internal and external     gregated. This ensemble approach limits the tendency to overfit
simply means that although any arbitrary algorithm can supply the         during the training phase.
4 Chemical Senses, 2021, Vol. 46
Downloaded from https://academic.oup.com/chemse/article/doi/10.1093/chemse/bjab007/6153471 by Oklahoma State University (GWLA) user on 11 August 2021
Figure 1. Predicting perceptual descriptors from physicochemical features using machine learning. (a) Pipeline for predicting Dravnieks (1985) ratings (% Usage)
for perceptual descriptors, an example is provided for the descriptor, “molasses.” The important chemical features are detected that predict “Molasses.” An SVM
is fit, and the predictions are assessed by different methods such as the AUC from ROC plots. (b) Chemicals within the top 10% of ratings (% Usage) are labeled
as “Active.” The AUC quantifies the relationship between sensitivity to the actives (chemicals in the top 10% ratings) versus false positives. Bars in the plot
represent the average AUC from 3 models with different chemical features. The AUC is computed on chemicals excluded from training (30 times, 10-fold cross-
validation repeated 3 times). Significance (*) is determined by one-sided t-test, comparing the AUC to an identical model trained on shuffled “Active” labels.Chemical Senses, 2021, Vol. 46 5
Notably, chemicals do overlap between the 2 studies. Removing density. The actual network properties differed from those generated
these chemicals (58) from Dravnieks (1985) significantly reduces the through the random simulation.
available training data. We instead removed the overlap from the Keller
2016 data set, leaving 413 chemicals as a test set. Although theoretically Tools for network analysis and visualization
all 146 perceptual descriptors could be assessed, the choice of “warm,” Graph analyses were done using the igraph package (Csardi and
Downloaded from https://academic.oup.com/chemse/article/doi/10.1093/chemse/bjab007/6153471 by Oklahoma State University (GWLA) user on 11 August 2021
“sweaty,” “sweet,” and “chemical” depended on key differences in the Nepusz 2006) in R, plots with ggplot2 (Wickham 2016), and func-
perceptual descriptors available for the 2 studies, Keller (2016) and tions from the ggnetwork package for visualizing the networks.
Dravnieks (1985). For instance, although Dravnieks (1985) used word
strings in many cases such as “putrid, foul, decayed” to provide greater eMolecule predictions and network representation
context, Keller 2016 opted for “decayed.” It is unclear what affect this The eMolecule predictions are from Dravnieks descriptor models
difference might have and if it is nontrivial. The interpretation of the trained on the % usage (0–100 ratings), with detailed performance
cross-study prediction becomes ambiguous as a result. Identically pre- in Supplementary File 2, Supplementary Figure 1a, Supplementary
sented descriptors, like “chemical,” “warm,” “sweaty,” and “sweet” are Figure 2b, and Figure 3. The regression-based models predict or
well-defined cases for testing models across studies. estimate these ratings for the eMolecules chemicals. Because the
Dravnieks training set is not structurally exhaustive, we applied
Network analyses and visualizations 2 filters to further sort the predictions. These include (1) an atom
Matrices for network pair fingerprint based on commonly occurring feature sets in bio-
Chemical and perceptual descriptor relationships were modeled as logically active compounds (Cao et al. 2008) and (2) the % usage
bipartite graphs from an incidence matrix with perceptual descrip- values of the chemicals at the top end of the distribution (% usage).
tors as rows and columns the combined, unique optimal chemical Initially, the % usage values for the top chemicals (exemplars) per
feature sets (Figure 2). The optimal feature sets are from iteratively descriptor were applied to filter the predictions. For each descriptor,
fitting a random forest model on 100 different partitions of the the reduced set was then compared with the physicochemical features
Dravnieks (1985) training data. We ranked the features based on of the exemplar chemicals using atom pair fingerprints. Since atom
the random forest importance over the partitions. Several different pairs are a coarse representation of complex 3D molecules, we ap-
perceptual descriptor–chemical feature matrices were assembled by plied a Tanimoto similarity coefficient threshold of 0.25. This ensured
varying the number of ranked features per descriptor (e.g., top 3, 5, that predictions per descriptor displayed basic 2D features that over-
10). Incidence matrices from the top 3, 5, or 10 chemical features are lapped with the Dravnieks exemplar chemicals, while exploring new
therefore identical except for the number of columns (unique chem- structural patterns or motifs that are potentially missed in 2D com-
ical features). Factor analysis was performed to reduce the number parisons. Notably, projecting from a small chemical training set to
of perceptual descriptors for clarifying network plots as in Figure 2b. a larger chemical set potentially amplifies noise in the training data.
This was run using the factanal function in addition to functions in We would therefore recommend the table of top chemical features
the nFactors (Raiche 2010) R package for factor extraction. in Supplementary File 1 if interested in a less exploratory resource.
Specifically, values in the incidence matrices are 1 or 0; the op-
timal chemical features for each perceptual descriptor are 1, other- Enriched substructures/cores
wise 0. This amounts to a sparse matrix with the nonzero values, Enriched cores were analyzed using RDKit through Python (Van
indicating relationships among the optimal physicochemical features Rossum and Drake 1995; Landrum 2006) (Figure 4). The algorithm
and the perceptual descriptors. Collectively, these binary strings are performs an exhaustive search for maximum a common substruc-
likened to a set of combinatorial chemical feature codes for the ture among a set of chemicals. In practice, larger sets often yield less
Dravnieks (1985) perceptual descriptors. We subsequently separ- substantive cores. To remedy this, the algorithm includes a threshold
ated the bipartite graph for clarity into its constituent, adjacency parameter that relaxes the proportion of chemicals containing the
matrices, which are symmetrical, m × m and n × n, matrices, with m core. We used a threshold of 0.5, requiring that half of the chemicals
denoting rows (perceptual descriptors) and n the columns (chemical from the top 10 contained the core.
features) in the original incidence matrix. An adjacency matrix can
be obtained by multiplying an incidence matrix by its transpose. Natural language processing (Supplementary File 3)
Though key differences exist across computational or machine-
Clustering networks learning studies of odor perception, it is particularly important to
Several methods are available for identifying modules, communi- identify the challenges and strengths of different approaches as well
ties, or clusters in networks assembled from adjacency matrices. We as to provide an overview of the perceptual qualities that appear
tested several, selecting the Louvain algorithm based on its higher easy or difficult to predict. Natural language processing libraries,
modularity score for Dravnieks (1985) data. Actual or observed while not optimized for odor language, do offer an initial bridge
network properties were in turn compared to 10 000 random net- between studies including diverse and different perceptual descrip-
work simulations (Erdos-Renyi) of approximately identical size and tors. To that end, we used the spaCy library (Van Rossum and Drake
The number of “Active” labels remains unchanged. Significance threshold set at P ≤ 0.05 after adjusting for false discovery rate. (c) Predicted versus observed
% usage for select test chemicals. For clarity, only a selection of perceptual descriptors is shown. See Supplementary File 2 for additional detail and chemicals.
(d) Dravnieks (1985) trained models of “Sweet,” “Warm,” “Sweaty,” and “Chemical” predict ratings for these same descriptors from a study of public volunteers
for 413 test chemicals (Keller and Vosshall 2016). Cutoffs to convert the public volunteer data into actives are from the Dravnieks (1985) study (top 10% usage).
Significance is determined by one-sided t-test, comparing the perceptual descriptor models with a nonidentical but top-performing Dravnieks (1985) model,
“Varnish” over 100 bootstrap samples. Public volunteer perceptual data are averaged over dilution. (e) Average prediction performance (AUC) when assigning
1–146 Dravnieks (1985) perceptual descriptor labels to 2525 test chemicals with known labels in the GoodScents database. Performance metrics other than
classification (AUC) in Supplementary File 2. Formal definitions for the performance metrics and the SVM algorithm are provided in Materials and methods.6 Chemical Senses, 2021, Vol. 46
Downloaded from https://academic.oup.com/chemse/article/doi/10.1093/chemse/bjab007/6153471 by Oklahoma State University (GWLA) user on 11 August 2021
Figure 2. Building perceptual descriptor networks from few physicochemical features. (a) Pipeline summarizing methods for selecting the most important
chemical features for predictions of Dravnieks (1985) perceptual descriptors, followed by the construction of networks that help visualize relationships among
these descriptors when considering physicochemical information alone. (b) Assembled network from the top 5 chemical features per descriptor. Descriptors
with shared top 5 chemical features are connected in the network. Similar perceptual descriptors are color-coded based on the Louvain algorithm. (c) Two sets
of correlated descriptors are analyzed based on the chemical features that are important (among the top 5) for predicting them. (Top) Matrix 1: “fruity” descrip-
tors. (Bottom) Matrix 2: “sooty” descriptors. Louvain clustering (square color) shows the similar descriptors are separable into 2 subgroups. Filled-in squares,
regardless of color, represent the importance of the labeled chemical feature. (d) Exemplar chemicals from the computationally inferred clusters.Chemical Senses, 2021, Vol. 46 7
Downloaded from https://academic.oup.com/chemse/article/doi/10.1093/chemse/bjab007/6153471 by Oklahoma State University (GWLA) user on 11 August 2021
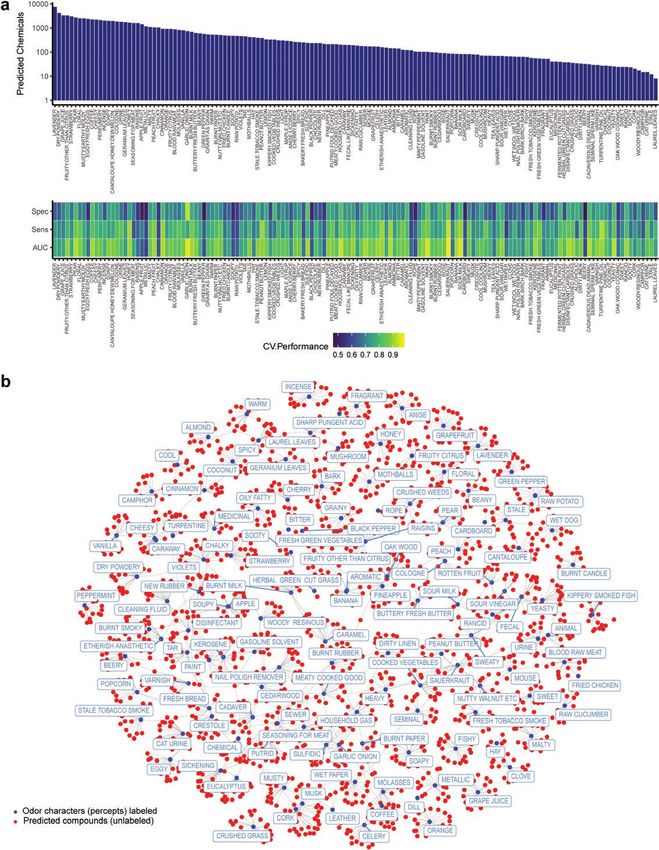
Figure 3. Predicting and mining large commercially available chemical spaces. (a) The machine-learning models are used to predict perceptual descriptors from
~440 000 compounds. (Top) predicted chemical counts are based on optimal thresholds from the ROC curves and structural similarity (atom pair similarity >
0.25) to training actives. An optimal threshold is the point on the curve that minimizes false positives and maximizes true positives. (Bottom) Detailed validation
for the models ordered with respect to the number of predicted chemicals. (b) A 2D representation of predictions for 15 hits for each perceptual descriptor (or
all chemicals that exceed the % usage threshold for actives), with edges connecting compounds that are predicted for multiple descriptors. The newly predicted
chemicals are indicated as unnamed red dots, and each descriptor as blue dots and labeled in rectangles. Predictions are from the SVM algorithm with a radial
basis function (RBF) kernel. See Materials and methods for additional information.8 Chemical Senses, 2021, Vol. 46
Downloaded from https://academic.oup.com/chemse/article/doi/10.1093/chemse/bjab007/6153471 by Oklahoma State University (GWLA) user on 11 August 2021
Figure 4. Enriched chemical features among predictions. (a) Top predicted chemicals in eMolecules from the Figure 3 network are clustered and analyzed for
common structural features (substructures or cores). These are highlighted (red) in images of representative chemicals from the predictions. The ID is the
eMolecules identifier. Simple structural features are common among predicted chemicals, enabling basic comparisons between different perceptual descriptors
based on chemical structure. Accordingly, this is an example of how a large network of predictions can offer additional insight. See Materials and methods for
details on the maximum common substructure algorithm for identifying the enriched features.Chemical Senses, 2021, Vol. 46 9
1995; Honnibal et al. 2020) and a convolutional neural network pre- where T is a variable threshold and x is a probability score.
viously trained on GloVe Common Crawl (Pennington et al. 2014) However, we generated classifiers that are more authentic than
and OntoNotes 5. The training set comprised more than 1 million theoretical random classification, shuffling the chemical feature
English text words. The network uses the high dimensional training values in the models and statistically comparing the mean AUCs
data to learn a lower dimensional space that represents syntactic and across multiple partitions of the data. This controls against opti-
Downloaded from https://academic.oup.com/chemse/article/doi/10.1093/chemse/bjab007/6153471 by Oklahoma State University (GWLA) user on 11 August 2021
semantic associations in the training texts or documents. New words mally tuned algorithms predicting well simply because of specific
are vectors that are projected into this space, enabling estimates of predictor attributes (e.g., range, mean, median, and variance) or
semantic or syntactic features. Here, we compared pairs of different models that are of a specific size (number of predictors) performing
odor or perceptual descriptors, generating all pairwise similarities. well even with shuffled values. Additionally, biological data sets are
The similarity coefficient for word vectors is the Cosine similarity. often small, with stimuli or chemicals that—rather than random se-
The inverse of the coefficient is a distance; the resulting distance lection—reflect research biases, possibly leading to optimistic val-
matrix was hierarchically clustered using the Ward D2 method in R. idation estimates without the proper controls. We used the AUC
with classification-based training, such as to predict binary labels
(Active/Inactive). For classification-based training we initially con-
Support vector machine
verted the % usage into a binary label (Active/Inactive) using the
Training the SVM involves identifying a set of parameters that optimize
top 10% of the distribution as the cutoff. To provide additional con-
a cost function, where cost 1 and cost 0 correspond to training chemi-
text, we showed performance estimates varying the cutoff as well.
cals labeled as “Active” and “Inactive,” respectively (Figure 1). θ T is the
The basis for a classification-based performance metric was the often
scoring function or output of the support vector machine. If the output
top-heavy distribution of the % usage. It is for instance possibly not
is ≥0, the prediction is “Active.” The function (ƒ) is a kernel function.
as relevant for models to accurately predict chemicals with minimal
m
% usage. Rather, it is preferable for models to accurately predict
SVM cost = min C y(i) cost1 (θT f (i) ) whether a chemical will smell “Sweet” or not.
θ
i=1 To provide further clarity, we also reported multiple performance
n
1 2 metrics including the correlation between the predicted and observed
+ (1 − y(i) )cost0 (θT f (i) ) + θj % usage, the root mean squared error (RMSE), and mean absolute
2
j=1
error (MAE): RMSE: It is the square root of the mean difference
The kernel determines the shape of the decision boundary between between predicted values and those observed (% usage). It is the
the active and inactive chemicals from the training set. The RBF or average prediction error on the same scale as the target or outcome
Gaussian kernel enables the learning of more complex, nonlinear being predicted. We supplied this metric because the correlation
boundaries. It is therefore well suited for problems in which the bio- coefficient (R) is not always an accurate representation of model
logically active chemicals cannot be properly classified as a linear performance and classification of exemplar chemicals required an
function of physicochemical properties. This kernel computes the arbitrary cutoff (e.g., 90th percentile). We reported the correlation
similarity for each chemical (x) and a set of landmarks (l), where coefficient, R, between the predicted and observed % usage due to
σ 2 is a tunable parameter determined by the problem and data. The its previous use with human perceptual data. MAE: It is the mean of
similarity with respect to these landmarks is used to predict new the absolute difference between predicted and observed (% usage).
chemicals (“Active” vs. “Inactive”). It thus assigns equal weight to all prediction errors, whether large
or small.
x − l(1)
2
Gaussian kernel = exp − Ã
2σ 2 n
2
y)
(y −
i=1
RMSE =
N
Model performance metrics 1
n
The AUC assesses the true positive rate (TPR or sensitivity) as a MAE = |y − ŷ|,
n
i=1
function of the false-positive rate (FPR or 1-specificity) while varying where, ŷ = predicted and y = observed
the probability threshold (T) for a label (Active/Inactive). If the com- TP
puted probability score (x) is greater than the threshold (T), the Sensitivity = ,
TP + FN
observation is assigned to the active class. Integrating the curve pro- where, TP = true positive and FN = false negative
vides an estimate of classifier performance, with the top left corner TN
Specif icity = ,
giving an AUC of 1.0 denoting maximum sensitivity to detect all tar- TN + FP
where, TN = true negative and FP = false positive
gets or actives in the data without any false positives. The theoretical
random classifier is reported at AUC = 0.5.
ˆ∞ Results
TPR (T) = f1 (x) dx
To better clarify the physicochemical basis of diverse perceptual de-
T
scriptors, we designed a pipeline that begins with the identification
of chemical features that contribute most to perceptual descriptors,
followed by training machine-learning models to predict percepts
ˆ∞ from these features and evaluating their predictions (Figure 1a,
FPR(T) = f0 (x) dx Materials and methods). We used perceptual data from 2 human
T studies, Dravnieks (1985) and Keller (2016), conducted at different10 Chemical Senses, 2021, Vol. 46
times and with different participant demographics (Dravnieks cross-study predictions, the overall average AUC was 0.52 ± 0.07
1985; Keller and Vosshall 2016). In the study by Dravnieks (1985), (Supplementary Table 2. These results suggest that identical percep-
fragrance industry professionals rated 137 individual volatile tual descriptors across studies are predictable from a set of physico-
chemicals for 146 different odor qualities (perceptual descrip- chemical features, despite differences in study sample demographics
tors). We identified ~30 predictive physicochemical features (from and odor diversity.
Downloaded from https://academic.oup.com/chemse/article/doi/10.1093/chemse/bjab007/6153471 by Oklahoma State University (GWLA) user on 11 August 2021
DRAGON) for each of these perceptual descriptors (Supplementary We next analyzed if the descriptors within each study could be
File 1) (see Materials and methods for details). Machine-learning predicted equally well by a different descriptor model with good
models that were trained with the physicochemical features suc- classification accuracy. For the study by Keller (2016), “Bakery,”
cessfully predicted most of the perceptual descriptors as seen by which is similar to the many food-related descriptors in the study
the computational validation (Figure 1b and Supplementary Figure but differs from the rest, did not classify the 69 test chemicals as
1) (average area under curve [AUC] = 0.81, average shuffle AUC well as the percept-specific models (Supplementary Figure 2a). Of
= 0.62; t = 24.17, P < 10−55; top 50 models average AUC = 0.90, the 146 Dravnieks (1985) study descriptors, ~96% were better
average shuffle AUC =0.62; t = 55.54, P < 10–75). We also observed predicted by the percept-specific model vs “Varnish” (average
that altering the general classification cutoff from the top 10% Varnish AUC = 0.51; t = 21.65, P < 10−59) (Supplementary Figure
usage to the top 15% or 25% changes the AUC value determined 2b). However, the “Varnish” model was indistinguishable from
for different percepts (Supplementary Table 1). Specifically, of note “Chemical,” “Paint,” and “Etherish,” implying chemical features
is the increase in performance as the cutoff is lowered, suggesting are redundant in some cases. As this also suggested some descrip-
these descriptors in the study data set have fewer high scoring tors in an arbitrarily large descriptor space might be predicted
(% usage) examples for training and the high scoring chemicals may equally well by semi or even unrelated chemical feature models,
not be as physicochemically distinct as lower scoring (% usage) we studied this exhaustively (Supplementary Figure 3a). Overall,
chemicals. To remove bias because of differences in the score dis- predictions with the actual descriptor model were often statistic-
tribution, we next evaluated other metrics for the validation such ally better, even for some seemingly similar descriptors. However,
as RMSE, MAE, and correlation between predicted and observed this is not always the case, suggesting some descriptors may simply
% usage (R) (Supplementary File 2; see details in Materials and lack quality exemplar chemicals. We also tested additional, alterna-
methods, “Model performance metrics”). Since each chemical has tive methods to evaluate the descriptor models, with similar results
a complex perceptual profile, we analyzed the correlation between summarized in Supplementary File 2.
predicted and observed % usage over the validation for the full (146 Apart from these 2 semiquantitative psychophysical studies
descriptor set), which suggested good results (Supplementary Figure (Dravnieks (1985; Keller 2016), a large amount of perceptual data is
1a). Next, for a set of hidden test chemicals, the predicted olfac- available as text at various databases, some using identical or similar
tory profile over all 146 perceptual descriptors also correlated well perceptual descriptors. Although these databases are not quantita-
with the known human ratings (average r = 0.72; best predicted tive or methodical, we tested each of our 146 Dravnieks (1985) per-
chemical: r = 0.86; worst predicted chemical: r = 0.67) (Figure 1c; ceptual descriptor models on a unique set of 2525 chemicals from
Supplementary Figure 1). one such database maintained by the GoodScents company. The pre-
The study by Dravnieks (1985) used experienced human raters, dicted perceptual scores of each chemical were evaluated against the
and to generalize the utility of our approach, we next applied it to known textual data using ROC analysis (Materials and methods).
the more recent study by Keller (2016) of general public volunteers Although this task differed dramatically from previous test data sets,
(Keller and Vosshall 2016). As with the study by Dravnieks (1985), on average, the predictions compared favorably to the observed per-
perceptual descriptors for a set of 69 hidden test chemicals (Keller cepts (AUC = 0.72, t = 48.53, P < 10–15) (Figure 1e). Collectively,
et al. 2017) were also well predicted from physicochemical features these examples of predictive success within and across data sets es-
(Supplementary Figure 1b) or with multiple train/test sets from all tablish that many perceptual descriptors, even those that are seem-
476 chemicals (Supplementary Figure 1c). ingly abstract, have a physicochemical basis that can be identified.
The 2 studies, though differing significantly in methodology, To get an overview of the physicochemical basis of odor percep-
evaluated a small number of identical perceptual descriptors. It was tion, we created network representations of the relationship between
therefore possible to test whether models from the 1985 study could the percepts and the most predictive chemical features (Bullmore and
predict equivalent perceptual descriptors in the 2016 study (cross- Sporns 2009; Meunier et al. 2010; Koulakov et al. 2011; Zhou et al.
study). Prior work has performed this analysis on a small number 2018). For example, we expected that similar descriptors (“Fruity,
of overlapping chemicals using an approach involving semantic Citrus,” “Lemon,” “Grapefruit”) were best predicted by similar
similarity and chemical features (Gutiérrez et al. 2018). We focused chemical features and they would cluster together in the network
on 413 nonoverlapping chemicals and more traditional modeling (Figure 2a). Initially, we performed simple hierarchical clustering to
methods to evaluate across studies. Models for “Sweet,” Warm,” compare the distances between the perceptual descriptors based on
“Sweaty,” and “Chemical” trained on the study by Dravnieks (1985) the % usage (Supplementary Figure 4a) and then based on chem-
were successful at classifying the 413 chemicals unique to the study ical feature sets in the machine-learning models for comparison.
by Keller (2016) (Dravnieks 1985; Keller and Vosshall 2016) (Figure Although some chemical features were selected for multiple de-
1d) (average cross-study AUC = 0.73 ± 0.07, maximum AUC = scriptor models, resulting in unconventional pairings in the hierarch-
0.82 ± 0.03 for “Sweet”). As a control, we compared the cross-study ical tree relative to perceptual ratings, we observed many similarities
predictions with the Dravnieks (1985) model for a distinct percept, (Supplementary Figure 4b).
“Varnish,” which achieved good accuracy in Figure 1b and is similar We next turned our attention to the network-based visualiza-
to “Chemical” but expected to differ from the rest. Consistent with tions, reducing the chemical features down to the top 3 for 93 of
expectation, the overall average AUC using the Dravnieks (1985) the most distinct perceptual descriptors in the study by Dravnieks
“Varnish” model cross-study was 0.41 ± 0.12. When we trained the (1985) (117 features in total). Despite the limited information,
Dravnieks (1985) models on randomly shuffled labels before the distinct clusters were detectable. In general, networks using moreChemical Senses, 2021, Vol. 46 11
chemical features (top 5 or 10) were better connected (Figure 2b, Discussion
Supplementary Figure 5a). Interestingly, these networks relate well
In this study, we provided a comprehensive analysis of odor percep-
to those assembled only from human participant ratings rather
tion prediction from physicochemical features of volatile chemicals
than physicochemical information (Castro et al. 2013). Taken to-
and have supplied important groundwork to understand optimal
gether, these analyses suggested that perceptual descriptors with
methods, metrics, and approaches in modeling diverse perceptual
Downloaded from https://academic.oup.com/chemse/article/doi/10.1093/chemse/bjab007/6153471 by Oklahoma State University (GWLA) user on 11 August 2021
highly correlated % usage (e.g., descriptors that are fruit-like) may
descriptors. We do so with an additional focus on transparency and
be subtly different in terms of the most important or predictive
interpretability.
chemical features.
Of note is the finding that most perceptual descriptors are best
The human olfactory system discriminates similar smelling
predicted by chemical features that describe 3D geometries. The
chemicals and does so presumably by detecting minor differences
value of 3D information was anticipated however when considering
in key physicochemical features using an array of odorant re-
structurally similar odorants share many 2D features. To successfully
ceptors. To understand how a machine-learning algorithm might
discriminate odorant percepts, machine-learning models utilize add-
achieve such discrimination, we selected 2 groups of closely cor-
itional physicochemical properties, particularly 3D shape. In data
related perceptual descriptors, fruit-like and soot-like, and per-
sets with an arbitrarily large number of perceptual descriptors, the
formed a network analysis as before. As expected, many top
important chemical features could be redundant and cross-descriptor
physicochemical features were shared among these similar de-
predictions overlap. However, we found that, although important
scriptors, and yet separate subclusters were present (Figure 2c,
chemical features overlap, the set of descriptors for a percept and
top and bottom). Representative compounds with descriptors
the models themselves were indeed largely distinct. This would be
such as “Grape Juice” and “Peach, Fruit” are subtly different from
consistent with evidence that perceptual descriptors appear highly
each other, as are ones for “Sooty” and “Tar” (Figure 2d). When
structured and are not arbitrary (Gutiérrez et al. 2018).
examining these differences in physicochemical features, it is evi-
Although caution is required in interpreting results from the
dent how slight variations in structurally related chemicals could
Dravnieks (1985) or Keller (2016) data sets, which are small samples
result in distinct perceptual responses. We also observed this in
by typical machine-learning standards, our validations and control
an additional analysis (Supplementary Figure 5b). This suggests
analyses establish that they are nevertheless rich sources of infor-
that physicochemical information in machine-learning models can
mation for uncovering structure–odor percept relationships. The
address a complex challenge, similar to the biologically relevant
generalizability of physicochemical feature-based models across the
discriminatory task.
differing sample demographics and the mostly distinct odor panels is
An analysis of the chemical features selected for all the percep-
further evidence. To that end, we have ultimately outlined a simple
tual models suggested that the 3D structure of a chemical contrib-
pipeline that can be applied to facilitate data-driven theories about
uted significantly to predictions of odor perception, particularly the
the human olfactory perceptual space and its physicochemical ori-
3D-MoRSE (Schuur et al. 1996) and GETAWAY (Consonni et al.
gins on a considerably larger scale.
2002) chemical features (DRAGON), which are 3D representations
A handful of recent studies have used a variety of different com-
weighted by physicochemical properties that are possibly without
putational approaches analyzing similar sets of perceptual study data
precise structural interpretations (Supplementary Figure 5c). Simpler
(Keller et al. 2017; Gutiérrez et al. 2018; Nozaki and Nakamoto
2D features and functional group counts were less important but
2018; Sanchez-Lengeling et al. 2019). A direct comparison across
still among the top 10 features for some of the perceptual descriptors
these studies is somewhat limited due to differences in training and
(Supplementary Figure 5c).
evaluation chemicals, metrics used, as well as differences in data
Only a miniscule portion of the odor–chemical space has been
processing. Although this study differs in several significant ways to
evaluated for perceptual information, and this in part reflects the
others, we have attempted to place the results in context of diverse
low throughput and high cost of human studies. One approach to
odor perception prediction efforts in a tabular form which shows the
overcome this is to extend small experimental data sets to large,
benefits of each approach (Supplementary File 3). To evaluate gener-
unexplored chemical spaces. Subsequently, we predicted the 146
alizability across different studies, we also expanded our analyses on
Dravnieks (1985) study perceptual descriptors for a ~440 000
cross-study validations from 2 separate sources, where training and
chemical library (Boyle, Guda, et al. 2016; Boyle, McInally et al.
testing are performed on data from different psychophysics studies
2016) (Figure 3a, top and bottom). We evaluated ~68 million de-
(Figure 1d and e). These results suggested that models trained on the
scriptor–chemical combinations and predicted numerous (hundreds
Dravnieks data could be successfully adapted to predict percepts of
to thousands) new chemicals that smell like each descriptor. These
chemicals in the Keller study and a very different, nonexperimental
chemicals represent a massive expansion (>3000 times) of the pre-
data set in GoodScents. Although the size of the training set directly
viously known chemical space with perceptual descriptors, which is
impacts success, and models trained on more data perform better,
likely to cover a substantial fraction of putative volatile chemicals
we find that the validation rates obtained in this study are quite
with odorant properties. Ultimately, the predictions allowed us to
good relative to the size of the Dravnieks training data. Some of
create, for the first time, a comprehensive chemical space of all 146
the previous modeling efforts relied on open-source chemical feature
Dravnieks (1985) perceptual descriptors.
representations including e-Dragon, a free web interface to an early
Visualizing this massive chemical space in a 2D image is diffi-
version of Dragon and Mordred/RDKit. Analysis here used propri-
cult, so we represented only a fraction of the top predictions in the
etary geometry optimization tools such as OMEGA alongside the
form of a network (Figure 3b). We next clustered similar perceptual
full version of Dragon. When we compared different feature repre-
descriptors, highlighting the frequently occurring chemical features
sentations, it is evident that there are performance gains and losses
among the top predictions. Though the machine-learning models in-
depending on the perceptual descriptor set size (Supplementary
corporate potentially abstract chemical features, this type of analysis
File 3). Although there is no optimal approach, the tools used in
can help visualize structural features that may contribute to a certain
this study appear to improve predictions, particularly when bench-
percept (Figure 4).
marking using the same database, such as within the Keller 201612 Chemical Senses, 2021, Vol. 46
data; that is, training (407) and testing (69) on chemicals from the Supplementary Figure 4. a) Hierarchical clustering of the Dravnieks (1985)
study by Keller (2016) (Supplementary File 3). These comparisons study data by % usage. The cluster (colors) number is determined by the gap
across various modeling efforts with multiple performance metrics statistic over bootstrap samples. The distance is Euclidean. b) Hierarchical
clustering is instead performed based on chemical feature sets appearing in the
provide some insight into the top selected perceptual descriptors and
machine learning models. The distance is 1-Jaccard index, where the Jaccard
their predictability for each perceptual descriptor.
index here indicates the similarity of binary strings (1,0) specifying if a chem-
Downloaded from https://academic.oup.com/chemse/article/doi/10.1093/chemse/bjab007/6153471 by Oklahoma State University (GWLA) user on 11 August 2021
The chemical features we report for the Dravnieks (1985) per-
ical feature is or is not in the perceptual descriptor model.
ceptual descriptors are potentially a valuable resource and will likely Supplementary Figure 5. a) The 10 most important chemical (DRAGON)
benefit researchers in identifying new chemicals that smell a specific features for accurate predictions of perception (% usage) are used to build
way. Predicted compounds from the large computational screen are a network representation that shows relationships among the perceptual de-
a rich source of information about the potential human olfactory scriptors in terms of their prospective physicochemical similarity. Connectivity
chemical space. By applying machine learning alongside traditional in the network signifies shared chemical features among 93 distinct percep-
chemoinformatic tools, we suggest it is now possible to extrapolate tual descriptors and is used to infer clusters of similar perceptual descriptors
from the quality perceptual study data to large chemical spaces. We according to the Louvain algorithm. The large number of features leads to
a densely connected network but clusters detected. b) Left, discriminating
therefore anticipate that this study will provide a powerful approach
top chemicals that smell like “cherry” versus “tar,” according to Dravnieks
and resource for the discovery of new flavors and fragrances.
(1985) study respondents. The discrimination success is quantified by the
average AUC across 30 cross validation folds (10-fold CV repeated 3 times)
Supplementary material for models comprised of 1, 2, and 3 principal components (PC 1–3) that op-
timally retain information in the combined top 10 chemical (DRAGON) fea-
Supplementary data are available at Chemical Senses online.
tures (20 total). Error bars reflect the standard error. Note the 3 component
Supplementary Figure 1. a) Average correlation (R) between the predicted
model provides perfect classification. Right, exemplar chemicals for “cherry
and observed % usage for the full set of perceptual descriptors over cross val-
(berry)” and “tar” that are structurally similar but with subtly distinct chem-
idation. Dravnieks (1985) study chemicals (x-axis) are abbreviated as the CAS
ical features. c) Counts of the chemical (DRAGON) features selected in bins
identifier. b) Evaluation of chemical (DRAGON) feature models trained on the
from the top 1–10 (x–axis) for 146 perceptual descriptors with respect to the
Keller 2016 study data. Models classify 69 test chemicals (used in the DREAM
broad categories (y-axis) the features fall into.
analysis) as smelling like a given descriptor (top 10% Usage). These chem-
Supplementary Table 1. Related to Figure 1b. The average AUC is shown
icals were excluded from training and chemical feature selection. The area
for varying classification cutoffs. The % usage is transformed into active and
under the ROC curve (AUC) compares predictions to the data observed from
inactive labels according to the top end of the % usage distribution (Top 10,
the general public volunteers in that study. Chance performance is defined by
15, and 25), which changes the number of active and inactive chemicals.
training models identically but on mislabeled chemicals (shuffle). Error is the
Supplementary Table 2. Cross-Study classification performance. Dravnieks
standard deviation over 100 bootstrap samples. c) A similar analysis is done
(1985) models predict the same perceptual descriptor in the Keller 2016 study
using an alternative validation method where all 476 chemicals in the Keller
for 413 chemicals unique to the study. The area under the curve (AUC) is
2016 study are repeatedly divided into training and testing chemical sets (10-
averaged over 100 bootstrap samples. The perceptual descriptor is the model
fold cross-validation, repeated 3 times). This covers more diversity than the
used for predictions. Each descriptor is appended with “Shuffle” or “Varnish,”
69 test chemicals. Chemical features for these models were selected using a
showing the performance when the Dravnieks (1985) study model is trained
subset of the data to minimize biased validation. The predictions are aggre-
on shuffled labels for exemplar chemicals or, alternatively, the Dravnieks
gated from the support vector machine (SVM) and regularized random forest
(1985) “Varnish” model.
algorithms. Additional information on AUC calculation and its interpretation
are in Materials and Methods. Chemical feature selection methods and biases
that affect validation are also defined in Materials and Methods. Source data
Conflict of interest
supplied in Supplementary Figure 1.
Supplementary Figure 2. a) Area under the ROC curve (AUC) for classi- J.K. and A.R. are listed as inventors in patent applications filed by UCR.
fying the top 10% of usage on 69 test chemicals with chemical (DRAGON) A.R. is founder of Sensorygen Inc. that discovers novel insect repellents, fla-
features across perceptual descriptors from the 55 Keller 2016 study par- vors, and fragrances.
ticipants, averaging over dilution. The 69 test chemicals are as reported in
the DREAM analysis (Keller et al. 2017). AUCs computed from aggregated
scores of a RBF SVM and a regularized random forest. Performance of each
Data availability
perceptual descriptor model is plotted alongside performance if replacing the Data used in the analyses are publicly available from the references cited,
predictions with the “Bakery” model. Chemical features selected and models and the data generated in this manuscript are provided as Excel files in
fit on 407 training chemicals. Error (standard deviation) is over 100 boot- Supplementary Files 1–3. Any data associated with this manuscript is also
strap samples of the 69 test chemicals. b) Classification (AUC) of top 10% of available in other formats on request from the communicating author. Upon
usage for the 146 Dravnieks (1985) perceptual descriptors descriptor models request authors will make available, any previously unreported custom com-
(teal dots) compared to predictions using a top performing “Varnish” (purple puter code or algorithm used to generate results that are reported in the paper
dots) model. Perceptual descriptors colored in purple failed to outperform and central to its main claims.
“Varnish,” p > .05, adjusting for FDR (Benjamini-Hochberg). Plotted AUCs re-
flect the average of 3 RBF SVM models using different chemical features from
a pool of ~70 over 30 cross validation folds (10- fold CV repeated 3 times)
References
(RBF: Radial Basis Function; SVM: Support Vector Machine; FDR: False Ambroise C, McLachlan GJ. 2002. Selection bias in gene extraction on the
Discovery Rate). See Supplementary Figure 3 for exhaustive comparisons. basis of microarray gene-expression data. Proc Natl Acad Sci USA.
Supplementary Figure 3. a) Dravnieks (1985) study prediction perform- 99(10):6562–6566.
ance over the cross validation where the percent usage of each perceptual Boyle SM, Guda T, Pham CK, Tharadra SK, Dahanukar A, Ray A. 2016.
descriptor is predicted by the models for the other descriptors. The color is Natural DEET substitutes that are strong olfactory repellents of mosqui-
the p value adjusted for FDR (T-test). Descriptor labels are colored (red) to toes and flies. bioRxiv, doi: 10.1101/060178.
distinguish the models that are of a lower quality rather than perceptual re- Boyle SM, McInally S, Tharadra S, Ray A. 2016. Short-term memory trace
dundancy. These perceptual descriptors may fail for many reasons but notably mediated by termination kinetics of olfactory receptor. Sci Rep. 6:19863.
most are not well represented among Dravnieks (1985) study chemicals (e.g. Buck L, Axel R. 1991. A novel multigene family may encode odorant recep-
lack exemplars for classification training). tors: a molecular basis for odor recognition. Cell. 65(1):175–187.You can also read