A Road Map of Commuting in Tallinn-Harju Region - Sumba
←
→
Page content transcription
If your browser does not render page correctly, please read the page content below
A Road Map of Commuting
  in Tallinn-Harju Region
Recommendations of the Interreg BSR project SUMBA for the developement
of a transport system supporting sustainable commuting in the Tallinn-Harju
                                   region
                       Deliverable of GoA 4.1 and 4.2

                                                                   Koostanud:
                                                                    Aksel Part
                                                   MTÜ Balti Keskkonnafoorum

                                  Tallinn
                                   2021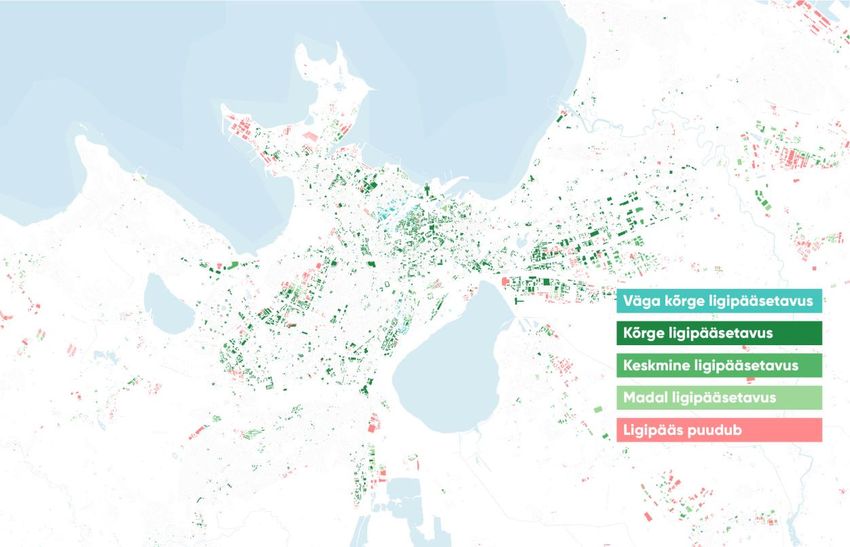
Table of Contents
1.      Introduction .................................................................................................................................... 3
2.      Background information ................................................................................................................. 4
     2.1.       Geographical area ................................................................................................................... 4
     2.2.       Parties ..................................................................................................................................... 4
     2.3.       Overview of the current situation........................................................................................... 7
        2.3.1.         Relevant development documents ................................................................................. 7
        2.3.2.         Population and housing management ............................................................................ 7
        2.3.3.         Employment and retail space ......................................................................................... 8
        2.3.4.         Developments in the near future.................................................................................... 8
        2.3.5.         Mobility demand ............................................................................................................. 9
        2.3.6.         Mobility statistics and impacts ..................................................................................... 10
        2.3.7.         Commuting statistics..................................................................................................... 12
        2.3.8.         Public transport ticketing systems and regional integration ........................................ 12
        2.3.9.         Increasing car use.......................................................................................................... 12
        2.3.10.        Mobility expenses ......................................................................................................... 15
        2.3.11.        Image of public transport and active modes of travel .................................................. 16
     2.4. An analysis of the problems with the current mobility system from the perspective of
     commuting ........................................................................................................................................ 17
        2.4.1.         Deficiencies in the regional (public) transport system ................................................. 17
        2.4.2.         Most important connections in the region ................................................................... 17
        2.4.3.         Comparison of time expenditure of five commuting routes: car and public transport 18
        2.4.4.         Travel cost comparison: car and public transport ........................................................ 19
        2.4.5.         Public transport connections and service level in the region ....................................... 19
        2.4.6.         Accessibility of the bicycle network, public transport, and buildings ........................... 21
     2.5.       Impact of COVID-19 on regional mobility ............................................................................. 24
3.      Recommendations ........................................................................................................................ 24
     3.1.       Vision..................................................................................................................................... 24
     3.2.       Mobility scenarios for the Tallinn region by 2035 ................................................................ 25
        3.2.1.         Scenario 1: ‘Samal kursil’ (‘On the Same Course’) ........................................................ 26
        3.2.2.         Scenario 2: ‘Tallinna ühistransport +’ (‘Tallinn Public Transport +’) ............................. 27
        3.2.3.         Scenario 3: ‘Tallinna liikuvus ++’ (‘Tallinn Mobility ++’) ................................................ 27
     3.3.       Priority areas ......................................................................................................................... 28
        3.3.1.         Infrastructure ................................................................................................................ 29
        3.3.2.         Organisation of sustainable cross-border mobility....................................................... 35

1
3.3.3.        Intermodality ................................................................................................................ 36
     3.3.4.        Mobility services ........................................................................................................... 38
     3.3.5.        Collection and analysis of mobility data ....................................................................... 39
     3.3.6.        Alternative energy sources ........................................................................................... 41
     3.3.7.        Integration of land use and mobility planning .............................................................. 42
     3.3.8.        Reduction of car use ..................................................................................................... 43
     3.3.9.        Communication ............................................................................................................. 45
4.   Related development documents................................................................................................. 48
5.   Involvement of parties .................................................................................................................. 49
6.   References .................................................................................................................................... 50

2
1. Introduction

This commuting roadmap offers a vision and measures for the development of sustainable
commuting in the Tallinn-Harju region. The roadmap supports the compact and human-scale
development of the Tallinn-Harju region and the overall increase in the share of sustainable
modes of travel. The reduced use of cars and the increased use of sustainable modes of
transport establish preconditions for the densification of Tallinn and the surrounding
settlements. A denser settlement improves access to necessary services, while reduced car use
makes it possible to create a human-scale urban environment that improves the inhabitants’
quality of life and provides additional opportunities for recreation and socialisation.
As a general vision, the roadmap is based on the goal of making the region’s transport system
(including commuting) sustainable without reducing the accessibility of jobs and services. This
requires comprehensive changes in both land use and mobility planning. The use of the private
car should be reduced many times over, while walking and cycling should become the main
modes of travel for everyday journeys, and longer journeys should be combined with a fast
and convenient public transport service. Only in this way will the Tallinn region be able to adapt
to the negative pressures arising from the new climate reality and the intensification of
urbanisation.
This document is broadly divided into two parts. The first part provides background
information on commuting in the region and mobility in general. The second part presents a
vision for the development of sustainable commuting with measures to support it.

3
2. Background information
    2.1.        Geographical area

The centre of the region covered in this document is Tallinn, where a large part of the region’s
jobs and services are consolidated. The Tallinn region consists of Tallinn, together with the
entirety of Harju County and Rapla and Kohila rural municipalities. The population of the region
is over 620,000 people, of which about 450,000 live in Tallinn. In addition to Tallinn, there are
seven cities (Kehra, Keila, Loksa, Maardu, Paldiski, Saue, Rapla), three towns (Aegviidu, Kiili,
Kohila), over 40 small towns, and over 400 villages in the region. Around 50,000 people live in
the region’s cities (excluding Tallinn), around 60,000 in towns and small towns, and more than
60,000 in villages. The definition of the region is based on Eurostat definition, according to
which the functional area of a city consists of the city itself and its commuting zone. The
commuting zone includes all areas around the city where at least 15% of the working
population commutes to the city on a daily basis. Particularly frequent commuting takes place
between the settlements in the immediate vicinity of Tallinn and Tallinn city, as well as
between Tallinn’s residential districts and the industrial offices located around the city. In total,
more than 110,000 people participated in two-way commuting in 2017 (Harju County-Tallinn-
Harju County: over 60,000; Tallinn-Harju County-Tallinn: 50,000) (Harju County Development
Strategy).

    2.2.        Parties

The management and planning of transport is divided mainly by administrative boundaries and
modes of transport. Within the borders of local governments, mobility is largely managed,
financed, and planned by local municipal governments. For mobility with a regional dimension,
the national level of government has a greater role to play.
There are four different public transport service systems in the Tallinn region:
    1) Tallinn city routes (buses, trams, trolleys) operated by the municipal enterprise Tallinna
        Linnatranspordi AS. The commissioning of the service is organised by the Tallinn
        Transport Department, and operating expenses are covered from the city budget.
    2) Harju County public bus routes, which are administered by MTÜ Põhja-Eesti
        Ühistranspordikeskus, established by the local municipal governments of Harju County
        and receiving operating support from the state budget.
    3) Train routes within Estonia. The service is organised by the state-owned company AS
        Elron, which receives operating support from the state budget.
    4) Commercial bus routes in Harju County, financed by carriers through ticket revenue.
Local governments are responsible for the construction and maintenance of pedestrian routes
and cycle paths within their administrative boundaries.
Public transport, pedestrian routes and cycle paths are financed as a combination of the
budget of the local government and the Ministry of Economic Affairs and Communications,

4
and the European Union’s investment subsidies. While a large part of the money for new
investments often comes from the European Union (especially for larger investments) or
through a state-level support measure, the regular administrative costs of road maintenance
and public transport are covered by ticket revenue, as well as the budgets of local governments
and the Ministry of Economic Affairs and Communications.

The major parties involved in mobility in the region are brought together by the Mobility
Council, which has been established to coordinate regional mobility. In addition, the
development of a cooperation model is planned for the near future, which would allow for the
unified planning, financing, and management of public transport in the entire region. In order
to define the exact format of the cooperation model, the Ministry of Finance will commission
a corresponding analysis.
In addition to the administrative institutions mentioned above, the relevant parties in the field
of mobility are:
    • Local governments of Harju County
    • Kohila Rural Municipality
    • Rapla Rural Municipality
    • AS Eesti Liinirongid (train operator)
    • As Eesti Raudtee (railway infrastructure owner)
    • Union of Estonian Automobile Enterprises
    • Ministry of Finance (responsible for spatial planning and EU structural funds)
    • Hendrikson & Ko (consulting company – spatial planning, local government mobility
        plans, etc.)
    • Skepast & Puhkim OÜ (consulting and engineering bureau – spatial planning,
        infrastructure)
    • K-project AS (consulting and engineering bureau – spatial planning, infrastructure)
    • Tallinn University of Technology
    • Tallinn University
    • Estonian Academy of Arts
    • Urban Lab
    • Estonian Urban Cyclists Union

Ticket revenue and operating expenses
The operating expenses of the city routes in Tallinn significantly exceed the ticket revenue,
primarily due to the free travel right established for all city residents. The need for subsidies
has been growing year by year and was already significant before the introduction of the free
travel right (in 2013).

5
Table 1.1. Change in Tallinn’s public transport operating costs and ticket revenue 2011–2019. Source:
Tallinn in Figures 2019; Tallinn Mobility Plan.
                   2011       2012     2013      2014     2015      2016       2017    2018 2019
 Ticket            16.42      16.17    3.76      3.36     3.73      3.83       4.08    4.63   4.08
 revenue, EUR
 MM
 Operating         49.15      51.19    55.58     59.93    63.53     66.16      67.70   71.37 71.7
 expenses,
 EUR MM

Ticket revenue (and the number of users) for public bus routes in Harju County grew steadily
until 2017. It decreased in 2018, when the right to free travel was introduced for everyone
aged 0–19 and 63+.

Table 1.2. Harju County public bus routes from 2012–2018. Source: Tallinn Mobility Plan.
               2012       2013          2014        2015       2016         2017              2018
 Ticket        2.052      2.327         2.475       2.832      3.169        3.437             3.062
 revenue,
 EUR MM
 Number        2.298      2.300         2.534       2.860      3.167        3.499             4.173
 of trips,
 MM
 Line          4.434      4.901         5.383       5.790      6.277        6.582             7.368
 mileage
 MM
 routes per
 km
 Ticket        0.89       1.01          0.98        0.99       1.00         1.02              0.73
 revenue
 per
 passenger
 (EUR per
 ride)
 Allocation, 3.068        2.605         2.7         2.8        2.9          3.069             4.028
 EUR MM

Ticket revenue and operating expenses for train traffic in the Tallinn region are not available separately
for the region; it is known that less than half of operating expenses are covered by ticket revenue. In
general, the availability of trains in Harju County and, therefore, also ticket revenue has grown strongly
year by year. The number of travellers on Tallinn commuter trains increased by 86% from 2013–2017.
There is no systematic overview of ticket revenue and operating expenses of commercial bus routes
operating in Harju County.

6
2.3.       Overview of the current situation
    2.3.1. Relevant development documents

At the national level, mobility is guided by the National Transport and Mobility Development
Plan for 2021–2035. Compared to the previous development plan, the topic of sustainable
mobility is much more prominent. Nationwide, the development of rail transport and the
introduction of alternative fuels are prioritised. With regard to urban mobility, the importance
of multimodality is emphasised and the development of sustainable mobility infrastructure and
traffic calming are supported. National integration and improvement of public transport
services are also important. At the same time, road development remains the highest priority,
at least in terms of investment costs. There is also a disproportionate emphasis on the use of
alternative fuels and smart mobility solutions, given the impact of the measures on greenhouse
gas emissions.
At the regional level, the development strategy of Harju County includes development trends
in the field of mobility. It establishes the key measures needed to develop public transport,
intermodality, and active modes of travel at the national, regional, and local level. At the same
time, however, considerable emphasis has been placed on improving road traffic conditions,
especially the construction of large infrastructure projects. Another important document is the
development plan of the North-Estonia Public Transport Centre, which sets out in some detail
the development directions needed to increase the number of travellers on regional buses in
Harju County. Terms and responsible institutions have also been established. The most
important recommendations are, for example, the integration of the route network and the
implementation of a single ticketing system throughout the region.
At the level of Tallinn, an important role is played by the Tallinn Mobility Plan. It describes the
current major mobility challenges and proposes the necessary courses of action to address
them. The main directions proposed include more compact land use, an urban environment
that supports active mobility, and better organised public transport. In addition, mobility is
addressed in the Tallinn Development Strategy ‘Tallinn 2035’, which is largely based on the
Tallinn Mobility Plan on the strategy and goal level. Therefore, it focuses on the development
of sustainable modes of travel quite thoroughly. The Tallinn Cycling Strategy 2018–2027 sets
targets for increasing the share of bicycle use in Tallinn and provides the network of cycle paths
and basic requirements for the design of bicycle infrastructure.

    2.3.2. Population and housing management

The population of the Tallinn region is over 620,000 and the current growth trend can be
expected to continue in the coming years. Within the region, the population is concentrated
in Tallinn and its immediate rural municipalities (Viimsi and Rae, Harku and Kiili municipalities),
while the population of more remote local governments is growing more slowly or is even
decreasing. In Estonia as a whole, the population is shrinking and aging. These trends have a
smaller impact in the Tallinn region than elsewhere, but here, too, a significant aging of the

7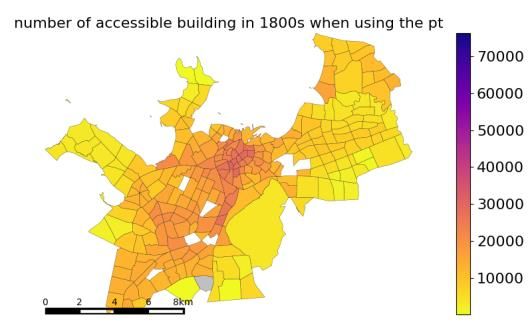
population is forecast for 2040, while the population will remain roughly the same or decrease
slightly. The aging of the population in Tallinn and its surrounding rural municipalities can be
expected to a lesser extent than in the more remote rural municipalities of the region.
The growing population causes a continuing high demand for new real estate developments,
both in Tallinn and its vicinity. In the early 2000s, as a result of this pressure, many new
developments were built near Tallinn in areas where there were largely no public services and
mobility solutions. This facilitated suburban sprawl and car based commuting in the Tallinn
region. Today, the construction of such new developments has decreased considerably, as
local governments have changed their planning practices and people’s demands on their living
environment have increased. However, there is still room for improvement in land use and
transport planning coordination.

    2.3.3. Employment and retail space

As of 2018, the share of the working age population in Harju County was 71% of the total
population. In turn, 74% of them were employed – this is a higher share than elsewhere in
Estonia.
In the Tallinn region, jobs are very clearly concentrated in Tallinn and, more recently, in the
surrounding rural municipalities. Most of the employed in the neighbouring rural municipalities
work in Tallinn (50–80%), while about a fifth of those employed in Tallinn work outside Tallinn.
In the most remote rural municipalities of the region, 15–45% of the employed work in Tallinn.
In 2017, more than 60,000 people commuted to Tallinn from outside Tallinn on a daily basis
(Harju County Development Strategy). While different types of jobs have been concentrated
in Tallinn for a long time, a more recent trend is the development of logistics and industrial
parks in the vicinity of Tallinn. In addition to traditional commuting (from the immediate vicinity
to Tallinn), this development has also increased commuting from Tallinn to neighbouring
municipalities.
The retail space in the Tallinn region is largely concentrated in shopping malls, which are
located in different locations throughout the city, but are especially common in the city centre
and on the outskirts of the city.

    2.3.4. Developments in the near future

New developments are still planned on a large scale both in Tallinn and elsewhere. The
following are the major potential developments in the next 10–15 years that will affect the
functioning of the current transport system (the list is not exhaustive):
    • Harku Rural Municipality
           o 1500–2000 new living spaces in the Tabasalu commuting corridor
           o 500 new living spaces in the Paldiski commuting corridor
    • Rae Rural Municipality
           o 300 new living spaces per year

8
o    Ski resort as a potential tourist attraction
            o Driving school centre
    •   Saue Rural Municipality
            o New development of Vanamõisa (2000–3000 new living spaces)
    •   The growth potential of Tallinn is estimated at 1000 living spaces and 1000 m2 of office
        space per year
            o The number of trips made by car in the North Tallinn region may increase
                2.4 times if all planned developments are built and modal share trends do not
                change
    •   Lasnamäe Hospital
    •   Rail Baltic terminal
    •   Both the Tallinn gate and trade developments at the far end of Rae Rural Municipality
        (former detailed plans that may be placed back on the table) would each generate an
        estimated 2000 cars per hour between themselves and Tallinn
    •   School locations and accessibility (550 students per school)
            o Jüri
            o Tabasalu
            o Laagri

    2.3.5. Mobility demand

Transport demand is boosted by several different, albeit interrelated, developments in the
Tallinn region.
    1) The population is growing. The population of Harju County has grown very quickly in
        recent years, and this trend is likely to continue in the near future.
    2) Jobs are concentrated in the city centre, industrial parks, and industrial offices on the
        outskirts of the city. Such concentration creates greater transport demand, as
        concentration in certain places means that jobs are becoming increasingly distant from
        the majority of the population.
    3) Incomes are generally growing. As a result, it will increase the demand for road
        transport in particular, as people in the lower income quartiles are increasingly able to
        own several cars. The use of cars has increased the most among them in recent years
        (Tallinn Mobility Plan 2019).
    4) At the same time, lower-paid jobs are largely concentrated in peri-urban industrial
        areas, to which there are few alternatives to car use. This trend is boosting car use and
        increasing mobility poverty. Commercial activities are also largely concentrated in
        shopping centres requiring the use of cars, meaning that you have to use a car and
        drive quite far in order to visit a shop. Settlement patterns are perhaps the biggest
        driver of transport demand. In recent decades, Tallinn has expanded strongly to the
        surrounding former farmland, the inhabitants of which have to travel relatively long

9
distances on a daily basis. According to Statistics Estonia, the distances covered in the
region have increased over the last 20 years, especially for people living outside Tallinn.
2.3.6. Mobility statistics and impacts
The modal distribution of the region is clearly dominated by car use. Over the last twenty years,
the use of cars has grown strongly, while the use of other modes of travel has either decreased
or increased very little.
Employed residents of Tallinn by
transport modes to work; in thousands
Jalgsi
By foot
140,0
120,0 By bicycle, moped,
Jalgratta, mopeedi,
100,0 motorcycle
mootorrattaga
80,0
Autoga
By car
60,0
40,0
Ühissõidukiga
By public
20,0 transport
0,0 Works at
Töötab home;
kodus, worksja
töötab
and stays
ööbib in the
samas same
kohas
place
Figure 2.1. Number of employed residents of Tallinn by transport mode to work from 2000–2019; in
thousands
Main transport mode to work for
residents of Tallinn in 2019, %
3.9
12.3
1.5
Jalgsi
By foot
36.2 Jalgrattaga
By bicycle
Autoga
By car
By public
Ühissõidukiga
transport
Töötab
Works kodus
at
home
46.1
Figure 2.2. Modal share of Tallinn in 2019 by transport to work
10Employed residents of Harju County
(except for Tallinn) by transport mode
to work; in thousands
70,0 By foot
Jalgsi
60,0
50,0 Jalgratta, mopeedi,
By bicycle, moped,
40,0 mootorrattaga
motorcycle
30,0 By car
Autoga
20,0
10,0 By public transport
Ühissõidukiga
0,0
Töötab
Works atkodus,
home;töötab
works and
jastays in the
ööbib samekohas
samas place
Figure 2.3. Number of employed residents of Harju County (except for Tallinn) by transport mode to work
from 2000–2019; in thousands
Main transport mode to work for
residents of Harju County (except
for Tallinn) in 2019, %
4.8 9
14 2.3
By foot
Jalgsi
Jalgrattaga
By bicycle
Jalgrattaga
By car
Autoga
Autoga
By public transport
Ühissõidukiga
Works at
Töötab kodus
home
69.8
Figure 2.4. Modal share of Harju County (except for Tallinn) in 2019 by transport to work
Due to the rapid growth of car use in the Tallinn region, the negative effects of transport are
experiencing a clear growth trend. In 2019, parking spaces in Tallinn covered a total area of
12 km2 (Tallinn Mobility Plan 2019). CO2 emissions from transport have been steadily
increasing, and the same applies to energy consumption. While total greenhouse gas emissions
by transport in Tallinn in 2007 amounted to 682 CO2 equivalent kilotonnes and energy
consumption to 2590 GW/h, in 2015, these indicators were already 853 and 3224, respectively.
Fine particles, which come mainly from transport, are responsible for the premature death of
approx. 300 people each year in Tallinn. Obesity is also a growing problem among the
11population, exacerbated by car use. The number of traffic accidents and those injured in them
has increased in Tallinn and Harju County over the past seven years, while the number of
fatalities has slightly decreased. The main problem is ensuring the safety of pedestrians and
cyclists by designing the street space accordingly, which also includes techniques for traffic
calming. Also, people tend to fall a lot due to slipperiness, which indicates poor winter
maintenance of pavements.
2.3.7. Commuting statistics
The main reasons for commuting are going to and coming from work or school. According to
the national Transport Administration, in 2018 almost 175,000 cars crossed the border of
Tallinn each day. That is 28,000 more cars than in 2012.
In 2017, nearly 50,000 people from the rural municipalities of Harju County commuted to
Tallinn by car and more than 11,000 people by public transport (Harju County Development
Strategy). These statistics are supplemented by commuters from Tallinn to Harju County and
Rapla County, and their number has increased rapidly in recent years because of the
concentration of industrial office work in the vicinity of Tallinn. Almost a fifth of the employed
in Tallinn (approximately 50,000 people) work outside Tallinn (Harju County Development
Strategy).
2.3.8. Public transport ticketing systems and regional integration
There are four different public transport systems in the Tallinn region: city routes (which in
turn are divided between buses, trolleys, and trams), trains, county public bus routes, and
commercial bus routes. The combined ticketing system and payment method apply to city
routes: payment is made with a bus card, and the use of city routes is free of charge for all
residents of Tallinn. The city’s ticketing system has recently been extended to other modes of
public transport. The payment method for the county routes is the same, but the ticketing
system is different. When traveling by train, it is possible to pay with the city’s public transport
card, and within Tallinn, city residents can also travel for free, but starting from the city limits,
Tallinn residents must also pay for the trip. The most problematic are commercial lines with a
completely separate payment and ticketing system.
2.3.9. Increasing car use
The number of cars in households has been constantly growing. In Harju County, especially in
the neighbouring rural municipalities of Tallinn, this indicator is even higher than in Tallinn.
12Number of
cars per
household
Total
Size of household
Household with 1 member
Household with 2 members
Household with 3 members
Household with 4 members
Household with 5 or more members
Type of household
Family with children
Family without children
Income per family member
Up to EUR 400.00
EUR 400.01–700.00
EUR 700.01 or above
None; refuses to answer
Type of housing
Private house or terraced house,
semi-detached house
Apartment building
Figure 2.5. Car ownership in Tallinn by size and type of household, type of housing, and income. Source:
Strategy on sustainable modes of travel in the Tallinn region 2035; Survey of modes of travel of people
living in Tallinn 2015. EMOR 2015
13Figure 2.6. Presence of a car in the household (% of households with one or more cars in use) and average number of cars in the household by district of Tallinn. Source: Strategy on sustainable modes of travel in the Tallinn region 2035; Survey of modes of travel of people living in Tallinn 2015. EMOR Figure 2.7. Presence of a car in the household (% of households with one or more cars in use) and average number of cars in the household in Harju County. Source. Strategy on sustainable modes of travel in the Tallinn region 2035; Survey of modes of travel of people living in Tallinn 2015. EMOR 14
2.3.10. Mobility expenses

Mobility expenses increase mainly due to increased time expenditure and lengthening of
distances. This trend is especially noticeable for the employed living outside Tallinn, who
amount to more than half of the commuters in the whole region. The development of public
transport in recent decades has not been able to keep pace with rapid urban sprawl, which is
why the rapidly growing commuting has become largely car-based. This has increased the
traffic load in the region and, therefore, the average travel time for both drivers and public
transport users. Without a drastic change in the region’s modal share, the projected continued
growth of the region’s population and car use is likely to further increase mobility expenses in
the future.

            Average distance between place of
              residence and place of work for
           residents of Tallinn and Harju County,
                      km 2000–2019
 20,0

 15,0

 10,0                                                                  Harjumaa
                                                                       Harju County

     5,0                                                               Tallinn

     0,0
           2000

           2019
           2001
           2002
           2003
           2004
           2005
           2006
           2007
           2008
           2009
           2010
           2011
           2012
           2013
           2014
           2015
           2016
           2017
           2018

Figure 2.8. Average distance between place of residence and place of work for residents of Tallinn and
Harju County from 2000–2019, km. Source. Statistics Estonia

           Average time for moving from home to
           work for residents of Tallinn and Harju
                County, minutes 2000–2019
 40,0

 30,0

 20,0                                                                    Harju County
                                                                         Harjumaa
 10,0                                                                    Tallinn

     0,0
           2016
           2000
           2001
           2002
           2003
           2004
           2005
           2006
           2007
           2008
           2009
           2010
           2011
           2012
           2013
           2014
           2015

           2017
           2018
           2019

15
Figure 2.9. Average time for moving from home to work for residents of Tallinn and Harju County (in
minutes) from 2000–2019 Source. Statistics Estonia
The problem of mobility poverty has also become increasingly relevant in the region. The
relocation of industrial parks from Tallinn to areas poorly connected to public transport is
forcing lower-income earners to increasingly rely on cars and incur additional costs. Across the
entire region, the total annual cost of car use amounts to approximately EUR 1.4 billion (Tallinn
Mobility Plan 2019).
4th quartile
3rd quartile
2nd quartile
1st quartile
Figure 2.10. Distribution of Tallinn residents commuting by car by wage quartile. Source. Tallinn Region
Urban Mobility Strategy 2035, Statistics Estonia
2.3.11. Image of public transport and active modes of travel
Various surveys conducted in Tallinn and Harju County indicate that, in general, satisfaction
with public transport in the region is relatively high. People are the least satisfied with the
frequency, routes, and transfer options offered by public transport. The latter problem is more
acute for the residents of Harju County. Other important concerns for residents of Tallinn are
vehicle hygiene and overcrowding. The most common barriers to the use of public transport
are unsuitable routes, considerable time expenditure, inconvenience (more common in
Tallinn), and poor transfer options (more common in Harju County).
The share of cycling in commuting in the Tallinn region is very small. The main reasons for not
using bicycles are long distances (especially in Harju County), bad weather, time expenditure,
and inconvenience. Incomplete and unsafe infrastructure is also an important barrier.
Walking is not considered separately here, as in the case of commuting, the distances and time
spent walking are usually too great. However, walking conditions are important to increase the
use of public transport and intermodal mobility solutions.
Among the residents of Harju County, women, middle-income people, and people who often
visit Tallinn would be more likely to exchange cars for public transport or bicycles.
162.4. An analysis of the problems with the current mobility system from the
perspective of commuting
2.4.1. Deficiencies in the regional (public) transport system
Due to the administrative division, public transport systems are fragmented, which has led to
an illogical route network and an uneven level of mobility hubs in terms of multimodality. The
construction of bicycle parking lots at bus and train stops takes place on a per project basis and
requires an active and interested local government. A single mobility organisation or other
model of cooperation across the region is needed to develop integrated solutions and
harmonise standards. Similarly, cooperation between municipalities in land use planning
should be intensified, which is currently producing solutions that promote car use. This issue
would also benefit greatly from a regional mobility organisation. The network of cycle tracks is
intermittent and does not connect logically across local government borders.
2.4.2. Most important connections in the region
The Tallinn border crossing points with the highest traffic density are on Pärnu Highway,
Peterburi Road, and Tartu Highway. Most of the traffic on these routes is made up of
commuters from Saue, Saku, Kiili, Rae, Jõelähtme, and Kose rural municipalities, and from the
cities of Maardu and Keila. There are still a very large number of commuters coming from Viimsi
and Harku rural municipalities, but the traffic flow from them is distributed across several
routes (the largest connections are Paldiski Highway and Viimsi Road).
Randvere Road
Suur-Sõjamäe
Männiku Road
Viljandi Highway
Paldiski Highway
Viimsi Road
Rannamõisa Road
Tartu Highway
Peterburi Road
Pärnu Highway
Figure 2.11. Change in traffic frequency on the border of Tallinn, 2012 and 2018. Source: Tallinn Region
Urban Mobility Strategy 2035, Transport Administration
Of the largest starting points for commuting, the share of commuters is the lowest from Viimsi,
Saku, and Kose rural municipalities (approximately 11% in all). Public transport also plays a
17relatively small role in commuting from Harku Rural Municipality (14%), although the situation
is slightly better in Rae Rural Municipality (20%) and Saue Rural Municipality (19%). The
situation is best in Kiili (29%), Keila (26%), and Maardu (23%).
Figure 2.12. Number of commuters by car (red) and public transport (green) from Harju County’s rural
municipalities to Tallinn in 2017. Source: Tallinn Region Urban Mobility Strategy 2035, Kantar Emor 2017
2.4.3. Comparison of time expenditure of five commuting routes: car and public transport
Trip lengths and durations are measured using the Google Maps application during weekday
peak hours.
1) Ülemiste City–Viimsi settlement centre
By car (distance 14.5 km): 22–40 minutes depending on traffic
By public transport: 56 min (one transfer)
2) Freedom Square–Jüri settlement (Rae Rural Municipality)
By car (distance 15.4 km): 20–40 minutes depending on traffic
By public transport: 33 minutes
3) Kristiine shopping centre–Saue settlement (Saue Rural Municipality)
By car (distance 19.8 km): 22–45 minutes
By public transport: 32 minutes (train)
4) Tallinn University of Technology – Tabasalu settlement (Harku Rural Municipality)
By car (distance 11.3 km): 18–30 minutes
By public transport: 28 minutes
185) Telliskivi Creative City–Saku settlement (Saku Rural Municipality)
By car (distance 18.3 km): 22–45 minutes
By public transport: 44 minutes
For these example routes, the car is generally faster, although in most cases public transport
is more or less competitive in terms of trip duration. Compared to a car, it takes on average 10
minutes longer for residents of Tallinn and almost 20 minutes longer for residents of the rest
of Harju County to travel to work by public transport. With these figures, it must be borne in
mind that connections for current public transport users are likely to be better than for current
car users, so in fact the time difference between car and public transport is greater, as people
tend to use the car in areas with the poorest public transport connection.
2.4.4. Travel cost comparison: car and public transport
In Tallinn and Harju County, the average total cost of car use is EUR 0.3 per km (Tallinn Mobility
Plan). It includes the purchase, leasing, fuel, repair, and other costs of the car. According to
data from Statistics Estonia, the average distance from the place of residence to work in Tallinn,
as of 2019, was 7.9 km, and 18.6 km elsewhere in Harju County. Therefore, travelling to work
by car (one way) in Tallinn costs on average about EUR 2.40 and elsewhere in Harju County
EUR 5.60.
City residents have a free right to travel on Tallinn routes. The ticket price for other passengers
is EUR 1.50. On county routes in Harju County, the ticket price is between EUR 0.72 and EUR
1.60, depending on the payment method and the duration of the ride. A train ticket within the
Tallinn region generally does not cost more than EUR 3. For most employed people in the
region, commuting by public transport should be much cheaper than by car. Even when
combining county routes or train and city routes, the total cost is likely to be lower than when
using a car. Especially since these calculations only take into account the prices of a single
ticket. When using a public transport ticket purchased for a longer period, it is even cheaper.
2.4.5. Public transport connections and service level in the region
Due to the urban sprawl that arose during the economic boom and the recent relocation of
jobs to Tallinn’s neighbouring rural municipalities, a settlement pattern has developed in the
Tallinn region that does not favour the use of public transport in many places. The level of good
public transport connections is not guaranteed in several densely populated areas (see Figures
2.12, 2.13, 2.14). An area with good public transport connections is considered to be an area
at most 400 m from a public transport stop with an average of at least 10 departures per hour.
The potential of train traffic, the stops of which are relatively sparsely populated, has been
least exploited.
19Figure 2.12. Number of housing units located in a poor public transport service area. Source: Tallinn
Region Urban Mobility Strategy 2035, Raul Kalvo 2019.
Very high access
High access
Average access
Low access
No access
Figure 2.13. Location of residence and level of public transport service, 2019 (red marks poor and green
marks good public transport connections in terms of location of residential buildings). Source: Tallinn
Region Urban Mobility Strategy 2035, Raul Kalvo 2019 (Land Board, Estonian Road Administration
(GTFS), OpenStreetMap)
20Very high access
High access
Average access
Low access
No access
Figure 2.14. Location of companies and level of public transport service, 2019 (red marks poor and green
marks good public transport connections in terms of location of workplaces). Source. Tallinn Region
Urban Mobility Strategy 2035, Raul Kalvo 2019 (Land Board, Estonian Road Administration (GTFS),
OpenStreetMap)
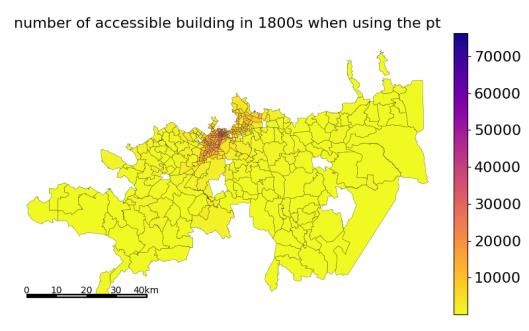
2.4.6. Accessibility of the bicycle network, public transport, and buildings
Accessibility is a metric indicating the number of jobs and various kinds of services available
from a certain place during a certain period of time. It is measured by mode of travel and
different service, for example, the accessibility of schools by bicycle in 20 minutes can be
measured. In the Tallinn region, accessibility has been insufficiently measured. The only data
on accessibility come from the accessibility study prepared as part of the SUMBA project,
which, according to the authors, was not sufficient to carry out a thorough analysis. However,
the study provided preliminary results from which to draw some conclusions.
Accessibility of public transport: the study measured the accessibility of public transport stops
by foot and bicycle. These measurements were based on distance only, without taking into
account the availability and/or condition of the infrastructure or the number of public
transport lines passing through the stops. When only measuring the distance and taking all the
stops into account, the accessibility of public transport in the Tallinn region by foot and bicycle
is quite good (see Figure 2.15); however, when considering the condition of the infrastructure
and the frequency of public transport connections, the situation is probably worse, especially
in the case of bicycles, as the cycling infrastructure in the Tallinn region is generally insufficient
and poorly designed.
21Figure 2.15. Average access time to the nearest public transport stop by walking (left) and cycling (right) in Tallinn (top) and Harju County (bottom). Source. SUMBA study ‘Accessibilities in Tallinn/Estonia’, Daniel Krajzewicz Accessibility of buildings: the second measurement of accessibility was based on the number of buildings available in half an hour. Such a measurement does not provide much information on accessibility in absolute terms; however, it does allow for a comparison of different transport modes. The study found that within a period of 30 minutes, the number of buildings accessible by bicycle is much higher than by public transport or by foot. Again, only distances are taken into account here, not real infrastructure, so the actual accessibility by bicycle is probably a bit worse. However, this shows that the distances in Tallinn are short enough to ride a bicycle and that public transport in the Tallinn region is currently too slow to be competitive with cycling, let alone car use (the measurements of car use in the study were too inaccurate to compare them with other indicators). 22
Figure 2.16. Number of buildings accessible within 30 minutes in Tallinn by foot (top left), by bicycle (top
right), and by public transport (below)

Figure 2.16. Number of buildings accessible within 30 minutes in Harju County by foot (top left), by
bicycle (top right), and by public transport (below).

23
2.5.      Impact of COVID-19 on regional mobility

The COVID-19 epidemic has significantly affected mobility in the Tallinn region and its effects
may be long-lasting. Although no large-scale mobility studies have been carried out in the
region since the first outbreak of the coronavirus, it is known that the spread of the coronavirus
has reduced public transport use and increased car use, at least as a proportion of all
movements if not in absolute terms. This trend is concerning because, although the immediate
effects of the virus are temporary, it may be difficult to change developed habits at a later
stage. Therefore, the recovery of the number of public transport users following the
coronavirus epidemic must be monitored. In all likelihood, it will not automatically return to its
previous level, so it would be useful to use communication and other measures to contribute
to recovering the number of public transport users.
For public transport, the time of the coronavirus is a serious challenge, as ticket revenues are
significantly reduced, while the spread of the virus places additional demands on the service
standard of public transport services (e.g. disinfection), which in turn increases costs. These
developments may put downward pressure on the level of public transport services, which
must be resisted and, if necessary, temporary additional funding for public transport must be
ensured.
In many regions of the world, wider pavements and new temporary cycling infrastructure have
been built to adapt to the coronavirus epidemic, as well as other measures to encourage the
use of active modes of transport. This allows former public transport users to avoid using a car,
spares the mental health of residents in isolation, and also promotes a change in transport
habits among car users. Unfortunately, so far (January 2021) no similar measures have been
implemented in the Tallinn region. However, this should definitely be done in the near future,
as such measures will help reduce the negative impact of the coronavirus on achieving
sustainable mobility goals.

     3. Recommendations
     3.1.      Vision

In the Tallinn-Harju region, the necessary services are easily accessible to people. This is
ensured, on the one hand, by an exemplary cross-border public transport system with cycling
and walking infrastructure and, on the other hand, by land use, which has brought the spatial
development of the region closer to existing urban settlements and public transport routes. As
a result of these developments, people have started to use sustainable transport modes much
more for their daily trips, and car use has decreased significantly. Longer distances are mostly
covered by public transport, shorter ones by foot or bicycle. Combining bicycle and public
transport on the same route is also very common. As a result, Tallinn, in cooperation with the

24
surrounding settlements, provides residents with an excellent urban environment where the
interests of pedestrians and cyclists are clearly prioritised.
Vision goals:
1. By 2025, at least 50% of daily trips in the Tallinn city region will be done by public
transport, by foot or by bicycle. This figure will rise to at least 70% by 2035.
2. According to the Covenant of Mayors, greenhouse gas emissions from transport in the
Tallinn region will decrease by 40% compared to 2007, i.e., the CO2 emissions of the
city of Tallinn will be a maximum of 550,000 tonnes in 2025 and 390,000 tonnes in
2030. The combined CO2 emissions of Tallinn and Harju County in 2035 will amount to
a maximum of 930,000 tonnes.
3. The Tallinn region is covered by an excellent public transport network. This means,
among other things, a single regional ticketing system and integrated route network,
as well as a network of convenient mobility hubs.
4. Networks of pavements and cycle paths with good coverage have been built both
within the city and across municipal boundaries.
5. Pavements, public transport stops, and the main bicycle network are accessible to
everyone (including the elderly and, in the case of pavements and public transport
stops, to the disabled) throughout the year, and 90% of schoolchildren can make their
daily movements independently.
6. Convenient mobility services have been developed and are widely used in the Tallinn
region, simplifying the combination of different modes of transport on a single route.
The most popular of these are the bicycle sharing service covering the entire region
and the multimodal travel planner.
The commuting roadmap presented in this document provides input to relevant institutions to
shape transport policy in the coming years, starting with the commuting action plan
accompanying the roadmap, which sets out the first agreed steps in realising the vision of the
roadmap.
3.2. Mobility scenarios for the Tallinn region by 2035
The following describes three future scenarios adapted from the Tallinn Mobility Plan, which
help to assess the impact of the activities presented in this roadmap on the mobility of the
region. The scenarios only include commuting to and from work as the main drivers of mobility
demand during peak hours. The ‘Samal kursil’ (‘On the Same Course’) baseline scenario
assumes the continuation of the current trends. In the alternative scenarios, the final states of
the region by 2035 were determined through key indicators of mobility and transport policy
(back-casting methodology). ‘Tallinna liikuvus ++’ (‘Tallinn Mobility ++’) is based on the vision
goals established in the Mobility Plan (and as adapted in this roadmap), while ‘Tallinna
ühistransport +’ (‘Tallinn Public Transport +’) sets slightly less ambitious targets.
25Car Public transport Walking Bicycle
Tallinna liikuvus
++ (Tallinn
Mobility ++)
Tallinna
ühistransport +
2035 (Tallinn Public
Transport + 2035)
Samal kursil
2035 (On the
Same Course
2035)
Figure 3. The main transport mode for travelling to work in Tallinn and Harju County in 2003 and 2018,
and in 2035 in the event of different scenarios. Source: Tallinn Region Urban Mobility Strategy 2035,
Statistics Estonia
3.2.1. Scenario 1: ‘Samal kursil’ (‘On the Same Course’)
The growing population and income in the region, together with the current settlement
pattern and infrastructure solutions, will ensure the continued growth of car traffic. The
number of cars per 1000 people will increase from the current 450 cars to 550 cars, and the
total number of cars in the region will, therefore, increase by up to 100,000 vehicles. This trend
is being responded to by expanding car infrastructure, and one way to cover the growing
investments is to borrow funds. Increasing car use precludes a reduction in greenhouse gas
emissions from transport in the region. Traffic noise is increasing and sedentary lifestyles are
intensifying, and the increasingly stringent targets for improving ambient air quality and
reducing greenhouse gas emissions are not being met. Due to transport in the Tallinn region,
it may be necessary to purchase additional CO2 emission quotas, depending on the price of the
quota, in the amount of EUR 15–25 million per year.
Growing congestion increases travel time and reduces the competitiveness of public transport.
Public transport management continues to be largely uncoordinated in several parts of the
region. The independent movement of children and the elderly is declining, and public
transport is mainly used by students, pensioners, and the unemployed. The number of
intermodal movements remains low due to the lack of convenient mobility hubs and integrated
transport systems. The number of users of short-term rental of scooters and cars is growing,
but in other respects mobility services remain undeveloped. New developments will continue
in areas with poor public transport connections.
263.2.2. Scenario 2: ‘Tallinna ühistransport +’ (‘Tallinn Public Transport +’)
In this scenario, the establishment of suitable infrastructure for cars will be continued, and in
addition to this, more will be invested in the development of public transport. Car traffic
continues to grow, increasing congestion and the time spent using cars in the region.
Investments in public transport will increase the average speed of public transport and slow
down the growth of car traffic by keeping the peak traffic load at the current level. The number
of cars in the region will increase to about 500 vehicles per 1000 people and will start to
decrease in the long run.
The number of trips made by public transport will increase by 25%. There will be investments
in the new (tram) connections and connection speeds. Thanks to the improvement of
connection speeds, movement within the City Centre and the number of commuters from
Harju County to Tallinn by public transport is growing rapidly. To facilitate commuting, a single
ticketing system and route network and mobility services will be set up in the region. The
network of convenient mobility hubs to be built will make intermodality more attractive. High-
quality pavements and cycle networks will also be built around public transport stops, further
promoting intermodality.
Land use planning continues without coordination with transport system planning. At the same
time, the market is, to some extent, directing new developments close to existing good public
transport connections.
Compared to the baseline scenario, society’s mobility costs could be reduced by 15% (by EUR
300 million per year). However, passenger car costs would increase by 25% in the region. CO2
emissions could be reduced compared to the current levels, but additional allowances are still
expected to be purchased for around EUR 16 million per year.
3.2.3. Scenario 3: ‘Tallinna liikuvus ++’ (‘Tallinn Mobility ++’)
In this scenario, car traffic will continue to grow more slowly until 2025. After that, the
proportion of public transport and cycling starts to increase, while vehicle mileage decreases
by 10%. By 2035, there will be 360 cars per 1000 people in the Tallinn region. Investments in
the development of sustainable transport modes and appropriate land use planning create a
situation where 70% of the region’s inhabitants walk, cycle, or use public transport for their
daily trips. Various combinations of these transport modes are also popular in commuting.
Mobility planning and investments will focus on creating suitable conditions (including
infrastructure) for public transport, cycling, and walking. A safe and attractive network of cycle
paths will be built, which can be used comfortably and safely by both 8- and 80-year-olds.
Pavements and cycle paths are well maintained throughout the year.
27A unified zone-based ticketing system and integrated route network will be established in the
region, and all public transport services will be planned and financed jointly in the region. Tram
lines connecting Tallinn’s neighbouring rural municipalities will be built, and a network of
mobility hubs will be built for convenient transfers. The mobility hubs also bring together
mobility services that are uniformly organised in the region, the most important of which is the
bike share service covering the entire region.
New developments, jobs, and institutions will be built in areas with excellent public transport
and cycling connections. With the growing attractiveness of public transport and cycling
throughout the region, there is also a growing demand for such land use.
Instead of fuel excise duty, a differentiated approach to car taxation is applied: peak hours,
CO2, and parking charges are applied to cover the maintenance costs of existing high-quality
infrastructure. In addition, there is a systematic use of traffic calming measures in urban
settlements.
In this scenario, expenditure on movements would decrease from the current EUR 1.78 billion
per year to EUR 1.68 billion at current prices. Expenses related to passenger cars of the Tallinn
and Harju County residents and companies would decrease by 10%, i.e., by EUR 149 million
per year compared to the baseline scenario. Investment and repair costs for streets and roads
are 35% lower than in the baseline scenario. Traffic noise is reduced and people’s physical
activity increases. Emissions of CO2 and other pollutants from transport in the Tallinn region
will decrease and Tallinn will become the seller of the CO2 quota.
3.3. Priority areas
In the following sections nine priority areas are outlined that should be actively addressed in
order to achieve the goals set forth in the vision. Under each priority area there are goals and
detailed measures to achieve the goals. It is important to note here that the priority areas are
not separate, but closely interlinked parts of a comprehensive regional mobility solution. The
impact of activities in these areas will be much greater if they are coordinated with activities
in other areas. For example, effective communication helps to increase the impact of the
construction of the main network of cycle paths on modal share. Similarly, it is much easier to
promote intermodality if attractive mobility services are introduced.
The integrated regional mobility solution described in this document approaches the problem
of sustainable commuting from two angles: on the one hand, the use of sustainable modes of
travel is encouraged, and on the other hand, car use is discouraged. When approaching from
both ends, the main emphasis is on changing people’s mobility behaviour indirectly, through
the established urban environment and other conditions. This means that sustainable modes
of travel will be promoted through the development of safe, comfortable, fast, and flexible
28You can also read