A Procedure for Developing Uncertainty-Consistent Vs Profiles from Inversion of Surface Wave Dispersion Data
←
→
Page content transcription
If your browser does not render page correctly, please read the page content below
A Procedure for Developing Uncertainty-Consistent Vs Profiles
                                                       from Inversion of Surface Wave Dispersion Data
                                                                             Joseph P. Vantassel1 and Brady R. Cox1
                                                                                     1
arXiv:2007.09775v2 [physics.geo-ph] 4 Apr 2021

                                                                                         The University of Texas at Austin

                                                                                                 April 6, 2021

                                                                                                    Abstract
                                                      Non-invasive surface wave methods have become a popular alternative to traditional invasive forms of
                                                  site-characterization for inferring a site’s subsurface shear wave velocity (Vs) structure. The advantage
                                                  of surface wave methods over traditional forms of site characterization is that measurements made solely
                                                  at the ground surface can be used routinely and economically to infer the subsurface structure of a
                                                  site to depths of engineering interest (20–50 m), and much greater depths (>1 km) in some special
                                                  cases. However, the quantification and propagation of uncertainties from surface wave measurements
                                                  into the Vs profiles used in subsequent engineering analyses remains challenging. While this has been
                                                  the focus of much work in recent years, and while considerable progress has been made, no approach for
                                                  doing so has been widely accepted, leading analysts to either address the propagation of uncertainties
                                                  in their own specialized manner or, worse, to ignore these uncertainties entirely. In response, this paper
                                                  presents an easy-to-implement, effective, and verifiable method for developing uncertainty-consistent
                                                  Vs profiles from inversion of surface wave dispersion data. We begin by examining four approaches
                                                  presented in the literature for developing suites of Vs profiles meant to account for uncertainty present
                                                  in the measured dispersion data. These methods are shown to be deficient in three specific ways. First,
                                                  all approaches are shown to be highly sensitive to their many user-defined inversion input parameters,
                                                  making it difficult/impossible for them to be performed repeatedly by different analysts. Second, the
                                                  suites of inverted Vs profiles, when viewed in terms of their implied theoretical dispersion data, are shown
                                                  to significantly underestimate the uncertainty present in the experimental dispersion data, though some
                                                  may appear satisfactory when viewed purely qualitatively. Third, if the uncertainties in the implied
                                                  theoretical dispersion data were to be examined quantitatively, which has not been done previously,
                                                  there is no obvious remedy available to the analyst to resolve any inconsistency between the measured
                                                  and inverted dispersion uncertainty. Therefore, a new approach is proposed that seeks to remedy these
                                                  shortcomings. First, beyond appropriate considerations that must be given to all inversions, the method
                                                  is governed by only one user-defined input parameter, to which it is not overly sensitive. Second, it is
                                                  shown to produce suites of Vs profiles whose theoretical dispersion data quantitatively reproduce the
                                                  uncertainties in the experimental dispersion data. Third, the final step of the procedure requires the
                                                  analyst to compare the measured and inverted dispersion uncertainties quantitatively, and should the
                                                  analyst find the results to be lacking, clear guidance is provided on the actions necessary to produce Vs
                                                  profiles whose theoretical dispersion data better account for the experimental uncertainty. Using two
                                                  synthetic tests and a real-world example, the procedure is shown to produce suites of Vs profiles that
                                                  accurately capture the site’s Vs structure, while rigorously propagating the dispersion data’s uncertainty
                                                  through the inversion process.

                                                                                                        1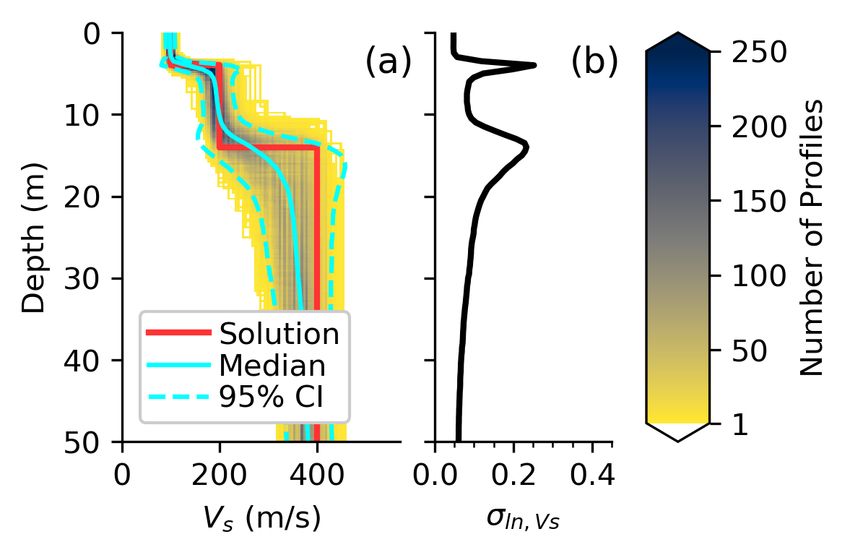
1    Introduction
Surface wave methods have become a popular alternative to traditional invasive forms of site characteriza-
tion for measuring a site’s subsurface shear wave velocity (Vs) structure. Vs, which is directly related to
the site’s small-strain shear stiffness (Gmax = ρV s2 , where ρ refers to mass density), is a critical parameter
in many seismic hazard analyses, such as ground response analyses (Foti et al., 2009; Rathje et al., 2010;
Teague and Cox, 2016; Passeri et al., 2019) and liquefaction-triggering (Andrus and Stokoe, 2000; Kayen
et al., 2013; Wood et al., 2017). The performance of surface wave testing is traditionally broken into three
stages: acquisition, processing, and inversion (Foti et al., 2015). The acquisition stage involves non-invasively
(i.e., from the ground surface) measuring surface waves as they propagate through a site. This can be ac-
complished using active-source methods, where surface waves are generated by the experimenters, and/or
passive-wavefield methods, where sensors are left undisturbed to record ambient surface waves. The process-
ing stage transforms these time-domain recordings to measurements of the site’s dispersive properties, which
in this context describes how the site’s surface wave phase velocity changes as a function of frequency (or
equivalently wavelength). Importantly, this measurement of the site’s dispersive properties should include
site-specific estimates of frequency-dependent uncertainty, discussed in detail later. For clarity of expression,
we will refer to the measurement of the site’s dispersive properties from the processing stage as the experi-
mental dispersion data. Importantly, when surface wave processing is performed by an experienced analyst,
the experimental dispersion data is robustly determined, with uncertainties that typically range from 5%
– 10% coefficient of variation (COV) between analysts (Cox et al., 2014; Garofalo et al., 2016). This con-
sistency led Griffiths et al. (2016a; 2016b) and Teague et al. (2018a) to aptly refer to the experimental
dispersion data as part of a site’s “signature”. The final stage of surface wave testing is inversion. In this
stage, numerical search algorithms are used to identify one-dimensional (1D) layered earth models whose
theoretical dispersion curves, determined through an analytical forward problem, best fit the experimental
dispersion data. It is important for the reader to understand that, while throughout this paper we focus
primarily on Vs, as it has the greatest impact on the theoretical dispersion curve (Wathelet, 2005) and is of
primary importance to subsequent engineering analyses, the computation of a theoretical dispersion curve
(and therefore surface wave inversion) requires the definition of an entire 1D ground model. These ground
models are composed of a stack of layers described by their thickness (H), Vs, compression-wave velocity
(Vp), and ρ. The models whose theoretical dispersion curves best fit the experimental dispersion data, as
determined by a misfit function, are considered to be the most likely representations of the site’s subsurface
conditions.
     As the primary focus of this paper is on the consistent propagation of experimental dispersion data
uncertainty into the Vs profiles resulting from inversion, it is important to first discuss the types and potential
sources of these uncertainties. Uncertainties can be broadly grouped into two categories commonly used in
probabilistic seismic hazard analysis (PSHA): epistemic and aleatory. Epistemic uncertainty describes those
unknowns which stem from a lack of knowledge. In surface wave testing, sources of epistemic uncertainty
include, among others, the selected dispersion processing wavefield transformation and the number of 1D
subsurface layers used during inversion. Aleatory uncertainty, or sometimes referred to as aleatory variability,
is the result of inherit randomness within the quantity being measured. When discussing site characterization
in particular, aleatory uncertainty is classically used to define how the material properties in the subsurface
change in three-dimensional space (i.e., randomness with space, or spatial variability). Of course, this could
also be considered epistemic uncertainty because it stems from a lack of knowledge rather than from any
inherit randomness within the subsurface (i.e., randomness with time). Being able to consider subsurface
variability as either epistemic or aleatory in nature hints that, for most real-world applications, the two
uncertainty “categories” are not as distinct as their names may indicate. Regardless, it is to be expected
that all experimental dispersion data contains some amount of uncertainty and that this uncertainty is in part
epistemic (dependent largely on the quantity and quality of the data acquired) and part aleatory (dependent
on the complexity of the subsurface and the spatial extents of the surface wave arrays). And, while it is
difficult-to-impossible to separate epistemic and aleatory uncertainties in the experimental dispersion data,
it is of paramount concern that the surface wave analyst attempt to quantify the combined uncertainty on a
site-by-site basis (discussed briefly next) and then propagate that uncertainty through the inversion process

                                                        2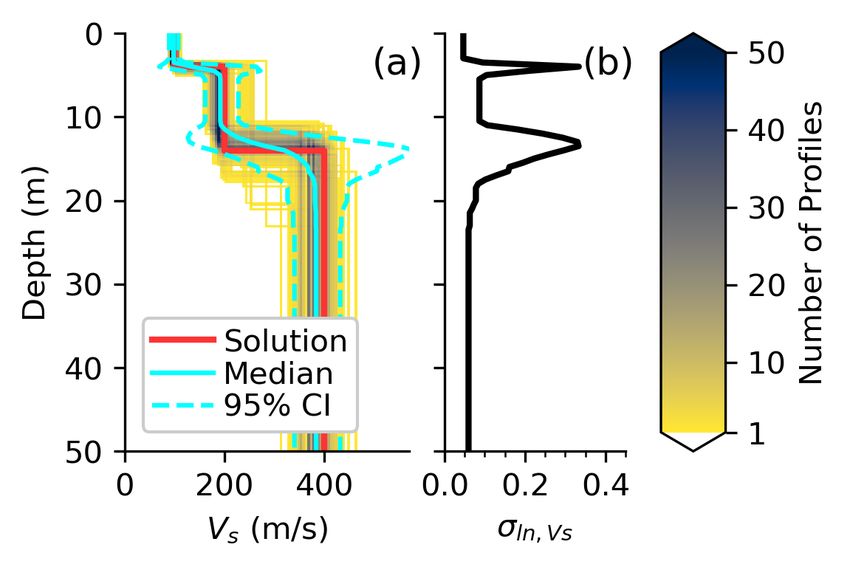
in order to develop uncertainty-consistent Vs profiles.
    As this study begins under the assumption that site-specific estimates of dispersion uncertainty have
been established, how this might be accomplished deserves a brief discussion. However, before doing so, it is
important to acknowledge that while many previous researchers have developed procedures for accounting
for uncertainty in experimental data (Lai et al., 2005; Foti et al., 2009; Cox and Wood, 2011; Teague et al.,
2018a) no single procedure has been accepted widely into practice, and therefore the example presented
here is but one of many potential alternatives that may be used. To facilitate a more practical discussion,
the example presented here is shown in Figure 1. Figure 1a illustrates a measurement of a site’s dispersive
properties at some location termed “Location A”. This measurement is directly linked to a given location (i.e.,
Location A), experimental setup (e.g., array configuration), wavefield recording (e.g., source offset or noise
time window), and wavefield processing method (e.g., frequency-wavenumber transformation). The light-
colored portions of Figure 1a show high surface wave power and the dark-colored portions low surface wave
power. The maximum power at each frequency is selected as the representative experimental dispersion data
for that location, setup, wavefield recording, and processing method. To then develop meaningful statistics
that incorporate the uncertainties previously discussed, the procedure shown in Figure 1a should be modified
and/or repeated in a systematic manner to encompass reasonable combinations of these contributing sources.
As shown schematically in Figure 1b, these combinations may include performing the test at various locations
across a site (i.e., Location B), using various source locations for active-source experiments (i.e., Offset X),
various time-windows for passive-wavefield experiments (i.e., Window Y), and multiple wavefield processing
methods (i.e., Method Z). Finally, once these sources of uncertainty have been accounted for in the form
of experimental dispersion data (i.e., Figure 1b) they may be summarized into a statistical representation
at each frequency (or wavelength), as shown in Figure 1c. A previous study by Lai et al. (2005) showed
that the uncertainty in experimental dispersion data for active-source experiments based on multiple source
impacts was normally distributed, therefore, it is common to represent the Rayleigh wave velocity (Vr) at
each frequency with a mean and standard deviation. However, it is important to note that at some sites with
significant lateral variability, such as the Garner Valley site examined by Teague et al. (2018b), it may be
more appropriate to develop alternative dispersion data sets (one per location) with their own experimental
uncertainty and invert them separately rather than trying to represent all of the dispersion data with a
single statistical distribution. As a more in depth discussion of developing experimental dispersion data is
beyond the scope of this paper, the reader is encouraged to carefully consider the impact of how defining
their experimental dispersion uncertainty will affect the resulting distribution of Vs profiles and whether
those profiles will correctly communicate the measured uncertainty.
    While not the primary focus of this work, it is important to briefly mention some of the methods currently
being used to account for Vs uncertainty in seismic hazard studies and highlight why developing uncertainty-
consistent Vs profiles from experimental dispersion data is of such critical importance. At present, most
important seismic design projects utilize some form of Vs randomization to account for Vs uncertainty in
ground response analyses, where a baseline Vs profile is randomized (i.e., manipulated) using a statistical
procedure. The most commonly used of these randomization approaches is that proposed by Toro (1995),
leading to its adoption in the guidelines for hazard-consistent one-dimensional ground response analyses
(Stewart et al., 2014) and the design of critical facilities (EPRI, 2012). However, multiple studies (Griffiths
et al., 2016a,b; Teague et al., 2018b; Teague and Cox, 2016) have expressed serious concern that the blind
application of this type of Vs randomization can result in highly unrealistic ground models that do not fit
the experimental site signature and an inability of such models to accurately predict ground response. The
reader will note that a new Vs randomization approach has recently been proposed by Passeri et al. (2020).
However, the authors have not yet evaluated it rigorously to determine if it produces Vs profiles that are
more consistent with the site signature. Importantly, this paper, while not discussing Vs randomization
directly, offers an alternative to Vs randomization by propagating measured, site-specific uncertainty into
suites of Vs profiles obtained from surface wave testing. These suites of profiles can then be used either
directly to address Vs uncertainty in subsequent engineering analyses (e.g., ground response analyses) or,
if the use of Vs randomization is still desired, to better inform its many unknown input parameters with
site-specific and uncertainty-consistent values. While this study will focus primarily on the development of

                                                       3
400 (a) Location A (b) Location A (c)
Location B
Exp. Disp. Data
300 Offset X
Window Y
Vr (m/s)
Method Z
200
100
0
3 101 30 3 101 30 3 101 30
Frequency, f (Hz)
Figure 1: Schematic illustrating one possible procedure for developing experimental dispersion data with
measures of uncertainty in terms of the site’s Rayleigh wave velocity (Vr). This involves: (a) the processing
of recorded waveforms from a single location, experimental array setup, source offset/noise time window, and
wavefield transformation method, (b) the modification and repetition of the procedure illustrated in (a) to
produce estimates of the site’s dispersion uncertainty, and (c) the synthesis of these estimates of uncertainty
into a statistical representation called the site’s experimental dispersion data.
the former, it is important that the reader be aware of the wider implications of the proposed method on
greater engineering practice.
This study begins by examining common approaches found in the literature for developing uncertainty-
consistent Vs profiles from the inversion of experimental surface wave dispersion data. Using a synthetic
dataset, these approaches from the literature are shown to yield suites of subsurface models whose theoretical
dispersion curves severely underestimate the experimental dispersion data’s uncertainty, resulting in Vs
profile which underestimate the site’s uncertainty. This is then followed by the presentation of a new
procedure for rigorously propagating measured experimental dispersion uncertainty through the inversion
process to obtain suites of Vs profiles that more accurately represent Vs uncertainty at the site. This
new procedure is applied to the same synthetic dataset as the literature-based approaches and is shown
to be quantitatively superior, and able to precisely propagate the experimental dispersion uncertainty into
the resulting Vs profiles. The new procedure is then extended to incorporate epistemic uncertainty in the
inversion’s layering parameterization using the same synthetic example, and again shows excellent results.
The study concludes with the application of the method at a real site where it is shown to produce suites of
Vs profiles which agree favorably with a borehole Vs profile while simultaneously capturing the experimental
dispersion data’s uncertainty.
2 Common Approaches used to Account for Vs Uncertainty in
Surface Wave Inversion
To illustrate the problem this paper proposes to solve, we first examine several approaches from the literature
that have been used to account for Vs uncertainty in surface wave inversion. All of the approaches mentioned
below have a basic commonality, in that they first search through large numbers (often tens-of-thousands to
millions) of trial layered-earth models to find a significant number of models with an acceptable fit to the
experimental dispersion data. The acceptability of a model is typically judged using a misfit function that
quantifies the goodness-of-fit between the theoretical dispersion curve for a given model and the experimental
dispersion data. Due to the non-uniqueness of the inverse problem and the experimental dispersion data’s
uncertainty, it is often possible to find thousands- to tens-of-thousands of acceptable models that range
from subtly to significantly different. From these acceptable models, a subset are selected to account for
4uncertainty in Vs. The discussion below will focus primarily on how different studies obtained suites of
acceptable models, and how they then selected from those to estimate Vs uncertainty.
Before presenting the various approaches that have been used to account for Vs uncertainty in surface
wave inversion, it is important to briefly discuss the details surrounding surface wave inversion, as these
details will be important for understanding the results presented later. First, all of the approaches presented
in the literature utilize large numbers of trial models from a global-search inversion algorithm to find suites
of acceptable models. Global-search algorithms vary in their implementation and may search for accept-
able models in several different ways, including randomly (i.e., pure Monte-Carlo), with the aid of some
optimization algorithm (i.e., pure optimization), or by using a combination of the two. By far, the most
popular tool for performing global-search surface wave inversion is the Dinver module (Wathelet et al., 2004)
of the open-source software Geopsy (Wathelet et al., 2020). As a testament to its popularity, Dinver was
the inversion algorithm of choice in all but one of the works discussed below. Of particular relevance to the
discussion below, and worth discussing here, is the misfit function proposed by Wathelet et al. (2004) and
implemented in Dinver. The Wathelet et al. (2004) misfit function can be described as a root-mean-square
error normalized by the experimental dispersion uncertainty (Yust et al., 2018). This gives the misfit function
a useful physical interpretation, as it represents on average, across all frequencies/wavelengths, how far (in
number of standard deviations) a theoretical dispersion curve strays from the experimental dispersion data.
For example, a theoretical dispersion curve with a misfit of 1.0 can be understood as a curve that on average
is one standard deviation away from the mean. With these details in mind, it is now possible to discuss the
approaches presented in the literature to account for Vs uncertainty in surface wave inversion.
To develop suites of acceptable layered-earth models, Wathelet et al. (2004) and Wathelet (2008) per-
formed pure-optimization inversions considering many (over 100,000) trial models. For convenience of ex-
pression, and in order to be consistent with common vernacular, we will refer to a pure optimization inversion
as a minimum misfit of zero (M0) inversion. M0 inversions are named as such because the goal of the in-
version algorithm is to find a model with a misfit equal to zero (i.e., one whose theoretical dispersion curve
perfectly matches the mean experimental dispersion data). In the studies noted above, from the many trial
models searched, all models with a dispersion misfit value less than 1.0 (tens of thousands in most cases)
were selected as a means to propagate the experimental dispersion data’s uncertainty into the resulting Vs
profiles. This approach has three shortcomings: (1) it may result in a highly variable number of acceptable
profiles, depending on the number of trial models attempted in the inversion and the subjective user-defined
quality threshold (i.e., misfit less than 1.0 in this case), (2) for inversions with many models below the
threshold (e.g., tens-of-thousands) it may readily become computationally unmanageable to again propagate
the Vs uncertainty into subsequent engineering analyses (e.g., ground response analyses), and (3) the use of
an M0 inversion will likely cause the majority of the theoretical dispersion curves to be clustered around the
mean of the experimental dispersion data (i.e., a misfit of zero) rather than following the distribution of the
experimental dispersion data uncertainty.
Foti et al. (2009) used a pure Monte-Carlo global-inversion algorithm (i.e., not Dinver) to develop suites
of acceptable models (more than 50,000 in the examples presented) whose theoretical dispersion curves fit the
experimental dispersion data. To select a more manageable subset of models, they sampled from these large
suites using a statistical test to select models which could be considered equivalent in term of their fit to the
experimental dispersion data, given its uncertainties. While the selection process reduced the computational
burden of having to consider ten-of-thousands of Vs profiles, it still maintained the disadvantage of the
previous technique that the number of profiles varied between application, ranging between 6 and 270 Vs
profiles for the cases presented. Furthermore, the theoretical dispersion curves from the selected models
can be seen to underestimate the experimental dispersion data uncertainty, even for the most favorable case
where 270 profiles were selected by the statistical test.
Hollender et al. (2018), when developing statistics for the time-averaged shear wave velocity in the upper
30 m (Vs30), used an “acceptable-misfit” approach [i.e., an inversion where the minimum misfit was not zero
(M0+)] to develop a large suite of acceptable models (over 50,000) to represent the experimental dispersion
data uncertainty. From those models, they randomly extracted at least 6000 Vs profiles to develop statistics
on Vs30. They then selected a smaller set of 33 representative Vs profiles, whose uncertainty in Vs30 matched
5that of the randomly selected 6000 profiles, for use in subsequent analyses. While this approach ensured
an equal and manageable number of profiles (i.e., 33) for each site, and permitted the propagation of the
estimated uncertainty in Vs30, it does not guarantee that the initial large suite of acceptable models properly
accounted for the experimental dispersion data’s uncertainty. Thereby, potentially allowing the subsequent
uncertainties (i.e., the Vs30 uncertainty) upon which they are based to not fully capture the site-specific
uncertainty in the experimental dispersion data.
This final section groups a number of studies that are similar, in that they all use a M0 inversion to
develop their acceptable suites of models from which to select some fixed number of lowest misfit models
to represent Vs uncertainty. Di Giulio et al. (2016) selected the 100 lowest misfit profiles out of over a
million trial models. Griffiths et al. (2016a; 2016b) and Teague and Cox (2016) chose 50 randomly selected
models from the 1000 lowest misfit models obtained from hundreds-of-thousands of trial models, as the
50 randomly selected models were shown to have similar statistical properties as the 1000 best, but were
more computationally manageable. Cox and Teague (2016), Teague et al. (2018a) and Deschenes et al.
(2018) presented the 1000 lowest misfit Vs profiles from hundreds-of-thousands of trial models. Vantassel
et al. (2018), Cox and Vantassel (2018), and Yust et al. (2018) presented the 100 lowest misfit Vs profiles
from hundreds-of-thousands of trial models considered to account for Vs uncertainty, as these 100 lowest
misfit Vs profiles were shown to be statistically similar to the 1000 lowest misfit Vs profiles, but were
more manageable. This approach (i.e., selecting some number of the lowest misfit/“best” models) resolves
the issues of variability between analyses, avoids potentially large numbers of profiles, and is relatively
simple. However, this approach is still deficient in two specific ways: (1) it relies on an M0 inversion which,
as mentioned previously, will likely produce profiles with theoretical dispersion that is clustered around
the experimental dispersion data’s mean rather than being properly distributed, and (2) the uncertainty
accounted for in the 100 or 1000 best models is indirectly tied to the number of trial models attempted by
the analyst (i.e., different apparent uncertainty will results whether the analyst uses 1000, 10,000 or 1,000,000
trial models).
In summary, all of the presented approaches follow a basic two-step process. First, a large number
of acceptable models are obtained using a global-search algorithm, and second, some subset of profiles
are selected from the acceptable models as a basis for assessing Vs uncertainty. In all of the presented
approaches we observe a dependence on two basic assumptions: (1) that the large suite of acceptable models
(i.e., from the first step) properly accounts for the experimental dispersion data’s uncertainty, and (2) that
the selection process will guarantee a set of Vs profiles which rigorously propagates the uncertainty into
subsequent analyses. The remainder of this section is devoted to quantitatively assessing the veracity of
these assumptions by examining the effectiveness of these approaches.
To quantitatively assess the ability of the approaches from the literature to propagate experimental
dispersion data uncertainty into the resulting Vs profiles, four variations were applied to an experimental
dispersion dataset. The experimental dispersion data is taken from a large synthetic study focused on the
performance of surface wave inversion (Vantassel and Cox, 2021). The data itself has been published as one
of twelve surface wave inversion benchmarks, which is publically available on the DesignSafe-CI (Vantassel
and Cox, 2020). While a full detailed discussion is provided in the previous references, in short, the synthetic
data was developed by taking the theoretical dispersion curve from an assumed ground model, resampling
it in log-wavelength, and assuming a normal distribution in Rayleigh wave velocity (Vr) with a coefficient of
variation (COV) of 0.05. A COV of 0.05 was based on typical experimental dispersion data uncertainty values
from several blind analyst studies (Cox et al., 2014; Garofalo et al., 2016). For reference, the experimental
dispersion data is the same as that shown in Figure 1c. The proposed methods to be considered were selected
to address two primary questions of interest, namely: (1) what effect, if any, does the type of inversion (pure
optimization, pure random, or some combination) have on the resulting acceptable models, and (2) how
should the analyst sample from the acceptable models. With regard to the type of inversion preformed, we
consider two inversion alternatives: (a) a pure-optimization (i.e., M0) inversion, as this approach is the most
commonly used in the literature, and (b) a combined approach that is partly optimized and partly random.
This second approach will be referred to as a minimum misfit of 1.0 (M1) inversion because the inversion
algorithm is forced to search randomly in those regions of the model space where the calculated misfit is
6below 1.0. A pure-random search was not explicitly considered here, as it is expected to produce similar
results to the M1 inversion at greater computational expense. With regard to how the representative Vs
profiles should be sampled from the acceptable inversion models, we consider two alternatives: (a) the 100
lowest misfit/“best” models (b100), as this was the most popular approach in the literature, and (b) 100
randomly selected models from all models with a misfit less than 1.0 (n100). Note that the n100 alternative
was a necessary adaptation to the approach of selecting all profiles below the misfit threshold of 1.0 to ensure
a computationally manageable number of profiles and a fair comparison to the b100 profiles.
For illustration purposes and to simplify initial discussions, the experimental dispersion data was inverted
using only a single, three-layer parameterization (i.e., a Layering by Number (LN) = 3 parameterization),
as this layering parameterization was shown to perform the best when inverting the example dataset in
the previous study by Vantassel and Cox (2021). The experimental dispersion data were inverted using
the Neighborhood Algorithm (Sambridge, 1999) as implemented in the Dinver module of Geopsy (Wathelet
et al., 2020). For both the M0- and M1-style inversions, an initial 10,000 random trial models followed
by 50,000 neighborhood-algorithm trial models were considered. Note that the number of neighborhood-
algorithm models used here is less than those used in previous studies from the literature, which tended to
use a hundred-thousand or more. We do this to mitigate bias in the resulting suite of acceptable models
caused by the inclusion of many (potentially tens-of-thousands) very similar models with misfits close to
zero. We believe the use of a smaller, but sufficient (Vantassel and Cox, 2021), number of models provides
these techniques the best possible chance of successfully propagating the experimental dispersion data’s
uncertainty into the resulting models. The selected b100 and n100 models are shown in terms of their Vs
profiles and associated uncertainty in Figure 2. Note, to better illustrate their concentration, the Vs profiles
have been discretized in terms of depth and Vs, binned into cells, and color mapped in terms of the number
of profiles in each cell. Vs uncertainty is expressed in the form of the lognormal standard deviation of
Vs (σln,V s ), which is commonly used in seismic hazard studies, and is similar to the COV for values less
than approximately 0.3. The theoretical dispersion curves for the b100 and n100 models are presented with
the experimental dispersion data in Figure 3 so the reader can view how the apparent uncertainty in the
inversion-derived Vs profiles relates to the apparent uncertainty in the theoretical dispersion curves.
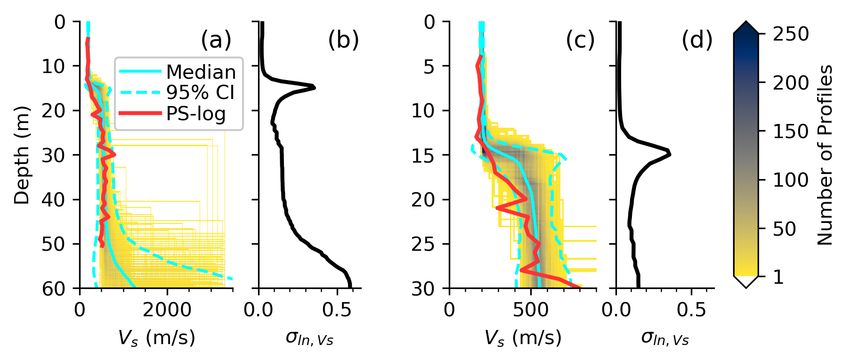
Figure 2 illustrates that the resulting Vs profiles are most sensitive to how they are sampled (b100 vs
n100), and significantly less dependent on how the inversion is performed (M0 vs M1). This is shown both
qualitatively when viewing the range of Vs profiles [i.e., panels (a), (c), (e), and (g)] and quantitatively
when viewing σln,V s [i.e., panels (b), (d), (f), and (h)]. For example, the Vs profiles obtained from the b100
approach show minimal scatter/uncertainty, while those obtained from the n100 approach show significantly
more scatter/uncertainty. Note that the spikes in σln,V s are due to the uncertainty in the layer boundaries,
reflecting a shortcoming in how σln,V s has been traditionally calculated, and are not the result of uncertainty
in Vs directly. The trends in Vs scatter/uncertainty shown in Figure 2 are tied directly to visible trends in
the scatter/uncertainty of the theoretical dispersion curves shown in Figure 3. The color scale in Figure 3
indicates the range of dispersion misfit values, which varies widely between approaches. The b100 models are
primarily composed of models with low misfit dispersion misfit models (0.6) that qualitatively appear to fit the experimental
dispersion data’s uncertainty, although some biases can be observed, particularly towards lower Vr values
at low frequencies (e.g., in Figure 3b at frequencies below 4 Hz). To better illustrate these problems, the
vertical blue dashed line at 4 Hz in each panel of Figure 3 corresponds to a “slice” shown in each of the
corresponding panels of Figure 4. The mismatch between the measured and inverted distributions of Vr in
Figure 4 clearly show that none of the methods from the literature are able to capture the mean, standard
deviation, and distribution of the experimental dispersion data. To illustrate this quantitatively across the
entire frequency range, Figure 5 shows the normalized residual mean and residual COV for the dispersion
data for the four approaches considered. The vertical dashed blue line again indicates the location of the
“slices” shown in Figure 4. Figure 5a confirms that using b100 sampling will tend to result in a suite of
models that well-fit the mean trend of the experimental dispersion data (i.e., normalized residual mean near
zero). Whereas, using n100 sampling may result in significant errors in the mean (e.g., overestimation of Vr
7Figure 2: Shear wave velocity (Vs) profiles obtained from a synthetic experimental dispersion dataset using
four common approaches from the literature for accounting for Vs uncertainty in inversion. In order to
better illustrate their concentration, the profiles have been discretized in terms of depth and Vs, binned into
cells, and color mapped in terms of the number of profiles in each cell. The presented approaches include:
(a) a minimum misfit of 0 (M0) inversion with the selection of the 100 lowest misfit/“best” models (b100),
(c) a M0 inversion with 100 random profiles selected from all models with a misfit less than 1.0 (n100), (e)
a minimum misfit of 1.0 (M1) inversion with the selection of the 100b models, and (g) an M1 inversion with
the selection of the n100 models. The Vs profiles from these approaches are shown alongside the solution
profile in red. Adjacent to each suite of profiles is their corresponding lognormal standard deviation of Vs
(σln,V s ). The sharp spikes in σln,V s are due to the uncertainty in the profile’s layer boundaries, reflecting a
shortcoming in how σln,V s has been calculated historically, and are not the result of actual uncertainty in
Vs directly.
at 4 Hz). Figure 5b illustrates that using b100 sampling, which was shown to fit the mean Vr so precisely
in Figure 5a, severely underestimates the true dispersion uncertainty at all frequencies. Recall that the
dispersion uncertainty for this synthetic example was set using a COV of 0.05 at all frequencies; meaning
that the b100 sampling with a residual COV of nearly -0.05 underestimates the true dispersion uncertainty
by nearly 100%. In contrast, the n100 models that did not well-fit the mean trend tend to provide a better
representation of the experimental dispersion uncertainty, although in this case they still underestimate the
measured uncertainty at both high and low frequencies by approximately 0.02, or 40%. These results clearly
indicate that the currently available methods of accounting for Vs uncertainty in surface wave inversion
are unable to propagate the uncertainty in the experimental dispersion data into the resulting suites of Vs
profiles.
8400 (a) (b)
Rayleigh Wave Velocity, Vr (m/s)
300 1.0
200
0.8
Dispersion Misfit
100 M0 M0
0
b100 n100 0.6
400 (c) (d) 0.4
300 0.2
200 0.0
100 M1 M1 Measured
b100 n100 Slice @ 4Hz
0 0
10 3 101 30 100 3 101 30
Frequency, f (Hz)
Figure 3: Comparison of the experimental dispersion data from a synthetic dataset with the individual
theoretical dispersion curves obtained from inversion using four common approaches from the litera-
ture for accounting for Vs uncertainty. Each of the four panels (a)-(d) illustrate one of the four common
approaches from the literature. They include: (a) a minimum misfit of 0 (M0) inversion with the selection
of the 100 lowest misfit/“best” models (b100), (b) a M0 inversion with 100 random profiles selected from all
models with a misfit less than 1.0 (n100), (c) a minimum misfit of 1.0 (M1) inversion with the selection of
the b100 models, and (d) an M1 inversion with the selection of the n100 models. The vertical dashed blue
line at approximately 4 Hz, shown on all panels, indicates the location where a “slice” is shown in Figure 4
for each of the four approaches.
(a) Measured (b) Measured
Inverted Inverted
Probability Density
M0 M0
b100 n100
(c) Measured (d) Measured
Inverted Inverted
M1 M1
b100 n100
200 250 300 200 250 300
Rayleigh Wave Velocity, Vr (m/s)
Figure 4: Distributions of the measured (i.e., experimental) and inverted (i.e., theoretical) dispersion data at
a frequency of approximately 4 Hz using four common approaches from the literature to account for
Vs uncertainty in surface wave inversion. The four panels have the same caption as those shown in Figure 3.
910 (a) Overestimate Mean Vr
μres/μmeas (%)
0
M0, b100
−10 Underestimate Mean Vr M0, n100
M1, b100
(b) Overestimate Vr Uncertainty M1, n100
δinv − δmeas 0.05
0.00
−0.05 Underestimate Vr Uncertainty
3 101 30
Frequency, f (H )
Figure 5: Quantitative assessment of four common approaches from the literature for propagating
uncertainty in experimental dispersion data to the inverted Vs profiles. The comparison is made on the basis
of: (a) the dispersion residual mean (µres ) [i.e., the difference between the mean of the inverted theoretical
dispersion curves (µinv ) and the mean of the measured experimental dispersion data (µmeas )] normalized by
µmeas , expressed in percent, and (b) the dispersion residual coefficient of variation [i.e., the difference between
the coefficient of variation of the inverted theoretical dispersion curves (δinv ) and the coefficient of variation
of the measured experimental dispersion data (δmeas )]. The vertical dashed blue line at approximately 4
Hz in panels (a) and (b) indicates the location where a “slice” was shown in Figure 4 for each of the four
approaches.
3 A New Procedure to Account for Vs Uncertainty in Surface
Wave Inversion
The four example approaches from the literature considered in the previous section had three specific short-
comings: (1) the profiles tended to capture either the mean trend or the variance of the dispersion data,
but not both (refer to Figure 5), (2) theoretical dispersion curves from the suites of inverted models did not
follow the distribution of the synthetic experimental dispersion data (refer to Figure 4), and (3) when the
results were found to be unacceptable, as was the case for the synthetic example discussed above, there was
no clear procedure to remedy the inconsistency. This section presents an alternative procedure to account for
Vs uncertainty in surface wave inversion. The new procedure is presented schematically in Figure 6. Figure
6a shows experimental dispersion data with site-specific measurements of uncertainty. This uncertainty is
quantified in terms of surface wave phase velocity at each frequency using a mean, standard deviation, and,
very importantly, correlation coefficients between all frequency pairs. All of these statistics can be easily
quantified by the analyst using the approach to developing dispersion data with site-specific uncertainty
discussed previously (recall Figure 1). Consider the experimental dispersion data in Figure 6a, which con-
tains 13 frequency points. Its statistics are completely described using 13 mean values (shown with a circle),
13 standard deviations (shown with error bars), and a matrix of 13x13 correlation coefficients (not shown)
relating the phase velocity at each frequency to the other 12 values. With the experimental dispersion data
described in terms of its statistics, it’s now possible to simulate a realization from that experimental dis-
persion data, shown schematically in Figure 6b. It is during this simulation stage that the inclusion of the
correlation information is so critical. Without such information one is left to assume the correlations, or
worse, independence. However, doing so would likely result in simulated dispersion curves that were erratic
from frequency-to-frequency and inconsistent with the dispersion data that was used to estimate the uncer-
10Simulate Realization of Disp. Data
(a) (b)
Exp. Disp. Data Disp. Realization
Surface Wave Velocity
Compare Implied and Measured
Invert Realization
(c) Implied Disp. Data (d) Disp. Realization
Surface Wave Velocity
Fits to Realizations Fit to Realization
Frequency Frequency
Repeat (b) and (d) for N realizations
and Calcuate Implied Disp. Data
Figure 6: A new procedure for developing uncertainty-consistent shear wave velocity (Vs) profiles from
surface wave dispersion data. The procedure involves: (a) describing the site’s experimental dispersion data
in terms of its statistics, (b) generating a realization of the experimental dispersion data, (d) inverting the
realization to obtain a single, best theoretical fit, repeating (b) and (d) for N realizations, and (c) comparing
the statistics of the resulting theoretical dispersion curves (i.e., the implied dispersion data) to that of the
measured experimental dispersion data.
tainty. In essence, the inclusion of the correlations between dispersion points imposes a relational constraint
that helps to encourage simulated dispersion curves that are consistent with the measured data (i.e., in this
case, smooth and continuous). Once a curve has been simulated, it is inverted to obtain a single, “best”
fit model, as shown in Figure 6d. Note that while all previous procedures to account for Vs uncertainty
required the use of a global-search algorithm to ultimately develop suites of Vs profiles, in contrast, this
new procedure is inversion-algorithm agnostic, thereby permitting the analyst to use any algorithm of their
choice (global or local). Furthermore, by selecting only the single, “best” model the issue of dependence on
the number of trial models is avoided altogether, provided of course that a reasonable/sufficient number of
models has been attempted to produce a good fit to the simulated dispersion curve, which is easily verifiable.
Returning to Figure 6d, it is important to note that the fit may not be perfect, however, the proposed proce-
dure does not require it. The issue of primary importance is that the simulated experimental dispersion data
and the theoretical fit are in good agreement over the experimental frequency range, though not necessarily
strictly identical. The procedure of simulating a realization of the dispersion data and fitting it through
inversion is repeated for some number of trials (N), which is the only input parameter to be defined by the
analyst. The best inversion-derived fit to each realization and the corresponding ground model is saved as a
potential solution to the experimental data considering its uncertainties, refer to Figure 6c. The N fits (i.e.,
N theoretical dispersion curves) can then be used to calculate implied dispersion data statistics which can
be compared directly against the experimental dispersion data statistics to assess the successfulness of the
procedure. Note that the value of N is expected to be problem dependent, however, a minimum acceptable
value for N can be checked prior to performing any inversions by comparing the statistics of the simulated
dispersion realizations and the experimental dispersion data. If the statistics of the simulated dispersion
data (i.e., the targets used for inversion) are unable to reproduce the experimental statistics, it can then be
11inferred that the inversion-derived fits to those simulated curves will also not reproduce the experimental
statistics. Thus, care must be taken to select N to be sufficiently large to ensure agreement between the
simulated and measured experimental data, although not too large to avoid excessive computational cost
when performing N different inversions. An N=250 was shown to perform well over the course of this study,
however the choice of N is left to the discretion of the analyst. Importantly, following the inversion of the
N simulated dispersion curves to obtain N theoretical dispersion curves, the statistics implied by the N
theoretical dispersion curves (i.e., the implied dispersion data, refer to Figure 6c), must be compared quan-
titatively with the measured experimental dispersion data in a manner similar to that shown in Figure 5. If
the agreement between the implied and measured experimental dispersion data is found to be unsatisfactory,
additional simulations and/or increasing the value of N can be used to improve the results. The remainder of
this paper will address the application of this new approach to two synthetic tests and a real-world example.
4 Synthetic Tests
4.1 For a Single Layering Parameterization
To demonstrate the effectiveness of the newly proposed procedure, we will test it using the same synthetic
dataset as that was used previously to evaluate the literature-based approaches for accounting for Vs un-
certainty. Recall, the experimental dispersion data (i.e., mean and standard deviation as a function of
frequency) for this dataset is presented in Figure 1c. As the new approach requires the correlations between
frequencies, and the synthetic data, as developed, does not include such information, the correlations had
to be synthesized. The procedure for synthesizing the correlations involved first simulating ground models
whose theoretical dispersion curves were consistent with the experimental dispersion’s uncertainty. The
statistics used to inform the simulation of these ground models were developed based on the mean values
from an M0-type inversion and the uncertainty from an M1-type inversion, and while these types of inversions
have been shown to be lacking in their ability to propagate dispersion uncertainty (refer to Figures 4 and
5), they provided a reasonable correlation structure. The synthesized correlations were combined with the
known/assumed statistics (refer to Figure 1c) to define the experimental dispersion data. With this infor-
mation, the procedure outlined in Figure 6 was performed using N=250 realizations. The choice of N=250
was made prior to performing the inversions by checking that the statistics of the realizations consistently
reproduced the statistics of the experimental dispersion data. Each realization was inverted using the same
3-layer parameterization and 10,000 random plus 50,000 neighborhood algorithm trial models, as was used
in the previous section. Inversions were performed on the Texas Advanced Computing Center’s (TACCs)
cluster Stampede2 using a single Skylake (SKX) node. The entire analysis (i.e., the inversion of all N=250
simulated dispersion curves) took less than 2 hours to complete.
The results from the inversion analyses are provided in Figures 7, 8, and 9. Figure 7a compares the
theoretical dispersion curves fit to the N=250 realizations of the experimental dispersion data with the
original experimental dispersion data. Note the theoretical dispersion curves have been colored in terms
of their dispersion misfit relative to the original experimental data and not their respective realizations.
In contrast to the previous methods (refer to Figure 3) we observed a reasonable mixture of theoretical
dispersion curves with low misfits (i.e.,0.0 0.2 0.4 0.6 0.8 1.0 (b) ~3Hz (c) ~6Hz
(a) Dispersion Misfit
Probability Density
Exp. Disp. Data
300 275 325 175 215
(d)Vr (m/s)
~13Hz (e)Vr (m/s)
Vr (m/s)
~30Hz
200
100
3 101 30 95 110 85 100
Frequency, f (Hz) Vr (m/s) Vr (m/s)
Figure 7: Qualitative assessment of the newly proposed procedure for propagating experimental disper-
sion uncertainty into the inverted Vs profiles considering a single inversion parameterization for a
synthetic example. Panel (a) shows the experimental dispersion data and 250 inverted theoretical disper-
sion curves fit to the 250 realizations of the experimental dispersion data. The theoretical dispersion curves
have been colored according to their dispersion misfit values relative to the original experimental dispersion
data, not their respective realizations. The vertical dashed lines in panel (a) at approximately 3, 6, 13, and
30 Hz denote the location of the “slices” shown in panels (b), (c), (d), and (e), respectively. These “slices”
compare the measured experimental dispersion data’s distribution (solid black line) with the distribution of
Rayleigh wave velocity (Vr) derived from inversion (histogram).
illustrate excellent agreement between the experimental and inverted dispersion data’s mean and uncertainty
(i.e., residuals approximately equal to zero at all frequencies), especially when compared to previous methods
(refer to Figure 5).
With the theoretical dispersion curves from the inverted ground models having been shown to be con-
sistent with the uncertainty of the experimental dispersion data, we can now examine the effects on the Vs
profiles. Figure 9a presents the single-lowest misfit Vs profile from the inversion of each of the N=250 disper-
sion realizations. To better illustrate their concentration about the true solution the Vs profiles have been
discretized in terms of depth and Vs, binned into cells, and color mapped in terms of the number of profiles
in each cell. The discretized lognormal median Vs profile and the 95% lognormal confidence interval (CI)
profiles are also shown for reference. Figure 9a shows that the discretized median profile reasonably captures
the true solution and that the 95% confidence interval qualitatively captures the variance in the Vs profiles,
with the notable exception of the sharp spikes at layer boundaries. When we compare σln,V s from the new
approach (i.e., Figure 9b) directly with those from the literature (i.e., Figure 2b, d, f, and h) we observe
that the new approach shows increased uncertainty from the (b100) alternatives, as should be expected,
but surprisingly slightly less uncertainty than the (n100) alternatives. This observation indicates that (at
least for this example) the n100 models tend to over-estimate Vs uncertainty even when under-predicting
the dispersion data uncertainty (refer to Figure 5). Further examination of Figure 9b shows that σln,V s for
this example is approximately 0.06, which is quite low compared to values commonly assumed in practice
(EPRI, 2012; Stewart et al., 2014; Toro, 1995). This is certainly due in part to the use of only a single
inversion layering parameterization, as others have shown that the variability within a parameterization is
generally much less than that between parameterizations. Hence, if the true subsurface layering is unknown
a priori, it is not simply enough to accurately represent the experimental dispersion data’s uncertainty using
a single, assumed layering parameterization. Rather, one must also incorporate the epistemic uncertainty
in the layering parameterization itself (Cox and Teague, 2016; Di Giulio et al., 2012; Vantassel and Cox,
1310 (a) Overestimate Mean Vr
μres/μmeas (%)
0
−10 Underestimate Mean Vr
δinv − δmeas
0.05
(b) Overestimate Vr Uncertainty
0.00
−0.05
Underestimate Vr Uncertainty
3 101 30
Frequency, f (H )
Figure 8: Quantitative assessment of the newly proposed procedure for propagating experimental disper-
sion uncertainty into the inverted Vs profiles considering a single inversion parameterization for a
synthetic example. The comparison is made on the basis of: (a) the dispersion residual mean (µres ) [i.e.,
the difference between the mean of the inverted theoretical dispersion curves (µinv ) and the mean of the
measured experimental dispersion data (µmeas )] normalized by µmeas and expressed in percent, (b) the dis-
persion residual coefficient of variation [i.e., the difference between the coefficient of variation of the inverted
theoretical dispersion curves (δinv ) and the coefficient of variation of the measured experimental dispersion
data (δmeas )]. The vertical dashed lines in panels (a) and (b) denote the location of the “slices” shown in
Figure 7.
2021). The incorporation of multiple inversion parameterizations into the procedure and their effects on the
Vs profiles are presented in the following section.
4.2 Extension to Multiple Inversion Layering Parameterizations
Uncertainty within surface wave inversion is generally split into intra- and inter-parameterization variability,
which address the uncertainty inside a single inversion parameterization (i.e., the previous example) and
between various parameterizations (i.e., current example), respectively. Previous studies have shown that
the inter-parameterization variability is generally more significant than the inter-parametrization variability.
However, as the methods used in previous studies to account for intra-parameterization variability tended
to underestimate the experimental uncertainty (refer to Figures 4 and 5), it is of interest to reexamine this
conjecture using the new procedure.
The new procedure was repeated using the same synthetic experimental dispersion data as the previous
example (refer to Figure 1c), except rather than using only a single layering parameterization consisting
of 3 layers, five different layering parameterizations were used to account for epistemic uncertainty in the
parameterization selection. The five parameterizations were based on the Layering by Number (LN) schema
and included LNs of 3, 5, 7, 9, and 14. These parameterizations were selected because they were all deemed
acceptable when this same set of experimental dispersion data was inverted by Vantassel and Cox (2021). In
practice, the analyst must decide carefully which parameterizations to pursue, as this can strongly impact
the resulting inversion-derived Vs profiles. We recommend investigating a number of trial parameterizations,
and the reader is referred to the previous study by Vantassel and Cox (2021) for a more thorough discussion
on the number and type of parameterizations to use in their inversions. The five parameterizations noted
above were used to invert different sets of N=250 dispersion realizations (i.e., 1250 realizations in total).
14Figure 9: Uncertainty-consistent Vs profiles considering a single inversion parameterization for a
synthetic example using the newly proposed procedure. In order to better illustrate their concentration,
the profiles have been discretized in terms of depth and Vs, binned into cells, and color mapped in terms
of the number of profiles in each cell. Panel (a) summarizes the Vs profiles resulting from the inversion of
the N=250 realizations of the experimental dispersion data alongside the true solution, the discretized log-
normal median, and the 95% confidence interval (CI). Panel (b) illustrates the lognormal standard deviation
of Vs (σln,V s ) of the 250 profiles shown in panel (a). The sharp spikes in σln,V s are due to the uncertainty
in the profile’s layer boundaries, reflecting a shortcoming in how σln,V s has been calculated historically, and
are not the result of actual uncertainty in Vs directly.
N=250 realizations per parameterization was selected to ensure that each parameterization would have a
sufficient number of realizations to each individually capture the uncertainty of the experimental disper-
sion data, as it is important to not discount the intra-parameterization variability when investigating the
inter-parameterization variability. This, of course, is not the only approach available to consider the inter-
parameterization variability. An alternative method examined during the course of this study is to invert a
single set of N realizations with various parameterizations. This alternate approach was found to produce
similar results to those using the presented method, however, since the presented method is believed to be
more robust, as it ensures each parameterization remains separate, it is the one selected here.
The results from the newly proposed procedure when accounting for multiple layering parameterizations
are shown in Figures 10, 11, and 12. Figure 10a compares the theoretical dispersion curves fit to the
1250 realizations of the experimental dispersion data with the original experimental dispersion data. The
theoretical dispersion curves are colored in terms of their dispersion misfit relative to the original experimental
dispersion data (not their respective realizations) and are again shown to follow a reasonable distribution of
low misfit (0.0 0.2 0.4 0.6 0.8 1.0 (b) ~3Hz (c) ~6Hz
(a) Dispersion Misfit
Probability Density
Exp. Disp. Data
300 275 325 175 215
(d)Vr (m/s) (e)Vr (m/s)
Vr (m/s)
~13Hz ~30Hz
200
100
3 101 30 95 110 85 100
Frequency, f (Hz) Vr (m/s) Vr (m/s)
Figure 10: Qualitative assessment of the newly proposed procedure for propagating experimental dis-
persion uncertainty into the inverted Vs profiles considering multiple inversion parameterizations
for a synthetic example. Panel (a) shows the experimental dispersion data and the inverted theoreti-
cal dispersion curves fit to the 1250 realizations (5 parameterizations with N=250 realizations each) of the
experimental dispersion data. The theoretical dispersion curves have been colored according to their disper-
sion misfit values relative to the original experimental dispersion data, not their respective realizations. The
vertical dashed lines in panel (a) at approximately 3, 6, 13, and 30 Hz denote the location of the “slices”
shown in panels (b), (c), (d), and (e), respectively. These “slices” compare the measured experimental
dispersion data’s distribution (solid black line) with the distribution of Rayleigh wave velocity (Vr) derived
from inversion (histogram).
dispersion realizations (i.e., N=250 profiles per parameterization * 5 parameterizations = 1250 profiles). To
better illustrate their concentration, the Vs profiles have been discretized in terms of depth and Vs, binned
into cells, and color mapped in terms of the number of profiles in each cell. The inverted Vs profiles are
shown alongside the true solution, discretized lognormal median Vs profile, and lognormal 95% CI profiles.
As expected, the inverted profiles qualitatively show more uncertainty than when a single parameterization
is considered (refer to Figure 9a for comparison). This distinction is most apparent at the layer boundaries,
as the locations of these boundaries are controlled predominantly by the assumed layering parameterization.
Parameterizations with many layers will tend to result in smoother profiles with gradual changes in Vs,
while parameterizations with only a few layers will tend to result in profiles with sharper contrasts (Cox
and Teague, 2016). As the true site layering may not be known prior to surface wave inversion, there is
often a need to consider multiple parameterizations with different numbers of layers to properly address one
of surface wave inversion’s main sources of epistemic uncertainty. Figure 12b presents σln,V s of the 1250
profiles. The uncertainty across multiple parameterizations is shown to increase in regards to what was
observed previously for a single parameterization (refer to Figure 9b for comparison). Specifically, σln,V s
is now closer to 0.1 within any given layer, thereby confirming quantitatively what was already observed
qualitatively in Figure 12a. The increase in σln,V s lends confidence to the conjecture that the uncertainty
resulting from multiple parameterizations will tend to exceed that for a single parameterization, although
perhaps not to the same extent as may have been inferred previously due the tendencies to underestimate
intra-parameterization variability in previous studies. Regardless, at least for this synthetic example, σln,V s
remains quite low compared to values commonly assumed in practice (EPRI, 2012; Stewart et al., 2014;
Toro, 1995).
16You can also read