A Method to Account for Personnel Risk Attitudes in System Design and Maintenance Activity Development - Mdpi
←
→
Page content transcription
If your browser does not render page correctly, please read the page content below

systems
Article
A Method to Account for Personnel Risk Attitudes in
System Design and Maintenance Activity Development
Benjamin W. Rathwell, Douglas L. Van Bossuyt * , Anthony Pollman and Joseph Sweeney III
 Department of Systems Engineering, Naval Postgraduate School, Monterey, CA 93943, USA;
 ben.rathwell@gmail.com (B.W.R.); agpollma@nps.edu (A.P.); jwsweene@nps.edu (J.S.III)
 * Correspondence: douglas.vanbossuyt@nps.edu

 Received: 10 June 2020; Accepted: 31 July 2020; Published: 4 August 2020

 Abstract: Systems engineering practices in the maritime industry and the Navy consider operational
 availability as a system attribute determined by system components and a maintenance concept.
 A better understanding of the risk attitudes of system operators and maintainers may be useful
 in understanding potential impacts the system operators and maintainers have on operational
 availability. This article contributes to the literature a method that synthesizes the concepts of system
 reliability, and operator and maintainer risk attitudes to provide insight into the effect that risk
 attitudes of systems operators and maintainers have on system operational availability. The method
 consists of four steps providing the engineer with a risk-attitude-adjusted insight into the system’s
 potential operational availability. Systems engineers may use the method to iterate a system’s design
 or maintenance concept to improve expected operational availability. If it is deemed necessary
 to redesign a system, systems engineers will likely choose new system components and/or alter
 their configuration; however, redesign is not limited to physical alteration of the system. Several
 other options may be more practical depending the system’s stage in the life cycle to address
 low risk-adjusted operational availability such as changes to maintenance programs and system
 supportability rather than on component and system reliability. A simple representative example
 implementation is provided to demonstrate the method and discussion of the potential implications
 for Navy ship availability are discussed. Potential future work is also discussed.

 Keywords: availability; decision-making; human factors engineering; human systems integration;
 maintenance; reliability; supportability; systems engineering

1. Introduction
     The Navy is a unique and complex organization with high tempo and extensive operational
commitments. To perform well in such a dynamic environment and continue to meet the demand of
prompt and sustained combat, operational availability is of paramount importance. Systems engineering
practices within the Navy generally consider operational availability to be a system attribute determined
by the quality and arrangement of the components within the system as well as the system’s maintenance
concept. In the existing approach to operational availability, no explicit consideration is given to the
characteristics of the personnel interacting with the system as it assumes any individual responsible for
operating or maintaining the system will follow all guidance set forth in the maintenance concept [1,2].
Continued reliable performance of the system is contingent on the system being properly operated
and maintained in accordance with said guidance. In the Navy, this responsibility falls to the officers
and enlisted personnel to promote and enforce procedural compliance as a means to ensure the system
achieves designed availability levels. While this is a valid and long-standing approach, it does not
account for the potential of the SOM to be in non-compliance with the maintenance concept.

Systems 2020, 8, 26; doi:10.3390/systems8030026                             www.mdpi.com/journal/systems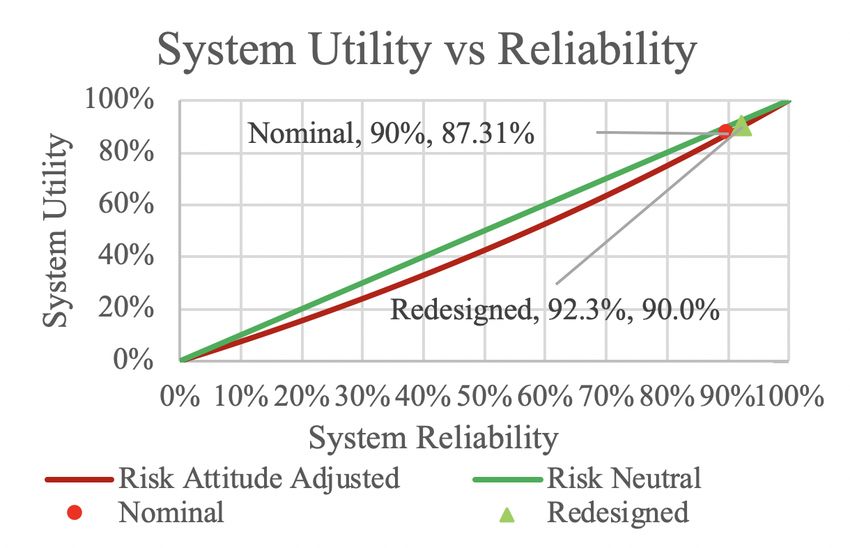
Systems 2020, 8, 26                                                                                   2 of 22

      While the operational availability of Navy systems is generally adequate at present, there is a
desire to improve further. This paper proposes a method to further improve operational availability of
systems by augmenting the system engineering processes to consider risk attitudes of the individuals
who interact with the system and analyzing individuals’ risk attitudes to predict their impact on
operational availability. ISO 73: 2009 [3] defines a risk attitude as an “organization’s approach to assess
and eventually pursue, retain, take or turn away from risk.” Rather than organizational attitudes,
this paper focuses on individual risk attitudes. Thus, for the purposes of this paper, a risk attitude is an
individual’s conscience or unconscious approach to assess and eventually pursue, retain, take or turn
away from a perceived risk. Taking individual risk attitudes into account allows systems designers and
maintenance planners to identify potential areas where improvements to the system and maintenance
processes can be made that will help to match risk attitudes of people who interact with the systems.
      A better understanding of how risk attitudes of SOM impact a system may be useful in modifying
how a system is designed and/or operated to address potential impacts to operational availability
from individuals’ risk attitudes that are not what systems engineers would otherwise have anticipated.
The method presented in this paper is intended to be implemented early in the systems engineering
process during overall conceptual system design and architecture to aid in maintenance concept
development. The method is targeted toward new systems; however, the method may be applicable to
existing systems scheduled to go through periods of major overhaul or upgrade.

Specific Contributions
      This article contributes a method to the literature that can help systems engineers during the
design phase of a system design effort identify potential SOM risk attitude issues related to not meeting
operational availability requirements. The method can be used to help inform decision-makers on
modifying components of a system or the maintenance concept of a system to incorporate the risk
attitudes of SOMs.

2. Background and Related Research
      This section presents background information necessary to understand the context of the research
presented in this article, a review of existing literature that directly relates to the contribution of this
article to the literature, and the framework in which this research exists.

2.1. System Availability
      Systems engineers generally use three high-level availability statistics to quantify whether a
system will be available for use when called upon. Inherent availability is determined by the design of
the system; it takes into account only the hardware characteristics and assumes ideal support [4,5].
Achieved availability assumes an ideal support environment as inherent availability did but extends
the calculation to include scheduled preventive maintenance [6]. Operational availability (Ao ) includes
all factors previously considered by achieved and inherent availability, but also includes logistics and
administrative delays associated with the system [4,5] as shown in Equation (1).

                                                System U ptime
                               Ao =                                    .                                 (1)
                                      System U ptime + System Downtime

     In many instances in the Navy and other similar organizations, operational availability is used in
part because it provides the most representative picture of system availability [5,7–9]. For this reason,
we use operational availability in the development and demonstration of the methodology below.
In most applications, system uptime and downtime are further disaggregated into three categories
including—(1) system operational time which is a function of system reliability, (2) maintenance
actions, and (3) supportability issues [5,6]. Subsequent subsections discuss the individual components
of operational availability and potential methods for improvement.
Systems 2020, 8, 26 3 of 22
2.2. System Reliability
Reliability is often defined as the likelihood that a system will work when expected [5]. A system
with low reliability has a low probability of being in working condition when called upon and usually
will have lower operational availability due to greater system downtime. Within a system, an individual
component’s reliability is a function of the time period of interest and the MTBF. The exponential
reliability function is shown in Equation (2), where t represents the time period of interest and M
represents the MTBF of the component is commonly used to model component reliability [6].
t
R(t) = e− M . (2)
However, not all components and equipment are well-modeled by the exponential reliability
function. While many other reliability functions are available; in the context of this research [10],
we focus on the exponential function. The inverse of MTBF is the failure rate (λ).
Two common approaches to improve availability include—(1) implement changes to components
(such as replacing low reliability components with higher reliability components [11–13] or adding
redundancy [14,15]) that improve system reliability and thus system uptime, and (2) change the
maintenance concept of the system to reduce system downtime (often via preventative maintenance [16,17]
which improves MTBF) [1,18].
Methods that focus on changing maintenance practices to improve system reliability generally use
preventive maintenance to increase the effective MTBF of the system [16,17]. When using preventive
maintenance to increase system reliability, system downtime is determined by both component failure
(MTBMu ) and scheduled preventive maintenance (MTBMs ) [4,6]. Overall MTBM can then be calculated
with Equation (3) [7,8].
1
MTBM = 1 1
. (3)
( MTBM u
) + ( MTBM s
)
System downtime is then measured by the mean active maintenance time, M, determined by both
corrective and preventive maintenance times. Additional reliability information and background is
available in References [4,19]. Further discussion of maintainability is provided in the next subsection.
2.3. Maintenance Strategies
Maintainability is a system design characteristic that captures how easy it is to maintain a system,
how accurately the maintenance can be done, the safety of performing the maintenance actions, and the
cost of performing maintenance [6]. Systems designed to be maintainable capitalize on the system’s
maintainability characteristics to improve reliability which leads to better operational availability for
the overall system. While the reliability of a system is largely determined by the system’s design,
it can be positively or negatively impacted by the frequency and quality of maintenance performed on
the components [17]. To ensure a system remains reliable throughout its operational life, one must
ensure that the system is properly maintained. Swanson [17] presents three strategies commonly used
in the approach to maintenance. Reactive maintenance is conducted in response to a failure in the
equipment. In this method, MTBM is equivalent to MTBMu . Proactive maintenance incorporates
predictive and preventive maintenance practices to extend the MTBF of system components. In general,
MTTR describes how long it takes to repair a system. Swanson’s “aggressive strategy” to situations
where reactive and proactive maintenance are not enough to achieve sufficient system availability is
to improve system function and design at the penalty of increased cost, requirements for resources,
training, and integration.
Waeyenbergh and Pintelon suggest expanded maintenance strategies beyond Swanson’s strategies
be introduced such as the “integrated business concept,” and note that as maintenance strategies
become more integrated, there has been “a shift from failure-based to use-based maintenance and
increasingly towards condition-based maintenance” with increased emphasis on the productionSystems 2020, 8, 26 4 of 22
facilities in terms of reliability, availability, and safety [1]. Others have suggested optimizing system
availability such as through genetic algorithms and similar to balance preventative and corrective
maintenance actions [14,20]. While these approaches are useful for optimization of maintenance,
they generally rest on the assumption of ideal logistics support which is at odds with the formulation
of operational availability. For this reason, it is important to consider the supportability characteristics
of the system which is discussed further in the next subsection.
2.4. Supportability
Supportability is a system aspect primarily concerned with the logistics and support mechanisms
by which a system is acquired, installed, and subsequently maintained [6]. With regard to operational
availability, the most significant supportability aspects focus on system maintenance and support,
and the ILS system that provides the materiel [21]. ILS contains four objectives, including—(1) make
considerations for system support integral to the design; (2) develop coherent, design-focused support
requirements to achieve readiness objectives; (3) obtain adequate support; (4) provide support at
minimum cost throughout the system’s operational phase. ILS is effected by administrative down
time ADT and logistics delay time LDT [7,8]. ADT is the amount of time the system is inoperable
for administrative reasons such as organizational constraints, administrative approval processes,
personnel assignment priorities, and so forth. LDT is the amount of time the system is inoperable due
to lack of parts, facility space, test equipment, and so on. System downtime—otherwise known as
MDT—is, thus, defined by Equation (4).
MDT = M + ADT + LDT. (4)
Thus, Equation (1) can be fully defined as follows in Equation (5).
MTBM
Ao = . (5)
MTBM + MDT
Reducing LDT, as part of a supportability push in the Navy, is an ongoing effort [22,23].
The broader impact of supportability on Ao has been recognized for some time [24]. However, while
the role of SOM is represented in many of the components of A0 , the impact of SOM risk attitudes has
not been explicitly considered.
2.5. Risk Attitudes of SOMs
In the context of the present discussion, the risk attitudes of SOMs are important to understand
in relation to their work on systems. We ascribe to the opinion of much of the literature, that risk
attitude can be mapped on a utility function as a personality trait [25]. Humans are integral to the
operation and maintenance of almost all systems in the Navy’s inventory. Many consider Naval
vessels to be SOS where hardware and software systems, and humans are integrated together into a
larger SOS [5,6] which integrates into the larger concept of mission engineering where Naval assets
are brought together to accomplish specific missions and objectives [26]. With such a significant effort
placed on reliability as a factor in maximizing operational availability [5], substantial effort must be
made and great care taken to understand how to best design the systems to accommodate (and in
some instances withstand) interactions with SOMs as part of HSI [27]. Two benefits of addressing
the human element from a HSI perspective are significant reductions in waste and substantial system
productivity and performance increases [27]. HSI helps to maintain high operational availability for a
system by addressing the usability characteristics of the system for the SOMs. While good hardware
and software design can improve system usability, a variety of factors must also be explicitly taken
into account including anthropometric characteristics, sensory factors, physiological factors, cultural,
and psychological factors [6,27,28].Systems 2020, 8, 26 5 of 22
Psychological factors within the context of usability and HSI relate to personal attitudes,
risk tolerance, and motivation [5,28,29]. Psychological factors are of specific interest to this research
as they relate to the likelihood that a SOM will perform his or her duties as expected. The field of
HRA in part examines psychological factors that can reduce the reliability of humans to complete
tasks [29,30]. For instance, maintenance errors can sometimes be attributed to psychological factors,
which Dhillon attributes to six factors including: “recognition failures, memory failures, skill-based
slips, knowledge-based errors, rule-based slips, and violation errors” [29]. This does not imply that a
system cannot be designed without expressly addressing these factors, but rather available information
on the psychological disposition of the SOMs should be incorporated to improve the system design
process [6]. Methods already exist to understand the psychology [31] and risk attitudes of engineers
designing systems [25], and incorporate those attitudes into design decision-making processes [32].
However, we are unaware of any existing methods or processes that explicitly consider the risk
attitudes of SOMs in the context of operational availability of systems in general and especially in the
context of Naval systems.
In order to understand the risk attitudes of SOMs, a repeatable method of testing is needed.
Many methods exist in the literature to choose from although none is specifically tailored to SOMs.
For instance, the DOSPERT psychometric risk survey tests people for risk tolerance and risk aversion
across personal domains of risk [33]. An extension to DOSPERT was made for engineers in their
professional capacities [25]. Other methods such as choice lotteries are also available [34]. Recent
research indicates that a general risk aversion-risk seeking inclination may be present in individuals
that applies across domains [35]. Risk attitude data from psychometric survey techniques has been
found to be aspirational in nature while choice lotteries are generally predictive [32,36]. In this research,
we take the perspective of aspirational risk attitude measures (i.e., psychometric risk surveys) in line
with existing research on applying risk attitudes to engineering analyses and trade-off studies [32,37].
Risk attitudes encompass how individuals respond to situations where there are potential rewards
and costs to specific choices. For instance, time pressure, insufficient time to perform a task completely
and at high quality, difficulty of activity, and other factors all are intrinsically evaluated by an individual
using the individual’s risk attitudes. An individual’s risk attitude can be thought of as modifying an
expected value representation of a set of decision choices so that a choice that otherwise would not
have been as attractive to take becomes the most attractive choice among the set [33,36].
High reliability organizations, typical of most military or other organizations in which individual
decisions can have catastrophic outcomes, attempt to train and exercise in order to modify personal
behaviors independent of their individual risk attitudes [38]. However, in spite of this, our combined
professional experience indicates that no training is perfect and years of bad habits can make correcting
risk attitudes difficult. While the investigation is ongoing, it is thought that the most likely cause of the
recent fires aboard the USS Bon Homme Richard (a Landing Helicopter Deck (LHD) class ship), while it
was in port undergoing a maintenance retrofit, was human error while conducting maintenance [39].
The crew and civilian maintenance teams were undoubtedly all well trained and aware of proper
procedures as is almost universally required in the U.S. Navy. Yet, a fire, which ultimately damaged
11 of 14 decks causing hundred of millions of dollars in damage [40] (or a replacement cost of $4
billion [41]), started in the lower vehicle hold where oily rags were being stored during maintenance.
Making matters worse, the halon fire suppression system had been disengaged. It is clear that the
U.S. Navy believes this was human error, because if it was systemic or technical error, the other seven
Wasp-Class LHD class ships would be called to port (unless operations do not permit, at which point
the discussion becomes about enterprise risk attitudes). Incidents like the fire aboard the Bon Homme
Richard serve as a feedback mechanism for improving training and processes, as well as holding
negligent personnel liable and highlighting the importance of accounting for individual risk attitudes
in maintenance activities.
Sabotage by maintenance personnel also serve to illustrate how individual attitudes have a large
impact on operations. In 2013, a shipyard worker set fire to rags aboard the nuclear submarine,Systems 2020, 8, 26 6 of 22
USS Miami, because he wanted to go home early [42]. While still undetermined, but possibly sabotage
by maintenance personnel, the destruction of S.S. Normandie (aka: USS Lafayette) in New York Harbor
in 1942 during a retrofit from luxury ocean-liner to troop transport also serves to illustrate how risk
attitudes of individual maintenance personnel can have extremely large impacts upon the overall
system [43,44]. The risk of simply missing a scheduled preventative maintenance, or declaring
something operational when it is not, is different than large ship-damaging or destroying fires.
But, because the risk is likely perceived to be lower, oversights in preventative maintenance are
probably much more common.
Our combined personal experiences in the U.S. military and civilian industry support the notion
that smaller maintenance tasks may be skipped or falsified as being complete, having observed
maintenance and readiness records that may have been falsified for a host of different reasons. Two of
the four authors have also served as maintenance officers in the U.S. military, and one is a war
veteran. In our observations, both leaders and maintenance personnel weigh risk based on their
individual perception of cost versus reward. In situations where there is a very demanding schedule
and many competing requirements, the perception of cost versus reward often appears to skew
further. For example, the Marine Corps may require weapons preventative maintenance weekly,
but the reality is that weapons often are not cleaned until leadership makes it a priority over the litany
of other operational and training requirements simultaneously levied. Such a priority is currently
being implemented by the U.S. Navy following the USS Bon Homme Richard fire [45]. The risk of
not cleaning weapons weekly is probably negligible in peace time, although if enough time passes
rust and pitting can damage a weapon beyond repair. However, in a war zone, where training
requirements cease and operations are the focus, cleaning weapons takes on a much more urgent
tone. The point is, from an idealized perspective, training and exercises should sufficiently modify
behaviors independent of individual risk attitudes, but people still frequently take risks based on the
immediate context and their own risk attitudes. Training, exercises, individual and collective risk
attitudes, processes, competing requirements, and a whole host of other variables ultimately impact
maintenance behaviors. This article specifically focuses on individual risk attitudes as a variable and
takes the perspective that while training and exercises may help to change individual risk attitudes to
a degree, often times said individual risk attitudes do not significantly change.
2.6. Utility Theory
Utility theory can be used to help make decisions based on risk attitude information as has been
demonstrated in the literature using engineering risk attitudes from a psychometric test [32] where
the utility function was adjusted based on risk attitude. In the case of [32], the value was specified in
monetary units as is often the case with the broader field of utility theory research [46]. The relationship
between value and its utility can often be defined mathematically which results in a utility function.
This can be expanded to adopt a risk attitude as the utility function [47]. The exponential utility
function in particular has been demonstrated in the literature as being useful for risk attitude-driven
decision-making [32]. We adopt the exponential utility function for the purposes of this research.
While the method for a MTBF that can be described by an exponential function is demonstrated in
this article, many functions that represent MTBF for a variety of types of equipment and circumstances
are available in the literature. Keeney and Raffia [48] provide quadratic and logarithmic utility function
formulations. Additional guidance on formulation of utility functions is given in the literature [49,50].
While many different distributions of MTBF are found in the literature, we have specifically focused
on the exponential function in this work to demonstrate the proposed method. Appropriate utility
functions for other MTBF distributions can be inserted in place of the exponential function formulation
found herein.
A utility function is often used to compare the relationship between multiple sets of choice
outcomes and, based on the nature of the relationships being investigated, the utility of the value
of each potential choice may increase or decrease. This relationship is generally assumed to beSystems 2020, 8, 26 7 of 22
monotonically increasing (Equation (6)) [47] although in some instances, the relationship and thus the
utility function may be decreasing (Equation (7)) instead. In the case of understanding operational
availability, some parameters such as reliability are monotonically increasing in nature while others
such as MTTR and the time spent conducting maintenance actions are inversely related to operational
availability and thus are decreasing.
x − Low
e ρ −1 , p 6= ∞
High− Low
u( x ) = e ρ −1 (6)
x − Low
High− Low , otherwise
High− x
e ρ −1 , p 6= ∞
High− Low
u( x ) = e ρ −1 (7)
High− x
High− Low , otherwise.
In Equations (6) and (7) above, ρ represents risk tolerance [47]. The high and low values form the
upper and lower bounds of the value in question. The depth of the function’s curve when graphically
plotted is dependent on the value of ρ. A larger value of ρ results in a less pronounced curve, while a
smaller value results in a curve that is more pronounced [47].
2.7. Contextualizing this Research within the Systems Engineering Process
In order to contextualize the research presented in this article, it is important to understand the
systems engineering process and how this research fits within the process. The systems engineering
“vee” model is an often used model of the systems engineering process although not exclusively [6].
Impacts to operational availability can be traced to nearly every location on the entire “vee” model.
The area of specific interest to this research is in the integration and verification steps during the
system operation phase where SOM action or inaction based in part on SOMs risk attitudes can directly
impact operational availability through system downtime. However, the issue of SOMs risk attitude
impact on operational availability can be traced to the decomposition and definition phase of the “vee”
model. Thus this implies an iterative approach where feedback from currently operating systems
and understanding SOM risk attitudes can be used to design new systems to better meet SOM risk
attitudes and in turn improve operational availability.
The usefulness of employing a systems engineering approach to risk-informed systems
engineering and design is that it helps system owners to better understand the relationship between
risk attitudes in SOMs of systems and their effects on system operational availability. In understanding
how system operation and maintenance is likely to be conducted, engineers can apply lessons learned
to both equipment overhauls and ground-up system development. Successful implementation of
risk attitude-informed adjustments during the design phase through aspirational system designs
as described above and as implemented in this research below may provide improved system
performance through matching system design to realistic operational and maintenance requirements.
3. Methodology
The methodology presented below synthesizes concepts of reliability, risk attitudes, and utility
theory to quantify otherwise qualitative characteristics of SOMs as they relate to operational availability.
The process consists of a preparatory step and four main steps providing the engineer with a
risk-attitude-adjusted insight into the system’s utility as determined by a system value parameter,
which in this case is system or component reliability. The method has a provision for systems engineers
to use the output of the first three steps to inform any necessary iterations to the system design process.
As systems engineering is an iterative and recursive process, it may be necessary to perform steps three
and four until reaching a satisfactory outcome. Figure 1 graphically shows the steps of the method.Systems 2020, 8, 26 8 of 22
Figure 1. Process diagram of the proposed methodology.
3.1. Pre-Step: Identify System Attributes that Impact Operational Availability
Prior to starting the method, narrowing the field of potential system attributes that impact
operational availability is recommended. While the interested practitioner could consider all potential
attributes throughout the proposed method, we advocate for only examining one attribute at a time
to more clearly understand the interplay between SOM risk attitudes, the attribute being considered,
and its impact on operational availability. Potential attributes include reliability, maintainability,
and supportability. This article focuses on reliability because our past operational experiences strongly
anecdotally indicate that reliability is a significant contributor to operational availability and is also
tied to risk attitudes of SOMs; however, the other above identified attributes may also be useful for
practitioners to pursue in some cases.
After choosing which attribute to examine, requisite information needs to be collected about
the system. For instance, in the case of reliability, an understanding of component reliability and the
Reliability Block Diagram (RBD) of the system of interest is needed. Further information on RBDs and
basic reliability concepts is available in [6,19].
3.2. Step 1: Determine Risk Attitudes of SOMs
After completing the pre-step, the first step of the method is to understand the risk attitudes
of the SOMs involved with the operation and maintenance of the system. In order to achieve this,
five sub-steps must occur including (1) select the risk assessment tool, (2) determine SOM risk attitudes,
(3) determine relative risk impact, (4) calculate risk coefficient, and (5) identify SOMs of interest.Systems 2020, 8, 26 9 of 22
3.2.1. Step 1.1: Select the Risk Assessment Tool
In the case where aspirational risk attitudes are useful for system design, an aspirational risk
attitude test is prescribed such as the DOSPERT psychometric risk survey. Predictive risk attitudes can
be elicited from choice lotteries and other related survey instruments [25,32,33]. There may be cases
where the practitioner wishes to use predictive risk attitudes in which case we recommend choice
lotteries. But, as discussed earlier, we propose that aspirational system design is more appropriate
than predictive system design from the perspective of SOM risk attitudes. This is in line with the
literature such as Reference [32] where the authors developed aspirational space mission designs to
meet the expectations of key stakeholders.
While some evidence exists that custom tailored psychometric risk surveys are most appropriate
to understand specific domains of risk attitudes, such as within a person’s private life or professional life,
developing a psychometric risk survey specifically tailored for SOMs within the context of Naval vessels
is beyond the scope of this research [25,33]. Some recent research indicates that understanding general
risk aversion and tolerance may apply across many domains [35]. For these reasons, we recommend
that practitioners use DOSPERT or a related psychometric risk survey [25,33] to gain a high-level
understanding of SOM risk attitudes. If further refinement of analysis conducted from the method
presented in this article is desired, a tailored psychometric risk survey may be justified. Further
information on developing psychometric risk surveys is available in the literature [51–55]. While the
DOSPERT test was developed from a personal, private life risk attitude perspective, these domains
are generally well-aligned with potential broad domains of risk attitudes of SOMs at their jobs.
This research is echoed in the investigations of decentralized decision-making in structural health
monitoring systems as well as military operational risk taking [56,57].
3.2.2. Step 1.2: Determine Risk Attitudes of SOMs
To determine each SOM’s individual risk attitudes a representative pool of SOMs are given
a psychometric risk survey asking for their perception of various scenarios involving risk-based
decisions. The results of the surveys are then analyzed to identify risk attitudes. The risk attitude
information is then translated into a set of coefficients indicating his or her risk tolerance or aversion in
each domain. Depending upon which psychometric risk survey is used, a variety of risk domains are
produced. In the case of DOSPERT, five domains including ethics, finance, health/safety, recreation,
and social are used. While some literature indicates that risk domains can be collapsed into one risk
aversion-risk tolerance scale [35], we suggest waiting to average between the risk domains until a later
sub-step in the proposed method.
For purposes of calculations performed in this method, the range of possible risk attitudes is set
between −1 for complete risk aversion to 1 for complete risk tolerance. Others using psychometric risk
surveys to help make system design decisions have used a −3 to 3 scale in their work [25]; however,
the scales can be renormalized around any cardinal number set. A value of 0 indicates completely
risk-neutral decision-making. Table 1 provides an example of an individual SOM’s personal risk
attitude composition across the five risk domains from DOSPERT. In this instance, the SOM is risk
averse in two domains, risk tolerant in two domains, and risk neutral in a single domain.
Table 1. Example Personal Risk Attitude Composition of a SOM Using the DOSPERT Psychometric
Risk Survey.
Risk Domain Value (Nominal) Risk Attitude
Ethics −0.2 Risk Averse
Finance 0.2 Risk Seeking
Health/Safety 0.1 Risk Seeking
Recreation 0 Risk Neutral
Social −0.3 Risk AverseSystems 2020, 8, 26 10 of 22
We propose that risk aversion as it pertains to reliability is equivalent to being risk neutral.
This is based on our own observations of SOMs working on various Naval systems where almost any
SOM exhibiting either risk neutral or risk averse risk attitudes exhibits the same levels of procedural
compliance—namely, full compliance. However, practitioners must choose for themselves if they
believe the proposal to change any risk averse scores to being risk neutral is valid.
3.2.3. Step 1.3: Determine the Relative Risk Impact
While an individual SOM’s risk attitude in each risk domain identified by a psychometric risk
survey such as the DOSPERT has an impact on the operational availability of the system, the impacts
are not uniformly consistent across the set of domains for a given value. For instance, an individual’s
desire for social acceptance may lead the individual to decision-making that has a significant impact
on the system the individual maintains, whereas the individual’s risk attitude in the recreation domain
would be inconsequential. While readily understandable using intuition and engineering judgement,
there is limited research available to provide quantitative data for these relative impacts; however,
the method presented in this article has the ability for systems engineers or other decision-makers to
include such effects. Thus we propose implementing a relative risk attitude impact correction factor.
To implement this method, relative risk attitude impact correction factors need to be intelligently
estimated by maintenance SMEs based on their collective experience and the specific context. This is no
easy task, as it requires both judgement and expertise, and individual SMEs may judge risks differently
(just like individual risk attitudes ultimately impact maintenance). We recommend evaluating each of
the domains of risk attitude for applicability to the specific context and applying a weighting to each
domain based on the relative importance of the domain to the context. For instance, a SME may judge
that the impact of the social risk domain to a maintenance action to be very low. Thus where a relative
impact correction factor of 1 represents no correction from the DOSPERT risk domain scores, a relative
risk attitude impact correction factor of 0.25 indicates a significant discounting of that particular risk
domain from being applicable to the specific context the SME is evaluating. Conversely, a score of 1.5
on the health/safety risk domain indicates that the domain is believed to be very important by the SME.
This approach of eliciting relative risk attitude impact correction factors is similar to multi-attribute
decision making [58,59].
We emphatically note that the proposed method is not intended to be a highly rigorous,
hard-and-fast decision-making tool used for detailed decisions late in the design process but instead is
targeted for use during the system architecture phase of design as a tool for better understanding what
impact risk attitudes of SOMs have on operational availability. While the method is quantitative in
nature, it is not intended to be used as the only decision-making tool or to choose between very similar
options. Instead, the method presented here is meant to be used to better inform decisions made about
system design and the system maintenance concept.
Table 2 provides a representative set of potential relative risk attitude impact correction factors for a
generic situation with reference to maintenance on board a Naval vessel. The relative risk attitude impact
correction factors shown in Table 2 were developed by U.S. Navy maintenance SMEs and may be useful
to practitioners working with similar naval systems. A practitioner using this method is advised to
develop relative risk attitude impact correction factors appropriate to the system under analysis.
Table 2. DOSPERT Risk Domains with Relative Risk Attitude Impact Correction Factors (Denoted as
Relative Impact in the Table) Appropriate to the System Under Analysis. Note That These Factors are
Examples and That Practitioners are Advised to Identify Appropriate Factors for the System of Interest.
Risk Domain Relative Impact
Ethics 1.2
Finance 1.1
Health/Safety 1.5
Recreation 0.2
Social 1.35Systems 2020, 8, 26 11 of 22
3.2.4. Step 1.4: Calculate Risk Coefficient
After determining both the SOM’s individual risk attitude in each of the risk domains, as well
as noting the impact the domain itself has on operational availability via the relative risk attitude
impact correction factor which is based on the selected system attribute—we selected reliability
earlier in the description and continue using reliability here—multiplying the two values together
yields a domain-specific risk-decision impact. Upon determining the values for each domain-specific
risk-decision impact, summing them together provides a single value which is representative of the
SOM’s overall risk attitude and expected impact on the reliability of the system with which the SOM is
interacting, Rtot , as shown in Equation (8).
5
Rtot = ∑ Tn In . (8)
n =1
In Equation (8), n is the risk domain (in the case of DOSPERT, ethics, finance, health/safety,
recreation, social), Tn is the risk tolerance or aversion in domain n as derived from the risk survey,
and In is the relative risk attitude impact correction factor of the risk domain on reliability of the
system. Reducing the set of domain values to a single number is useful for several reasons including its
ability to be used as a scaling factor in a utility function such as how [32] used a similar combination of
multiple risk domains in situations where direct mapping from risk domains to a specific risk-informed
design decision cannot be made. In the context of operational availability of Naval vessels and when
using DOSPERT or a similar psychometric risk survey that is not specifically tailored to answer Naval
vessel operational availability questions, we suggest that it is appropriate to combine multiple risk
domains together into one risk attitude only after considering the relative impacts of each risk domain
on operational availability as described above.
3.2.5. Step 1.5: Identify Specific SOMs of Interest
The final sub-step in Step 1 is to identify the specific SOMs that are of specific interest to a system
engineer working on improving the operational availability of a system. Not all SOMs contribute
equally to the operation and maintenance of a system. Thus it may be appropriate to focus on one
individual SOM that has the most contact with a system or it may be appropriate to look at many
SOMs to determine an average Rtot . We recommend that the decision only to analyze one individual
versus a group of SOMs should be based on whether many SOMs work on a specific system or if one
dedicated SOMs will exclusively work on the system.
If many SOMs will work on the same system, analysis of risk attitudes across the domains of
risk utilizing DOSPERT may reveal similar risk attitudes among the various factors within a group of
SOMs. Alternatively, the analysis may reveal large standard deviations within the domains indicating
disparate risk attitudes. Given a sufficiently low standard deviation, using the average risk attitude of
the SOMs may be desirable for encapsulating SOM risk aversion or risk seeking at a high level.
While this approach works with any group of SOMs, analysis of certain subsets of personnel
may prove more useful than others. For instance, an engineer may survey all personnel who
do a specific kind of maintenance on a specific class of ship, or a representative subset of them.
Depending on the magnitude of deviation from an average score, the population can be said to
have a relatively homogeneous risk attitude connoting confidence in any subsequent risk impact
determination. Conversely, large deviations suggest the average risk attitude to be of low utility as an
input to the risk utility function.
In the case of Naval vessels and other similar large systems staffed by SOMs who have gone
through similar indoctrination and experiences, we suggest that averaging across a representative
respondent pool of SOMs that may serve aboard a vessel of interest (the system of interest) is
appropriate. This is in line with how current Naval personnel and staffing actions are taken where the
vast majority of systems are operated and maintained by many different individual SOMs and no oneSystems 2020, 8, 26 12 of 22
system is the sole purview of one individual SOM. Equation (9) demonstrates how to combine the Rtot
of several SOMs where n is the number of SOMs being analyzed and Rtotx is the Rtot value for SOM x.
n
Rtotavg = ∑ Rtotx . (9)
x =1
3.3. Step 2: Develop the Utility Function
Next, an appropriate utility function must be selected to evaluate the system attribute of
interest—in our case, reliability—in the context of operational availability. As discussed in Section 2.6,
we advocate using a monotonically increasing exponential function which is shown in its generic form
in Equation (6). Adapting Equation (6) to include the impact of risk attitudes from SOMs on a system
per the previously described process of calculating Rtotavg leads to Equation (10) where ρ is the risk
coefficient which is inversely related to the risk tolerance of the SOM, the value x is the reliability of
the system, and the utility u( x ) is the risk-adjusted impact to the expected operational availability of
the system.
x
e ρ −1 , p 6 = ∞
−100
u ( x ) = e ρ −1 (10)
x
100 , otherwise.
3.3.1. Step 2.1: Inversion and Application of a Scaling Factor
As is evident in Equation (10), increasing the value of ρ produces a less pronounced curve, which
incorrectly associates increased risk-attitude with decreased impact on the system. Equation (11)
corrects the relationship of ρ with risk attitudes:
1
ρ=− , (11)
( Rtot − 1)( Fs )
where ρ indicates the depth of the utility function, Rtot represents the overall risk attitude of the SOM,
and Fs represents a scaling factor indicating the impact of risk attitudes on system reliability. While the
scaling factor can be empirically derived given significant quantitative historical data, this data often
does not exist or is challenging for the practitioner to access and thus we suggest instead to follow the
approaches [32] and others used to identify a useful Fs . In general, rules of thumb exist for a variety of
industries such as the oil and chemical industries [60] and additional guidance is given by others [47,61].
It is important that practitioners select an appropriate Fs for their specific industry, company, system,
and other similar factors. It is beyond the scope of this article to give detailed guidance on selecting an
appropriate Fs and we refer those interested in learning more to the above references.
3.3.2. Step 2.2: Graphical Representation of the Utility Function
The final sub-step in Step 2 is to produce a graphical representation of the utility function
developed previously. While having a graphical representation of the utility function is not strictly
necessary, it can be useful to visualize the utility function for better understanding the results of the
calculations performed later. Figure 2 shows a set of utility functions plotted out with system reliability
providing the value input to the functions. The functions are differentiated by a variety ρ values where
risk tolerance is indicated in red (positive values) and risk aversion is shown in green (negative values).
The blue line (a value of 0) indicates a perfectly risk neutral ρ. The further away from risk neutral ρ is,
the larger the representative curve on Figure 2.
In the case of a risk neutral ρ (indicating a perfectly risk neutral SOM) and a system with a nominal
reliability of 90%, the utility of the system is also 90%. However, a risk-seeking SOM diminishes the the
utility of the system according to the magnitude of the SOM’s risk attitude, as defined in Equation (8).
While a risk averse SOM may seem ideal to increase operational availability, there remains a needSystems 2020, 8, 26 13 of 22
to balance cost versus operational availability where, for instance, a risk averse SOM may perform
significantly more preventative maintenance than is needed. Note that the utility functions depicted in
Figure 2 are likely more extreme than what would be typically observed based on the literature [32];
however, we have displayed these likely extreme utility functions to demonstrate how changing ρ can
significantly change the utility of a specific decision set for a given value.
Figure 2. System Utility as a Function of Reliability for a Variety of Monotonically Increasing
Exponential Utility Functions with Varying ρ Values. Negative (Green Line) ρ Values Indicate Risk
Aversion While Positive (Red Line) ρ Values Indicate Risk Tolerance. Note that the Utility Functions
are Exaggerated for Demonstration Purposes.
3.4. Step 3: Evaluate the System
Now that the utility function has been fully developed, a practitioner is able to determine the
effect of a SOM or group of SOMs’ risk attitude on system utility from the perspective of reliability as
it relates to operational availability. In order to use Equation (10) to evaluate the system, a practitioner
needs to have previously calculated ρ from Equation (11). Recall from Step 2 that x in Equation (10) is
the reliability of the system likely calculated from a RBD and available reliability data. The result of
Equation (10) is a risk attitude-adjusted utility which relates to system reliability. For instance, a system
designed with an objective reliability of 95% has a risk neutral utility of 95%, but if the outcome is
adjusted to account for a risk-tolerant SOM, it may be that the risk-attitude adjusted utility is 92%.
While the objective utility of the system is defined as 95%, if the threshold utility for that system is
90%, a risk-attitude adjusted utility of 92% may still be sufficient and fail to trigger iteration of the
design process. However, if the objective and threshold utility values are equal or the stakeholder hasSystems 2020, 8, 26 14 of 22
sufficient motivation to achieve the objective design requirements rather than threshold requirements,
system redesign may be the desired course of action.
The information obtained from the risk-adjusted system utility can now be used as an informative
tool during system design to help ensure that stakeholder requirements are met based on the outcome
of the utility function. It may be found that the risk-adjusted system utility is still within objective and
threshold values. However, it may also be found that a design iteration should occur to help correct
any potential shortcomings that could impact reliability of the system. We note that system redesign
need not only include physical alteration of the system. Several other options, which may be more
practical depending the system’s location in the SE process, do not address the issues from a reliability
perspective but instead approach the problem from a maintainability or supportability perspective.
For example, efforts could be made to utilize specialized training to reduce the system’s mean time to
repair. Additionally, efforts to reduce administrative or logistics delays may prove of use in boosting
the system’s operational availability levels; however, if any combination of these methods proves
insufficient, it may be necessary to address the problem by addressing the risk attitudes of the SOM.
While we can provide (and have provided above) suggestions at where to look to fix low risk-adjusted
system utility values during a redesign of a system, individual systems, the organizations the systems
belong to, and the practitioners involved all play a significant role in determining the best course of
action for each situation.
3.5. Step 4: Adjust System Attributes
If the practitioner decides to redesign the system, they will choose new system components
and/or alter component configuration. As mentioned in the previous section, design may be an
iterative process. Notionally, based on the utility function, it is possible to determine the necessary
system reliability for a given utility and SOM risk attitude; but we re-emphasize that although this
process attempts to quantify otherwise qualitative data, the complex and interdependent nature of the
many factors contributing to a system’s operational availability limit implementation of this model in
an exclusively quantitative manner. Rather, the proposed method is designed to be used as a reference
tool to aid in the process of system design. After the new system has been designed, a practitioner will
determine the revised system reliability and obtain a new system utility from the utility function. If the
outcome is still unsatisfactory, the process with continue to iterate. This iteration process is essentially
a repetition of steps 4 and 5 until attainment of a satisfactory outcome.
When the practitioner is satisfied that the system has been adjusted to meet the risk attitude of
the SOMs and achieve the desired operational availability via system redesign, then the practitioner
can cease using the method. However, it may be useful to periodically re-check assumptions made
throughout the method and re-evaluate the system throughout the system’s life-cycle. We have
anecdotally observed in our professional practice that risk attitudes of SOMs can change over time as
new generations of SOMs come aboard.
4. Example Implementation
This section provides an example scenario demonstrating how the proposed method can be
applied by systems engineering practitioners concerned with improving the operational availability
of their systems from the perspective of risk attitudes of SOMs. The example is applied to a generic
system broadly representative of a system which may be found aboard Naval vessels and shows the
implementation of the proposed method outlined in Section 3. While this case study focuses on a
Naval vessel system, the proposed method remains relevant to other enterprises.
A systems engineer has been assigned to a project team developing a system to support various
maritime operations with operating periods of 500 h. Over these time periods, the system must
maintain high levels of operational availability. To support these requirements, the systems engineer
has determined the system requires a threshold reliability level of at least 90%.Systems 2020, 8, 26 15 of 22
4.1. Pre-Step: Identify System Attributes that Impact Operational Availability
Reliability is chosen as the system attribute to focus upon in the context of SOM risk attitude
impact upon operational availability.
The system of interest is a four-component system with a series-parallel configuration where one
component is replicated in parallel. The component reliability data for the system are representative of
a system with reasonable reliability levels for maritime environments.
Table 3 shows notional parameters for the system components. The MTBF value accounts for the
inclusion of a preventive maintenance plan. The reliability data are based on the operating period of 500 h.
Table 3. Component Reliability Data For Example Maritime System Over 500 Hour Operating Period.
Component MTBF (Hrs) Failure Rate Reliability
1 14,000 0.000071 0.964916
2 16,500 0.000061 0.970152
3 8000 0.000125 0.939413
4 15,000 0.000067 0.967216
Component three has the highest failure rate which has previously been mitigated component
being configured to have parallel redundancy. The RBD of the system is shown in Figure 3. Standard
reliability calculations are performed based on this data [19].
Figure 3. Example Component Configuration RBD of a Generic Maritime System.
Given the expected reliability of the system, one could expect that given a risk neutral SOM in
full compliance with the maintenance plan, the system should achieve roughly 90% reliability, meeting
the threshold requirement for reliability. However, the systems engineer using the proposed method is
interested in understanding the risk-adjusted utility of the reliability of the system.
4.2. Step 1: Determine Risk Attitudes of SOMs
Step 1.1: Select the Risk Assessment Tool
Following the guidance we gave in Section 3.2.1 about selecting a specific risk assessment tool,
the example uses the DOSPERT test [33] to assess SOM risk attitude. While the DOSPERT test
was developed from a personal, private life risk attitude perspective, these domains are generally
reasonably well-aligned with potential broad domains of risk attitudes of SOMs at their jobs.Systems 2020, 8, 26 16 of 22
4.3. Steps 1.2–1.5: A Summary
For this example, the outputs for sub-steps 1.1 through 1.5 have been summarized in Table 4.
While the proposed method can work for an individual SOM, naval systems such as the maritime
system in the example are almost universally maintained by a pool of SOMs thus it is appropriate to
combine SOM risk attitudes for further analysis. On Naval systems, it is generally the case that the
SOMs are distributed among the divisions, departments, or even the entire crew.
Table 4 shows a notional average risk attitude composition summary for the group of SOMs
working with the system. As shown in Table 4, risk averse risk attitude values have been reassigned a
value of zero to represent the equivalence of risk averse attitudes with risk neutral risk attitudes as
discussed previously. Then a scaling factor of one is implemented for demonstration purposes and ρ is
solved for.
Table 4. Risk Attitude Summary for a Group of SOMs Who Work On the Maritime System.
Risk Domain Raw Risk Attitude Adj Risk Attitude Risk Impact
Ethics 0.8021 0.8021 1.2
Finance −0.7397 0.0000 1.1
Health/Safety 0.8750 0.8750 1.5
Recreation −0.3131 0.0000 0.5
Social 0.5581 0.5581 1.35
Rraw Rtotavg ρ Fs
0.447 0.606 −1.651 1
4.4. Step 2: Develop the Utility Function
The reliability of the maritime system is considered to be monotonically increasing. Equation (10)
is used with the value x being the reliability of the system. Now the systems engineer has all of the
components necessary to calculate the system utility based on the risk attitudes of the SOMs.
Although the SOMs are risk averse in the finance and recreation risk domains of the DOSPERT,
their moderate social risk seeking coupled with significant risk seeking in ethics and health/safety result
in a potentially significant effect on system reliability. The example system has a reliability of 90.2% which
has a risk-attitude-adjusted utility of just over 87% as shown below in Equation (12) and Figure 4.
0.902
e −1.651 − 1
u( x ) = −100 = 87.31%. (12)
e −1.651 − 1
Figure 4. Risk-Adjusted System Utility as a Function of Nominal System Reliability for an Example
Maritime System.You can also read