A Landsat-derived annual inland water clarity dataset of China between 1984 and 2018 - ESSD
←
→
Page content transcription
If your browser does not render page correctly, please read the page content below
Earth Syst. Sci. Data, 14, 79–94, 2022
https://doi.org/10.5194/essd-14-79-2022
© Author(s) 2022. This work is distributed under
the Creative Commons Attribution 4.0 License.

        A Landsat-derived annual inland water clarity dataset of
                    China between 1984 and 2018
             Hui Tao1,2 , Kaishan Song1,3 , Ge Liu1 , Qiang Wang1 , Zhidan Wen1 , Pierre-Andre Jacinthe4 ,
             Xiaofeng Xu1 , Jia Du1 , Yingxin Shang1 , Sijia Li1 , Zongming Wang1 , Lili Lyu1 , Junbin Hou1 ,
                      Xiang Wang1 , Dong Liu5 , Kun Shi5 , Baohua Zhang3 , and Hongtao Duan5
        1 Center
               of Remote Sensing and Geographic Information, Northeast Institute of Geography and Agroecology,
                                Chinese Academy of Sciences, Changchun, 130102, China
                            2 School of Resources and Environment, University of the Chinese

                                      Academy of Sciences, Beijing, 100049, China
                     3 School of Environment and Planning, College of Urban Research and Planning,

                                     Liaocheng University, Liaocheng, 252000, China
                   4 Department of Earth Sciences, Indiana University–Purdue University Indianapolis,

                                              Indianapolis, IN 46202, USA
           5 Key Laboratory of Watershed Geographic Sciences, Nanjing Institute of Geography and Limnology,

                                  Chinese Academy of Sciences, Nanjing, 210008, China
           Correspondence: Kaishan Song (songkaishan@iga.ac.cn) and Hongtao Duan (htduan@niglas.ac.cn)

                                    Received: 2 July 2021 – Discussion started: 22 July 2021
                     Revised: 30 November 2021 – Accepted: 30 November 2021 – Published: 13 January 2022

      Abstract. Water clarity serves as a sensitive tool for understanding the spatial pattern and historical trend in
      lakes’ trophic status. Despite the wide availability of remotely sensed data, this metric has not been fully ex-
      plored for long-term environmental monitoring. To this end, we utilized Landsat top-of-atmosphere reflectance
      products within Google Earth Engine in the period 1984–2018 to retrieve the average Secchi disk depth (SDD)
      for each lake in each year. Three SDD datasets were used for model calibration and validation from different field
      campaigns mainly conducted during 2004–2018. The red / blue band ratio algorithm was applied to map SDD
      for lakes (> 0.01 km2 ) based on the first SDD dataset, where R 2 = 0.79 and relative RMSE (rRMSE) = 61.9 %.
      The other two datasets were used to validate the temporal transferability of the SDD estimation model, which
      confirmed the stable performance of the model. The spatiotemporal dynamics of SDD were analyzed at the five
      lake regions and individual lake scales, and the average, changing trend, lake number and area, and spatial dis-
      tribution of lake SDDs across China were presented. In 2018, we found the number of lakes with SDD < 2 m
      accounted for the largest proportion (80.93 %) of the total lakes, but the total areas of lakes with SDD of < 0.5
      and > 4 m were the largest, both accounting for about 24.00 % of the total lakes. During 1984–2018, lakes in
      the Tibetan–Qinghai Plateau region (TQR) had the clearest water with an average value of 3.32 ± 0.38 m, while
      that in the northeastern region (NLR) exhibited the lowest SDD (mean 0.60 ± 0.09 m). Among the 10 814 lakes
      with SDD results for more than 10 years, 55.42 % and 3.49 % of lakes experienced significant increasing and
      decreasing trends, respectively. At the five lake regions, except for the Inner Mongolia–Xinjiang region (MXR),
      more than half of the total lakes in every other region exhibited significant increasing trends. In the eastern region
      (ELR), NLR and Yungui Plateau region (YGR), almost more than 50 % of the lakes that displayed increase or
      decrease in SDD were mainly distributed in the area range of 0.01–1 km2 , whereas those in the TQR and MXR
      were primarily concentrated in large lakes (> 10 km2 ). Spatially, lakes located in the plateau regions generally
      exhibited higher SDD than those situated in the flat plain regions. The dataset is freely available at the National
      Tibetan Plateau Data Center (https://doi.org/10.11888/Hydro.tpdc.271571, Tao et al., 2021).

Published by Copernicus Publications.
80                                                                  H. Tao et al.: An annual inland water clarity dataset of China

1    Introduction                                                     methods are difficult to apply to large-scale studies (provin-
                                                                      cial and national scales) due to the complex theoretical mod-
                                                                      els and parameterization processes and expensive equipment
Lakes and reservoirs are important aquatic habitats and               required (Cao et al., 2017; Giardino et al., 2007). The last
serve as freshwater water sources for drinking, indus-                group of methods is widely used to retrieve SDD at multiple
trial and agricultural uses (Pekel et al., 2016; Tranvik et           scales due to its simplicity and operability (Duan et al., 2009;
al., 2009; Wetzel, 2001). More than 26 000 lakes (with area >         L. Feng et al., 2019; McCullough et al., 2012; Olmanson et
0.01 km2 ) and 78 000 reservoirs are distributed across China         al., 2011; Shen et al., 2020).
(Song et al., 2018a), providing multiple ecosystem services              In the past, we faced the challenge of how to handle
(S. L. Feng et al., 2019; Lehner and Doll, 2004; Tranvik et           and analyze big data at national or global scales, like re-
al., 2009; Yang and Lu, 2014). Over the last 4 decades, China         mote sensing datasets from different satellites. Since 2010,
has made considerable achievements with respect to socio-             Google has hosted a big geo-data platform based on cloud
economic development but has also faced increasing water              computing, named Google Earth Engine (GEE), which is
pollution challenges due to, among other contributing fac-            time-saving for users, who can conduct scientific research
tors, agricultural nonpoint pollution, wastewater discharge,          online (into topics such as vegetation, agriculture, hydrol-
urban expansion and increased water consumption (Han et               ogy and land cover) without downloading these satellite
al., 2016; Qin et al., 2010; Tong et al., 2017). Eutrophication       images (Amani et al., 2020). The GEE platform mainly
and algal bloom proliferation are the clearest manifestations         comprises datasets of remote sensing, geophysics and me-
of these water quality problems, and major efforts have been          teorology. The remote sensing datasets contain Landsat
made (afforestation, conversion of cropland to grassland or           (1972–present), Moderate Resolution Imaging Spectrom-
wetland) to mitigate these impacts and restore the ecological         eter (MODIS; 2000–present) and Sentinel (2014–present)
integrity of inland water systems (Huang et al., 2016; Ma et          (https://code.earthengine.google.com/, last access: last ac-
al., 2020; Tong et al., 2020).                                        cess: 5 January 2022). Remote sensing images are selectively
   Across the country, the number of stations dedicated to            used to estimate SDD for specific regions according to their
the monitoring of water quality in lakes (59) and reservoirs          spatial and temporal resolutions, among which the Landsat
(52) is very limited in comparison to the national inventory          images can be used to not only examine the long-term (3–
of lakes and reservoirs (SOEE, 2018). Water resource man-             4 decades) spatiotemporal variation in SDD but also moni-
agers in China clearly need better assessment tools to mon-           tor lakes ranging from small to large with its higher spatial
itor inland water quality (Rosenzweig et al., 2011). Com-             resolution (30 m). Therefore, the GEE platform is an optimal
monly expressed as the Secchi disk depth (SDD) (Carlson,              choice to quickly map SDD long-time-series dynamics based
1977), water clarity provides both a practical and a com-             on Landsat observation across China.
prehensive measure of the trophic state of aquatic ecosys-               In recent years, a few studies have examined the spa-
tems (Olmanson et al., 2008; Richardson et al., 2010). How-           tiotemporal dynamics of SDD in lakes across China, but
ever, traditional SDD measurements are limited in terms of            they have mainly focused on the large lakes and reservoirs
their suitability for monitoring large water bodies exhibiting        (area > 10 km2 ) (D. Liu et al., 2020; S. Wang et al., 2020;
strong spatiotemporal dynamics (Kloiber et al., 2002; Song et         Zhang et al., 2021). Smaller lakes (area < 10 km2 ) are widely
al., 2020). Although a Secchi disk apparatus is easy to oper-         distributed across the country, but our understanding of their
ate in the field, water clarity monitoring in lakes or reservoirs     ecological status remains limited. For example, D. Liu et
(herein lakes) located in remote areas can be nearly impos-           al. (2020) used an empirical model and the MODIS red
sible without aquatic vehicles and may not yield data with            and green bands (2000–2018) within GEE to study SDD
sufficient spatial and temporal frequency for trend analysis          variation in 412 large lakes (area > 20 km2 ) across China.
(Kloiber et al., 2002; Olmanson et al., 2008).                        S. Wang et al. (2020) applied water color parameters (Forel–
   The abundance of optically active constituents (OACs;              Ule index and hue angle) to MODIS data (2000–2017) and
phytoplankton, non-algal particles and CDOM) is related to            obtained SDD data for 153 lakes (> 25 km2 ) across China.
the trophic status of aquatic ecosystems and also contributes         Zhang et al. (2021) built a simple power function model
to water clarity and water surface reflectance, which can be          based on the Landsat red band (2016–2018) to investigate the
captured by spaceborne sensors (Gordon et al., 1983; Lee et           spatial distribution of SDD in 641 lakes (≥ 10 km2 ) across
al., 2015). Remote sensing has been widely used for moni-             China. In addition, other investigations of the spatiotempo-
toring the spatiotemporal dynamics of SDD at regional and             ral variations in SDD have been made using MODIS data for
national scales. Available methods for SDD estimation us-             lakes in the Yangtze Plain (50 lakes, > 10 km2 ; L. Feng et
ing remote sensing data can be grouped into three categories:         al., 2019) and in the Tibetan Plateau (64 lakes, > 50 km2 ; Pi
analytical, semi-analytical and empirical algorithms (Doron           et al., 2020). In these studies, the empirical models exhib-
et al., 2007; Lee et al., 2015; G. Liu et al., 2020; McCul-
lough et al., 2013; Olmanson et al., 2008, 2011). The first two

Earth Syst. Sci. Data, 14, 79–94, 2022                                                   https://doi.org/10.5194/essd-14-79-2022
H. Tao et al.: An annual inland water clarity dataset of China                                                                       81

ited better ability than other models to estimate SDD at large      ary extraction is available in that study. However, some lakes
scales.                                                             in China have changed substantially over time. These lakes
   In this study, we tuned a recently developed SDD em-             were dealt with separately to obtain their boundaries in each
pirical model which has been demonstrated as effective to           year during the period 1984–2018. To obtain the informa-
map the spatial–temporal dynamics of SDD in surface wa-             tion of lake area variation (e.g., size and year), we referred
ters based on atmospherically corrected Landsat reflectance         to an analysis on multi-decadal lake area (≥ 1 km2 in size)
products in GEE (Song et al., 2020). The overall purpose of         changes in China from the 1960s to 2015 (Zhang et al., 2019)
this study was to map the spatiotemporal variation in SDD in        (Fig. S1 in the Supplement). The datasets of lake boundaries
lakes (> 0.01 km2 ) across China from 1984 to 2018. Specif-         (1960s–2020) have been released by the National Tibetan
ically, the objectives were to (1) built a lake SDD estimation      Plateau Data Centre. As for the reservoirs, we mainly viewed
model across China based on extensive in situ measurements,         and compared the Landsat natural color images on the web-
(2) derive SDD of lakes across China using Landsat data em-         site of Earthdata Search (https://search.earthdata.nasa.gov/,
bedded in GEE, and (3) analyze the interannual variability in       last access: 5 January 2022) and historical images embed-
SDD at the lake regions’ scale and the individual lake scale.       ded in Google Earth to confirm the changing region, respec-
Such research provides valuable information regarding wa-           tively. For the small lakes with area < 1 km2 obtained from
ter quality conditions and can inform future water resource         the study of Song et al. (2020), we assumed their boundaries
planning and management.                                            remained unchanged during the study period.
                                                                       We extracted the boundaries of these changing lakes us-
2     Study area                                                    ing Landsat images during 1984–2018. The cloudless top-of-
                                                                    atmosphere (TOA) image of each path and row was down-
China is a vast and physiographically diverse country en-           loaded from the GEE platform and processed to obtain the
dowed with a large number of lakes. Based on broad regional         modified normalized difference water index (MNDWI) as
variations of landforms and climate characteristics, the lakes      follows:
in China have been grouped into five regions (Ma et al., 2011)      MNDWI = Rrc, Green − Rrc, SWIR

                                                                                                          Rrc, Green − Rrc, SWIR ,   (1)
(Fig. 1a). The Inner Mongolia–Xinjiang lake region (MXR)
and Tibetan–Qinghai Plateau lake region (TQR) are located           where Rrc, Green and Rrc, SWIR are the Rayleigh scattering re-
in arid or semiarid climates, while the northeastern lake re-       flectance in the green band and shortwave infrared (SWIR)
gion (NLR), Yungui Plateau lake region (YGR) and eastern            band, respectively. First, we used the MNDWI, combined
lake region (ELR) are situated in the Asian monsoon cli-            with tasseled cap transformation (TC) and a density slic-
mate zone. The MXR and TQR have lower annual precipi-               ing with multi-threshold approach, to build a decision tree
tation, lower temperature and a higher evaporation level than       for extracting water body boundaries using the ENVI soft-
other three lake regions. Regionally, the lakes’ distribution       ware package (Rokni et al., 2014; Xu, 2006). Then, Land-
sourced from Song et al. (2020) is as follows (in decreas-          sat images acquired during 1984–2018 were classified into
ing order): 49 % in the ELR, 22 % in the NLR, 18 % in the           water and non-water areas (Feyisa et al., 2014; X. Wang
YGR, 8 % in the MXR and 4 % in the TQR (Fig. 1b). How-              et al., 2020). The extracted water bodies were subsequently
ever, on the basis of lake surface area, regional distribution is   converted into polygons with contiguous pixels and stored
slightly different and is in the following order: TQR (41 %)        in shape file format using ArcGIS 10.4 (Esri Inc., Redlands,
> ELR (30 %) > MXR (14 %) > NLR (10 %) > ELR (6 %)                  CA, USA). According to the shoreline features, we divided
(Fig. 1b). The lakes in the plateau region with higher eleva-       water bodies into lakes, reservoirs and rivers. By referring to
tion are less affected by human activities and generally ex-        the Global Reservoir and Dam database (Lehner et al., 2011),
hibit better ecological conditions than lakes in the other re-      Chinese Reservoirs and Dams database (Song et al., 2018b),
gions (Zhang et al., 2019). In contrast, the lakes in the plain     and high-resolution images from Google Earth, we distin-
regions are frequently influenced by anthropogenic activities,      guished rivers and reservoirs from water bodies mainly by
such as urbanization, population growth, agricultural fertil-       visual interpretation. The shape file of lakes and reservoirs
izer and wastewater discharge (L. Feng et al., 2019; Tong et        (herein lakes) was used as a water mask to extract the SDD
al., 2020).                                                         map derived from the Landsat imageries (Fig. 1a).
                                                                       The impact of land contamination on water remains a chal-
                                                                    lenge in terms of accurately retrieving water quality param-
3     Methods
                                                                    eters (Jensen, 2006; Hou et al., 2017; D. Liu et al., 2020;
                                                                    S. Wang et al., 2020). Jensen (2006) pointed out that the
3.1    Water body mask
                                                                    different surface objects have different reflectances to the
Following Song et al. (2020), the lake boundaries (lakes            NIR band. For instance, land and vegetation can largely re-
and reservoirs) with area > 0.01 km2 across China were de-          flect the NIR band strongly absorbed by water, especially for
rived from Landsat 8 Operational Land Imager (OLI) images           shallow lakes or reservoirs. In our study, a 1-pixel (2-pixel)
mainly acquired in 2016, and detailed description of bound-         buffer inward of water boundary was removed for lakes with

https://doi.org/10.5194/essd-14-79-2022                                                 Earth Syst. Sci. Data, 14, 79–94, 2022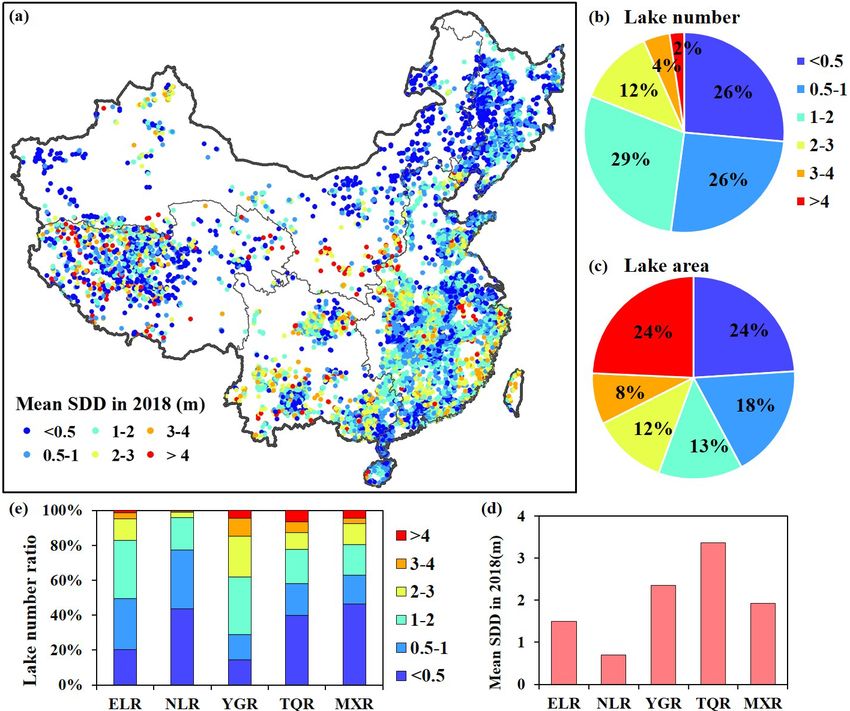
82                                                                      H. Tao et al.: An annual inland water clarity dataset of China

Figure 1. The geographical distribution of lakes with water clarity (SDD) records of more than 10 years (lake area > 0.01 km2 ; N = 11 336)
in different lake regions across China (a). The percentage distribution of lakes, based on the number of lakes and lake surface area in the five
lake regions, is shown in the pie charts. The left one (green box) is based on all lakes extracted from Landsat images (b), while the lower left
corner one (red box) is based on lakes with SDD records of more than 10 years (c).

an area ≤ 1 km2 (> 1 km2 ) in order to avoid the influence                be seen under water. For the first two datasets, SDD data
of adjacent land on water bodies that can result in mixed                 derived from field surveys (2004–2018) were matched with
land–water pixels. The determination of the number of pixels              the TOA reflectance data collected by Landsat satellites over-
buffered was referenced to the method proposed in the study               passing a lake/reservoir within 7 d of a field site visit, and the
of Wang et al. (2018), who made a comparison of water-                    average reflectance of pixels within a 3 × 3 window match-
leaving reflectance in the transects selected from the land–              ing a sampling point was extracted for bands 1–5 (Kloiber
water boundaries to identify a suitable buffer distance. This             et al., 2002). After matching the in situ SDD with images,
method has been demonstrated to be effective in other stud-               altogether, 1301 and 340 pairs of data were obtained based
ies related to SDD estimation (D. Liu et al., 2020; S. Wang               on the first and second SDD datasets, respectively. For the
et al., 2020).                                                            third dataset, the cloud-free TOA images whose dates were
                                                                          closest to the time recorded on the lake survey reports were
                                                                          selected to match the measured SDD, which were between
3.2   SDD in situ data collection across China
                                                                          May and October during the period of field survey. Finally,
We used three SDD datasets for model calibration and valida-              229 matchups were found by expanding the time window be-
tion (Fig. 2a). To assemble the first dataset (IGA-04-19), we             tween the third dataset of SDD and images.
conducted 37 field campaigns from April 2004 to Septem-
ber 2018; surveyed 361 water bodies; and collected 2293                   3.3    Acquisition and processing of Landsat imagery data
samples from lakes and reservoirs across China (Table S1 in
the Supplement), most of which were collected in late sum-                To track the dynamics of lake SDD in the past 35 years,
mer and early autumn. The second dataset was assembled                    all available Landsat Thematic Mapper (TM)/Enhanced The-
from field campaigns (2007–2009) conducted by researchers                 matic Mapper Plus (ETM+)/OLI images of TOA across
from the Nanjing Institute of Geography and Limnology,                    China were used in this study (∼ 82 000 images, > 60 TB
Chinese Academy of Sciences. The third dataset (229 sam-                  of data) via the GEE platform. The number of images used
ples) was collected by different research groups during the               for the SDD estimate in a specific year spanned a large range,
1980s–1990s and included records for which the data collec-               from 371 in 1984 to 4784 in 2018 (Fig. 2b), with more im-
tion date was not available. The spatial distribution of these            ages available when two satellites operated simultaneously in
three groups samples is shown in Fig. 2a. At each station,                space to acquire Landsat imagery. In this study, based on the
Secchi disk depth (SDD, in cm) was determined to repre-                   GEE platform, the TOA images were mainly collected dur-
sent water clarity and was taken as the depth from the wa-                ing the ice-free season (May to October) from 1984 to 2018
ter surface where a black–white Secchi disk can no longer                 in the TQR, MXR, NLR and ELR but not in the YGR (from

Earth Syst. Sci. Data, 14, 79–94, 2022                                                         https://doi.org/10.5194/essd-14-79-2022
H. Tao et al.: An annual inland water clarity dataset of China                                                                   83

Figure 2. Location of the sampled water bodies (lakes or reservoirs) and Landsat Worldwide Reference System 2 (WRS-2) path/row based
on © Google Earth images across China (a). Number of Landsat scenes used in ice-free season from 1984 to 2018 (b).

January to December) due to lack of good-quality images.            ity inversion (Wang et al., 2009), particularly for monitor-
The pixel_qa band, as a pixel quality control band generated        ing of temporal variation at a large scale. The TOA products
from the CFMask algorithm, was selected to mask out the             within GEE were produced using the equations developed
land and snow/ice and to remove cloud contamination (cloud          by Chander et al. (2009), and the function of these equations
cover > 60 %) on the GEE platform, thus minimizing the po-          was to convert calibrated digital numbers to absolute units
tential impact of cloud on SDD estimation accuracy. Landsat         of TOA reflectance. A description of Landsat TOA products
imagery atmospheric correction is a key step for water qual-        is available on the GEE platform (https://developers.google.

https://doi.org/10.5194/essd-14-79-2022                                                  Earth Syst. Sci. Data, 14, 79–94, 2022
84 H. Tao et al.: An annual inland water clarity dataset of China
com/earth-engine/datasets/catalog/landsat, last access: 5 Jan- observation period (1984–2018). For each lake region and
uary 2022). More than 98.35 % of the pixels within China individual lake, the spatiotemporal dynamics in SDD were
had a total of qualified observations > 35 in the past 35 years, analyzed, including the variations in the average, changing
and the majority of images had more than three scenes of trend, number of lakes and lake surface area. The interannual
good observations for each year. changing trend was assessed at the 5 % significance level
and the slope from linear regression analysis between SDD
3.4 Model for SDD estimation and mapping in GEE values and years. These analyses were conducted with the
IBM SPSS software. Based on the analysis of interannual
Model development was a key step in this study. For the change trend in SDD, the lakes in China were divided into
first matchup dataset, i.e., 1301 pairs of in situ SDD and three types – lakes with SDD showing significant increas-
TOA, we divided the valid data into four groups, with three ing (Type I, p < 0.05 and slope > 0), significant decreas-
groups used to calibrate the model (N = 976) and one group ing (Type II, p < 0.05 and slope < 0) and non-significant
(N = 325) used for model validation. Based on a previous in- (Type III, p > 0.05) trends from 1984–2018.
vestigation, the red and blue (or green) band ratio was found
to improve the performance of reflectance-based water qual-
ity models in terms of both their spatial and their temporal 4 Validation of SDD estimation model
transferability (Kloiber et al., 2002; Olmanson et al., 2008;
Song et al., 2020). Thus, by trying the band combination, the The estimation model of lake SDD across China was built
red / blue band ratio algorithm using the first matched dataset using three-quarters of the first matched dataset (976 sam-
was employed in this study to map SDD of water bodies and ples), for which the R 2 , RMSE, rRMSE and MAE were
was mathematically expressed as 0.79, 100.3 cm, 61.9 % and 57.7 cm, respectively (Fig. 3a).
Then, we used 325 samples (one-quarter of the first matched
Ln(SDD) = −5.6828 × (Red / Blue) + 7.8413. (2) dataset) to validate the model, and the validation results in-
dicated stable performance by showing comparative errors
Then, combining the aforementioned image-processing (R 2 = 0.80; RMSE = 92.7 cm; rRMSE = 57.6 %; MAE =
methods, Eq. (1) was applied to the TOA images from 1984 54.9 cm; Fig. 3b). Further, the second and the third datasets
to 2018 to estimate the SDD in the lakes with an area > were both used to validate model performance with a ma-
0.01 km2 over China via the GEE platform. The annual mean jor focus on testing the temporal transferability of the
SDDs at the pixel scale were obtained by averaging all avail- model (Fig. 3c, d). The second dataset (340 samples), col-
able estimated results, and then the lake-based annual mean lected as part of the Chinese lakes survey conducted by
SDDs were further worked out. During the calculations, we the Nanjing Institute of Geography and Limnology, also in-
only took into consideration lakes with SDD results of more dicated a good model performance (R 2 = 0.78; RMSE =
than 10 years. Finally, 10 814 lakes (size > 0.01 km2 ) were 74.7 cm; rRMSE = 59.1 %; MAE = 42.6 cm; Fig. 3c). The
examined for the interannual dynamics of SDD (Fig. 1c). third dataset (229 samples) was assembled by the first lake
surveys conducted in the 1980s and was used to validate
3.5 Statistical analysis the model performance for SDD derived from historical re-
motely sensed data. Our results also demonstrated a sta-
The SDD estimation model performance was assessed using ble performance for lake SDD before the 1990s (R 2 =
the determination coefficient (R 2 ), RMSE, relative RMSE 0.81; RMSE = 61.8 cm; rRMSE = 50.6 %; MAE = 40.3 cm;
(rRMSE) and mean absolute error (MAE). Fig. 3d). Comparison of validation results for these differ-
s
PN 2 ent periods and datasets demonstrated the stable performance
i=1 Yestimated, i − Yobserved, i of the SDD model (Fig. 3). Therefore, the estimation of
RMSE = , (3) SDD using images acquired by Landsat series of sensors pro-
N
RMSE vides a reliable method to examine historical trends in SDD
rRMSE = 100 × , (4) through time series analysis.
Yobserved, i
PN
Yestimated, i − Yobserved, i
MAE = i=1 , (5) 5 Spatial distribution of SDD in lakes in 2018
N
where N refers to the number of water samples, i refers to the Figure 4a shows the spatial distribution of the annual mean
current water sample number, Yobserved, i refers to the in situ SDD of lakes across China in 2018, demonstrating remark-
SDD measurements, Yobserved, i refers to the average of ob- able spatial variation, with lakes in the plateau regions gen-
served Y and Yestimated, i refers to the estimated SDD from erally exhibiting higher SDD than those situated in the flat
the Landsat data. plain regions. Based on their mean SDD, all lakes across
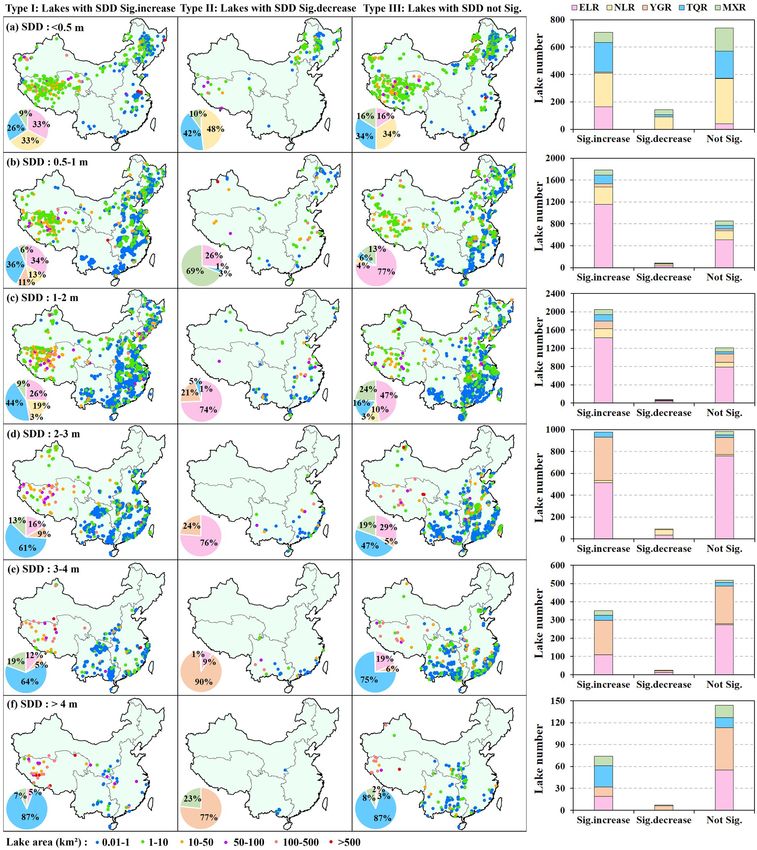
Once the annual mean SDD maps were generated, the av- China in 2018 were divided into six levels, i.e., < 0.5, 0.5–
erage SDD for each pixel within a lake was calculated for the 1, 1–2, 2–3, 3–4 and > 4 m, with 26.4 %, 25.7 %, 28.8 %,
Earth Syst. Sci. Data, 14, 79–94, 2022 https://doi.org/10.5194/essd-14-79-2022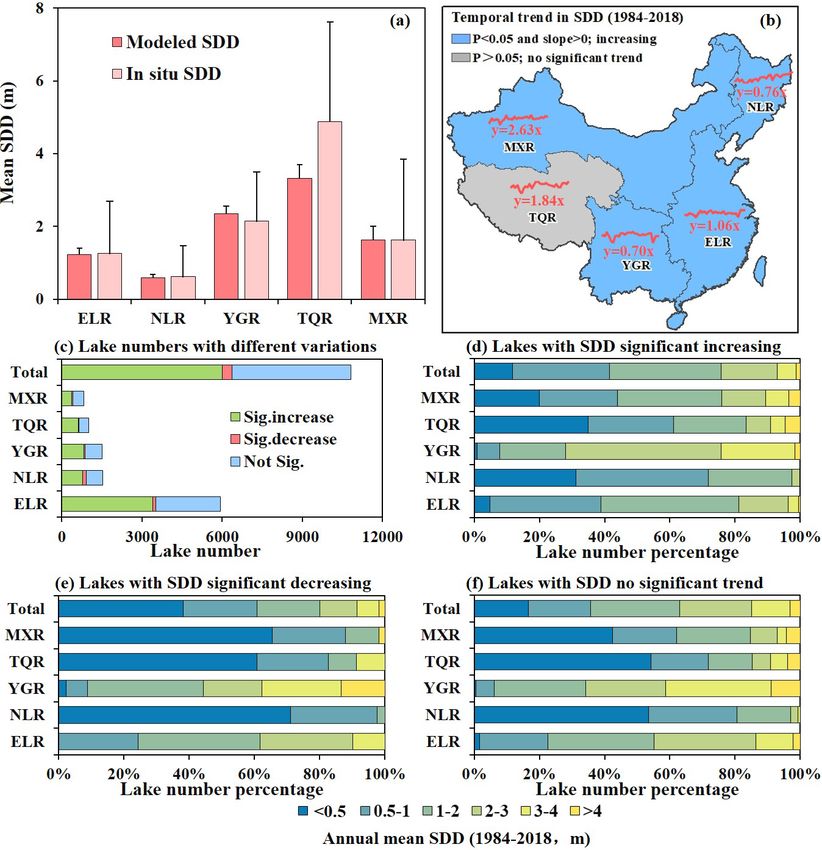
H. Tao et al.: An annual inland water clarity dataset of China                                                                         85

Figure 3. Model calibration and validation for SDD estimation with the Landsat TOA reflectance product acquired by different Landsat
sensors: (a) model calibration with three-quarters of the total number of samples from the first dataset, (b) model validated with one-
quarter of the total number of samples from the first dataset, (c) model validated with the second dataset independently collected during
the limnological survey (2007–2009) and (d) model validated with the third dataset collected in the first lake environmental survey during
1985–1990.

12.5 %, 4.3 % and 2.3 % of lakes in each SDD level, respec-            province and most of Yunnan and Guangxi provinces). A
tively (Fig. 4b). Although the number of lakes with SDD <              large number of lakes were inventoried in the TQR, including
2 m was more numerous (80.9 % of lakes), the total area of             a collection of large lakes situated in the mid-west and east-
lakes with SDD of < 0.5 and > 4 m was the largest, account-            ern sections of the region, particularly in northwest Tibet and
ing for 24 % and 24.3 % of the total area in each category,            in the western and eastern sections of Qinghai province. In
respectively (Fig. 4c).                                                the MXR, the lakes were mainly distributed in the mid-east
   Regarding the annual mean SDD in the five lake regions,             and mid-west of Inner Mongolia and parts of the western and
the top three regions were the TQR (3.37 m), YGR (2.35 m)              northern Xinjiang Uygur Autonomous Region.
and MXR (1.92 m), followed by the ELR (1.50 m) and NLR
(0.69 m) (Fig. 4d). Except for the YGR, lakes with SDD <
                                                                       6     Interannual dynamics of lake SDD during
2 m were most common, accounting for 96 % (NLR), 82.8 %
                                                                             1984–2018
(ELR), 80.5 % (MXR) and 77.6 % (TQR) of all lakes in the
other regions, respectively (Fig. 4e). In the YGR, the lakes
                                                                       6.1    Temporal average and trend in lake SDD
with SDD in the 1–3 m range had a wide distribution, and
the total proportion of lakes with SDD < 3 m was 85.4 % in             Similarly to the spatial pattern of SDD estimates obtained
this region (Fig. 4e). Spatially, the lakes were widely scat-          in 2018, the multi-year average SDD values in each lake re-
tered over the ELR, except for the northern and western sec-           gion also revealed similar trends; i.e., the lakes located in
tions of that region (i.e., northern and southern of Hebei             the plateau region were more transparent than lakes from
province, northeast of Henan province, northwest of Shan-              other physiographic regions (Fig. 5a). During 1984–2018,
dong province, and west of Hubei and Hunan provinces). The             the lakes in the NLR exhibited the lowest SDD (mean
lakes in the NLR were located in the northwest and southwest           0.60 ± 0.09 m), followed by the ELR (mean 1.23 ± 0.17 m).
of the region. In the YGR, the lakes were clustered in the             The MXR showed intermediate SDD values (mean 1.63 ±
southern and northeast of the region (i.e., mid-east of Sichuan        0.38 m), and the YGR exhibited higher SDD (mean 2.35 ±

https://doi.org/10.5194/essd-14-79-2022                                                      Earth Syst. Sci. Data, 14, 79–94, 2022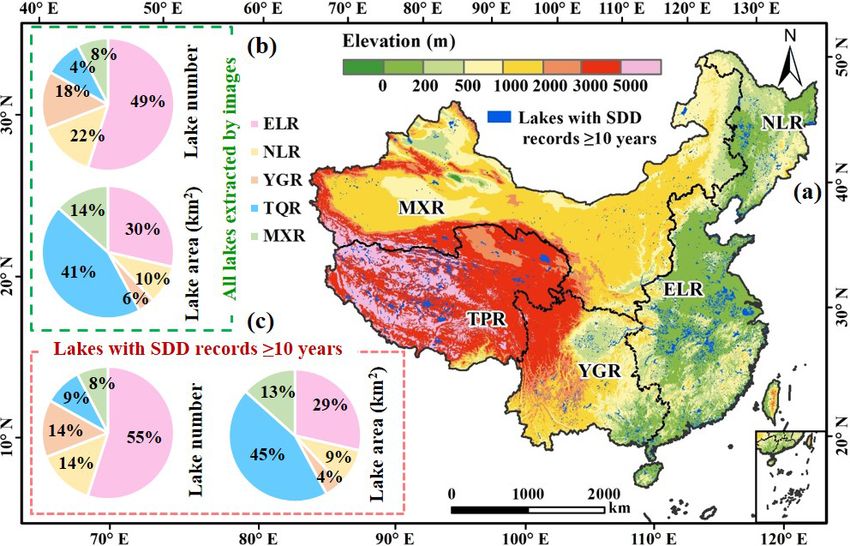
86                                                                    H. Tao et al.: An annual inland water clarity dataset of China

Figure 4. Annual mean SDD of lakes (> 0.01 km2 ) across China in 2018. (a) Spatial distribution of lakes with SDD values. (b) Proportion
of the lake number with SDD values for six levels (i.e., < 0.5, 0.5–1, 1–2, 2–3, 3–4 and > 4 m). (c) Proportion of the lake area for six SDD
levels. (d) Annual mean SDDs in the five lake regions. (e) Proportion of the lake number at different SDD levels in the five lake regions.

0.21 m). Lakes in the TQP had the clearest water (mean SDD              2018, the lake SDDs in Type I, Type II and Type III were
3.32 ± 0.38 m; Fig. 5a). As shown in Fig. 5a, mean annual               mainly concentrated in 0.5–3, 0–2 and 0–3 m, respectively;
SDD estimates in the five lake regions were in agreement                the corresponding proportions were 81.11 % (4861 out of
with in situ-measured SDD.                                              5993), 80.11 % (302 out of 377) and 85.13 % (3783 out of
   Regarding the interannual change trend, with the excep-              4444) of the total number of lakes, respectively (Fig. 5d–f).
tion of the TQR, results for the other four lake regions indi-          At the five lake regions’ scale, regardless of the lake type,
cated a significant (p < 0.05) increasing trend in SDD during           the distributions of lake SDDs in the NLR, TQR and MXR
the study period (Fig. 5b). At the scale of individual lakes,           appeared similar, while those in the ELR and YGR differed
55.4 % (5993 out of 10 814) and 3.5 % (377 out of 10 814) of            from these three lake regions. The former group was mainly
lakes experienced statistically significant (p < 0.05) increas-         distributed in 0–2 m; the latter ranged 0.5–3 m (ELR) and 1–
ing and decreasing trends, respectively, and the remaining              4 m (YGR), respectively (Fig. 5d–f).
lakes (41.1 %, 4444 out of 10 814) displayed no significant
change (Fig. 5c). Among the five lake regions, except for
the MXR, more than half of all lakes exhibited significant              6.2    Lake SDDs versus lake sizes in China
increasing trends (Fig. 5c). Ranked by the total number of
                                                                        The annual mean SDD and lake area were both separated into
lakes exhibiting a significant increase in SDD, the lake re-
                                                                        six levels, and the proportions of lakes with different areas in
gions can be ordered as follows: TQR (61.7 %, 618 out of
                                                                        each SDD category are shown in Fig. 6. In terms of the num-
1002), ELR (57.1 %, 3396 out of 5943), YGR (54.6 %, 829
                                                                        ber of different lake areas in the five lake regions, the lakes
out of 1517) and NLR (51.3 %, 784 out of 1528). As for the
                                                                        with annual mean SDD values in the ELR, NLR and YGR
lakes with decreasing SDD values, the NLR had the highest
                                                                        were dominated by the area range of 0.01–1 km2 , followed
number of such lakes (8.4 %, 128 out of 1528) followed by
                                                                        by that of 1–10 km2 . In the MXR, the lakes were mainly
the MXR (7 %, 58 out of 824) (Fig. 5c).
                                                                        dominated by the area range of 1–10 km2 , followed by that
   Among the three types of lake – lakes with SDD show-
                                                                        of 0.01–1 km2 (Fig. 6a–f). In the TQR, when the SDDs were
ing significant increasing (Type I), significant decreasing
                                                                        < 2 m, the lakes covering the area range of 1–10 km2 were
(Type II) and non-significant (Type III) trends from 1984 to
                                                                        in the majority (Fig. 6a–c); when the SDDs were > 2 m, the

Earth Syst. Sci. Data, 14, 79–94, 2022                                                       https://doi.org/10.5194/essd-14-79-2022
H. Tao et al.: An annual inland water clarity dataset of China 87 Figure 5. The interannual dynamics of lake SDDs in China during 1984–2018. (a) Multi-year average SDD values of the modeled and in situ SDDs in the five lake regions. (b) Interannual trends of mean lake SDDs in five lake regions based on the 5 % significant level and slope representing the coefficient of simple linear regression. (c) Number of lakes with SDD showing statistically significant (p < 0.05) increasing (Type I) and decreasing (Type II) trends and non-significant (Type III) trends. Proportions of lake numbers with different SDD values (< 0.5, 0.5–1, 1–2, 2–3, 3–4 and > 4 m) for (d) lakes with SDD showing significant increasing trend, (e) lakes with SDD showing significant decreasing trend and (f) lakes with SDD showing no significant trend. lakes with the area range > 10 km2 occupied a dominant po- the area range of 1–10 km2 across the three types of lake was sition, especially for lakes with the area range of 10–50 and much larger than that of other sizes among the lakes with 100–500 km2 (Fig. 6d–f). SDDs in the range 0–3 m (Fig. 6a–d). When the lake SDDs Among the three types of lake in each SDD category, there were > 3 m in this lake region, most of the three types of is a similarity in the distribution of lakes with different sizes lake were dominated by the lakes covering the area range of between Type I and Type III, while that of Type II was dif- 0.01–1 km2 , apart from the lakes of Type III with SDD val- ferentiated from these two types of lake (Fig. 6). In the ELR, ues > 4 m, where the proportion of lakes with the area range NLR and YGR, more than 50 % of the lakes ranged 0.01– of 1–10 km2 was slightly higher than that with the area range 1 km2 among the lakes of Type I and Type III. The lakes of of 0.01–1 km2 (Fig. 6e–f). Type II, located in the three lake regions and with SDD val- The distribution of the three types of lake with different ues of 0.5–1 m in the ELR and of < 0.5 and 2–3 m in the lake sizes in the TQR differed from those in the other four NLR, were dominated by the area size of 1–10 km2 , while lake regions. For the lakes of Type I and Type III in the TQR, the remaining lakes were mostly with the area range of 0.01– when the SDDs ranged 0–2 m, the proportions of lakes cover- 1 km2 (Fig. 6a–f). In the MXR, the number of lakes covering ing the area range of 1–10 km2 were the largest, somewhere https://doi.org/10.5194/essd-14-79-2022 Earth Syst. Sci. Data, 14, 79–94, 2022
88                                                                    H. Tao et al.: An annual inland water clarity dataset of China

Figure 6. Proportions of lake numbers in different areas in the six SDD categories. The six SDD categories are (a) < 0.5 m, (b) 0.5–1 m,
(c) 1–2 m, (d) 2–3 m, (e) 3–4 m and (f) > 4 m. The SDD values are the average of estimated results in each lake during 1984–2018. In the five
lake regions, the lakes are further divided into three types – lakes with SDD showing significant increasing (Type I), significant decreasing
(Type II) and non-significant (Type III) trends during 1984–2018.

between 49.64 % and 81.12 % (Fig. 6a–c). When the SDDs                   lakes with SDDs in the < 0.5 m category were distributed in
ranged 2–3 m, the lakes with the area range of 10–50 km2 in              the area range of 10–50 km2 , followed by that of 50–100 km2
Type I and of 100–500 km2 in Type III had the largest pro-               (Fig. 6a). When SDDs were in the 0.5–1 m category, the
portions of numbers, accounting for 40.43 % and 35.00 %,                 numbers of lakes with the area range of 1–10 and 10–50 km2
respectively (Fig. 6d). When the SDDs exceeded 3 m, the                  were the largest, where the corresponding percentages were
lakes covering the area range of 100–500 km2 were dominant               40.00 % (Fig. 6b). When SDDs were in the 1–2 m category,
in the two types of lake, followed by the area range of 10–              there were two kinds of lake whose areas were in the range
50 km2 (Fig. 6e–f). For the lakes of Type II in the TQR, the             of 0.01–1 and 50–100 km2 , and their numbers were the same

Earth Syst. Sci. Data, 14, 79–94, 2022                                                       https://doi.org/10.5194/essd-14-79-2022
H. Tao et al.: An annual inland water clarity dataset of China 89
(Fig. 6c). When SDDs were in the 3–4 m category, only the ELR (Type III, 53.19 %), respectively. The regions that had
lakes with the area range of 1–10 km2 existed (Fig. 6e). the largest lake area were the TQR (Type I, 63.51 %), YGR
(Type II, 90.06 %) and TQR (Type III, 75.22 %), respectively.
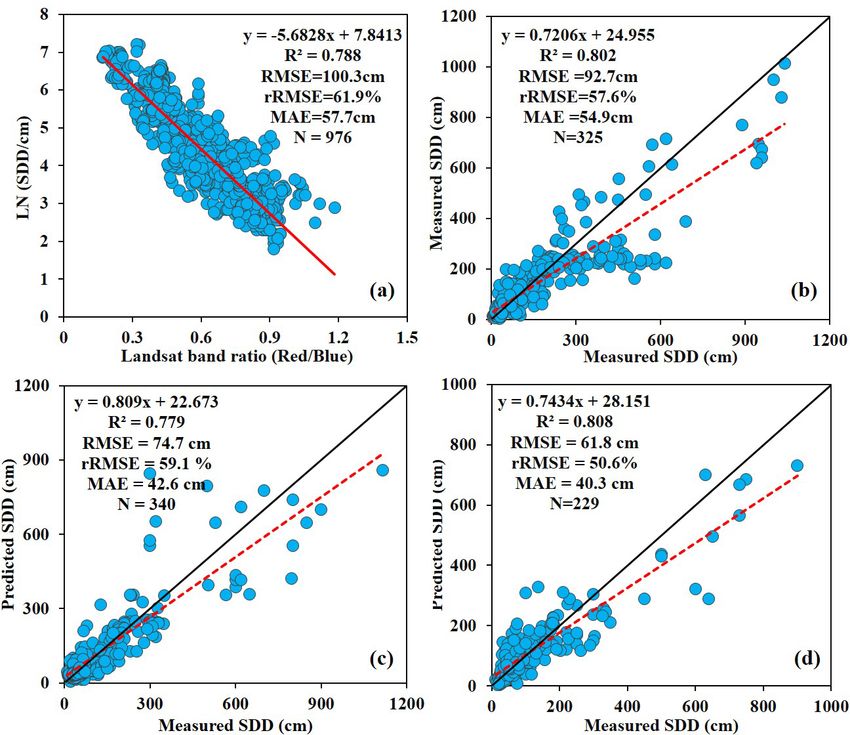
6.3 Spatial distribution of lakes with different SDD
Spatially, the lakes of Types I and III were concentrated at the
values
junction of the ELR, YGR and MXR; the southeast coast of
the ELR; the southern section of the YGR; and the western
The spatial distributions of lakes and the number of lakes and section of the TQR. The lakes of Type III were mainly dis-
areas of the three types of lake in five lake regions are pre- tributed in the part of the southeast coast of the ELR and the
sented in Fig. 7. In the SDD of < 0.5 m category (Fig. 7a), southern section of the YGR.
the NLR had the largest lake numbers and areas of the three Regarding the SDD of > 4 m category (Fig. 7f), the TQR
types of lake, accounting for 34.51 % and 33.20 % in Type I, had the largest lake number and area in the lakes of Type I,
63.19 % and 48.17 % in Type II, and 44.46 % and 34.38 % accounting for 39.19 % of the number of lakes and 87.34 %
in Type III of the number of lakes and areas in the lake re- of the total lake area. For the lakes of Type II, a few lakes
gion, respectively. Spatially, the lakes in Type I and Type III existed in the MXR and YGR. For the lakes of Type III, the
were mainly distributed in the central section of the ELR, YGR had the most lakes and the TQR had the largest total
the western section of the NLR, the mid-west of the TQR lake area, accounting for 40.28 % of the number of lakes and
and the mid-east of the MXR, while those in Type II were 87.00 % of the total lake area, respectively. Spatially, the dis-
concentrated on the western section of the NLR and eastern tributions of these lakes were similar to those of the lakes
section of the MXR. with an SDD range of 3–4 m.
In the SDD of the 0.5–3 m categories (Fig. 7b–d), the lakes
of Types I and III were the most numerous in the ELR, but the
largest total lake areas of the five lake regions were different 7 Comparison with past studies and uncertainties
between these two types of lake. Specifically, in the lakes of
Type I, the total lake areas in the TQR were the largest, with Several past studies have examined the spatiotemporal vari-
percentages of 36.38 % (SDD 0.5–1 m), 44.14 % (SDD 1– ation in SDD in lakes across China (or parts of China), but
2 m) and 61.03 % (SDD 2–3 m), respectively (Fig. 7b–d). Re- these investigations were mainly based on MODIS images
garding the lakes of Type III, the ELR (TQR) had the largest to estimate SDD in large lakes (> 10 km2 ) and primarily fo-
proportion of lake area when SDD was 0.5–2 m (2–3 m). The cused on the period after 2000 (L. Feng et al., 2019; D. Liu
percentages of lake area when SDD was 0.5–2 m in the ELR et al., 2020; Pi et al., 2020; S. Wang et al., 2020). Therefore,
were 76.80 % (SDD 0.5–1 m) and 46.90 % (SDD 1–2 m), it becomes a challenge to compare these past results with
while that in the TQR was 46.65 % (SDD 2–3 m) (Fig. 7b– the results of the present study due to differences in the pe-
d). For the lakes of Type II, the region that had the largest riod of interest, the resolution of the satellite images and lake
proportions of lake number and area was inconsistent in each size (> 0.01 km2 in our study). Zhang et al. (2021) adopted
SDD category (0.5–3) m. When the SDDs were in the range an empirical model to retrieve the SDD of lakes (> 10 km2 )
of 0.5–1 m, the NLR had the largest lake number, while the across China based on Landsat surface reflectance products
MXR had the highest percentage of lake area (Fig. 7b). When (2016–2018) within GEE. Because of the similarity of meth-
the SDDs ranged from 1–2 m, the number of lakes and area ods and images used in Zhang et al. (2021) and the present
in the ELR were the largest (Fig. 7c). When the SDDs were study, there is a unique opportunity to compare lake SDD es-
around 2–3 m, the lake number in the NLR was the largest timation models across China proposed by these two studies.
and the total lake area in the ELR was the largest (Fig. 7d). To that end, we used available in situ SDD data (2019–2020)
Spatially, lake distributions of Types I and III with the SDD collected at monitoring stations in Lake Taihu and Lake Di-
range of 0.5–2 m were concentrated in most places of the anchi to assess the accuracy of the two models. As shown
ELR, the northwest and southeast of the NLR, the southern in Fig. 8 and demonstrated by statistical parameters (higher
section of the YGR, the mid-west of the TQR, and the mid- R 2 , lower RMSE, rRMSE and MAE), the estimation model
east and the northern section of the MXR (Fig. 7b–c). When proposed by our study exhibited better performance to re-
these two types of lake SDD were in the range of 2–3 m, trieve SDD in both Lake Taihu (Fig. 8c) and Lake Dianchi
they were distributed in the central and southeast coast of the (Fig. 8d).
ELR, the central and southwest of the YGR, and the western While previous studies have demonstrated the appli-
section of the TQR (Fig. 7d). For Type II of lakes with SDD cation of Landsat series data (Landsat 5 TM/Landsat 7
falling in the range 0.5–3 m, their distributions were scattered ETM+/Landsat 8 OLI) and the proposed model can pro-
over part of the central and southeast coast of the ELR and vide accurate long-term coverage of the SDD of lakes in
southwest of the YGR (Fig. 7b–d). China (Zhang et al., 2021; Song et al., 2020; Deutsch et
In the SDD of 3–4 m category (Fig. 7e), the regions that al., 2018; Bonansea et al., 2015; McCullough et al., 2013),
had the most lakes for each of the three types of lake were several systemic errors in SDD results could not be avoided.
the YGR (Type I, 53.56 %), ELR (Type II, 48.00 %) and On the one hand, the SDD estimation model proposed in
https://doi.org/10.5194/essd-14-79-2022 Earth Syst. Sci. Data, 14, 79–94, 202290 H. Tao et al.: An annual inland water clarity dataset of China Figure 7. Spatial distribution of lakes with multi-year average SDD values during 1984–2018. The SDD values were divided into six levels: (a) < 0.5 m, (b) 0.5–1 m, (c) 1–2 m, (d) 2–3 m, (e) 3–4 m and (f) > 4 m. The lakes were separated into three types of lake – lakes with SDD showing significant increasing (Type I), significant decreasing (Type II) and non-significant (Type III) trends during 1984–2018. Proportions of total lake area and lake number in each lake region are shown in the pie charts and histograms, respectively. this study contained some errors, and the model validation al., 2016). The calibrated TOA reflectance products within yielded the following results: R 2 = 0.80; RMSE = 92.7 cm; GEE were produced using the equations developed by Chan- rRMSE = 57.6 %; MAE = 54.9 cm. On the other hand, dif- der et al. (2009). Nevertheless, these systemic errors do not ferent atmospheric correction methods can have diverse ef- significantly affect the overall trends of the SDD of lakes in fects on the Landsat images (Bonansea et al., 2015; Lee et China (Bonansea et al., 2015; Deutsch et al., 2018; Zhang et Earth Syst. Sci. Data, 14, 79–94, 2022 https://doi.org/10.5194/essd-14-79-2022
H. Tao et al.: An annual inland water clarity dataset of China                                                                        91

Figure 8. Comparison of different SDD estimation models based on Landsat images within GEE. (a, b) Spatial distribution of monitoring
stations located in Lake Taihu and Lake Dianchi, respectively. The Landsat 8 OLI images used in these two panels come from the Geospatial
Data Cloud site, Computer Network Information Center, Chinese Academy of Sciences (http://www.gscloud.cn, last access: 5 January 2022).
(c–f) The regression line between the measured SDD in Lake Taihu (N = 136) and Lake Dianchi (N = 84) during 2019–2020 and estimated
SDD values that were obtained from the estimation models developed in this study and Zhang et al. (2021), respectively.

al., 2021). In addition, under the influence of climate change         8   Data availability
or human activities, such as floods and droughts, urban-
ization, and farmland reclamation, the boundaries for some             The dataset of the water clarity of lakes developed in
small lakes (< 1 km2 ) may vary greatly, which could cause             this study consists of one shapefile containing the an-
the uncertainty in SDD estimation (Yang and Huang, 2021;               nual mean values of water clarity in each lake (size >
Zhang et al., 2019). This is a limitation of the assumption            0.01 km2 ) during 1990–2018, with a temporal resolu-
for small lakes with static boundaries. In the future, further         tion of 5 years. The dataset can now be accessed
research on the relationship between the area of small lakes           through the website of the National Tibetan Plateau Data
and the accuracy of SDD simulation would aid in addressing             Center (http://data.tpdc.ac.cn/en/, last access: 5 January
this limitation.                                                       2022) at https://doi.org/10.11888/Hydro.tpdc.271571 (Tao et
                                                                       al., 2021).

https://doi.org/10.5194/essd-14-79-2022                                                     Earth Syst. Sci. Data, 14, 79–94, 2022
92 H. Tao et al.: An annual inland water clarity dataset of China
9 Conclusions the interpretation of findings, helped revise the manuscript and ap-
proved the final manuscript for submission.
As a comprehensive indicator of water eutrophication, en-
compassing nutrient enrichment, algal abundance and sus- Competing interests. The contact author has declared that nei-
pended sediment, water clarity can serve as a valuable index ther they nor their co-authors have any competing interests.
for tracking the ecological health of aquatic ecosystems and
guiding the actions of water resource managers. Although
field measurement of water clarity can easily be made with a Disclaimer. Publisher’s note: Copernicus Publications remains
Secchi disk apparatus, this approach is not suitable for long- neutral with regard to jurisdictional claims in published maps and
term time series measurements of lake water clarity at re- institutional affiliations.
gional and national scales. This information is highly valu-
able and can be extracted from archived satellite data. In situ
water clarity data collected in lakes across China during Special issue statement. This article is part of the special issue
2004–2018 were used to calibrate and validate SDD models “Extreme environment datasets for the three poles”. It is not associ-
that incorporate top-of-atmosphere reflectance products and ated with a conference.
Google Earth Engine to map the spatiotemporal dynamics of
SDD over a 35-year time span (1984–2018). The SDD model
was validated using different datasets, and results confirmed Acknowledgements. The authors wish to thank Ying Zhao, Jian-
hang Ma and Ming Wang for their capable assistance in the field
the stable performance and temporal transferability of the
sampling and laboratory measurements.
SDD estimation model. Derived SDD estimates were ana-
lyzed at the lake region and at the individual lake scales. Dur-
ing the study period (1984–2018), annual mean SDD values Financial support. This research was jointly supported by
in the TQR, YGR, MXR, ELR and NLR were 3.32 ± 0.38, the National Natural Science Foundation of China (grant
2.35 ± 0.21, 1.63 ± 0.38, 1.23 ± 0.17 and 0.60 ± 0.09 m, re- nos. 41730104, 42001311, 42171385), China Postdoctoral Sci-
spectively. Among the 10 814 lakes with > 10 years of SDD ence Foundation (grant no. 2020M681056), Strategic Priority Re-
results, 55.4 % and 3.5 % experienced statistically signifi- search Program of the Chinese Academy of Sciences (grant no.
cant (p < 0.05) increasing and decreasing trends of water XDA19070501), Research Instrument and Equipment Develop-
clarity, respectively. The remaining lakes (41.1 %) displayed ment Project of the Chinese Academy of Sciences (grant no.
no significant trends. With the exception of the MXR, more YJKYYQ20190044), and National Earth System Science Data Cen-
than half of lakes in all the other regions exhibited a signifi- ter of China (http://www.geodata.cn/, last access: 5 January 2022).
cant trend of increasing water clarity. In the ELR, NLR and
YGR, most of the lakes displaying either an increase or a de-
crease in SDD tended to be of 0.01–1 km2 in size, whereas Review statement. This paper was edited by Min Feng and re-
viewed by two anonymous referees.
in the TQR and MXR, lakes exhibiting clear trends in SDD
were mostly large lakes (> 10 km2 ). Spatially, the lakes in
the plateau regions (TQR, YGR) generally exhibited higher
SDD than those situated in the flat plain region. The time se- References
ries of water clarity information presented in this study could
aid local, regional and national decision-making on policies Amani, M., Ghorbanian, A., Ahmadi, S. A., Kakooei, M.,
and management for protecting/improving inland water qual- Moghimi, A., Mirmazloumi, S. M., Moghaddam, S. H. A.,
ity in China. The research approach implemented could also Mahdavi, S., Ghahremanloo, M., Parsian, S., Wu, Q., and
potentially be used to map water clarity in lakes at the global Brisco, B.: Google Earth Engine Cloud Computing Plat-
form for Remote Sensing Big Data Applications: A Com-
scale, an effort that could provide useful information for eval-
prehensive Review, IEEE J. Sel. Top. Appl., 13, 5326–5350,
uating decadal trends in surface water quality resulting from https://doi.org/10.1109/jstars.2020.3021052, 2020.
the adoption of pollution control policies. Bonansea, M., Ledesma, C., Rodriguez, C., Pinotti, L., and An-
tunes, M. H.: Effects of atmospheric correction of Landsat im-
agery on lake water clarity assessment, Adv. Space Res., 56,
Supplement. The supplement related to this article is available 2345–2355, https://doi.org/10.1016/j.asr.2015.09.018, 2015.
online at: https://doi.org/10.5194/essd-14-79-2022-supplement. Cao, Z., Duan, H., Feng, L., Ma, R., and Xue, K.: Climate- and
human-induced changes in suspended particulate matter over
Lake Hongze on short and long timescales, Remote Sens. En-
Author contributions. KaS, HT, GL and HD designed the study; viron., 192, 98–113, https://doi.org/10.1016/j.rse.2017.02.007,
KaS, GL and HT performed the research; KaS, HT, GL, QW, ZhW, 2017.
ZoW, DL, KS, BZ and XW collected and analyzed the data; KaS, Carlson, R. E.: A Trophic State Index for Lakes, Limnol. Oceanogr.,
HT, GL, PAJ and HD wrote the paper. All authors contributed to 22, 361–369, https://doi.org/10.4319/lo.1977.22.2.0361, 1977.
Earth Syst. Sci. Data, 14, 79–94, 2022 https://doi.org/10.5194/essd-14-79-2022H. Tao et al.: An annual inland water clarity dataset of China 93 Chander, G., Markham, B. L., and Helder, D. L.: Summary of cur- Lee, Z., Shang, S., Hu, C., Du, K., Weidemann, A., Hou, W., Lin, rent radiometric calibration coefficients for Landsat MSS, TM, J., and Lin, G.: Secchi disk depth: A new theory and mechanis- ETM+, and EO-1 ALI sensors, Remote Sens. Environ., 113, tic model for underwater visibility, Remote Sens. Environ., 169, 893–903, https://doi.org/10.1016/j.rse.2009.01.007, 2009. 139–149, https://doi.org/10.1016/j.rse.2015.08.002, 2015. Deutsch, E. S., Alameddine, I., and El-Fadel, M.: Monitor- Lee, Z., Shang, S. L., Qi, L., Yan, J., and Lin, G.: A ing water quality in a hypereutrophic reservoir using Land- semi-analytical scheme to estimate Secchi-disk depth from sat ETM plus and OLI sensors: how transferable are the wa- Landsat-8 measurements, Remote Sens. Environ., 177, 101–106, ter quality algorithms?, Environ. Monit. Assess., 190, 141, https://doi.org/10.1016/j.rse.2016.02.033, 2016. https://doi.org/10.1007/s10661-018-6506-9, 2018. Lehner, B. and Doll, P.: Development and validation of a global Doron, M., Babin, M., Mangin, A., and Hembise, O.: Estimation of database of lakes, reservoirs and wetlands, J. Hydrol., 296, 1–22, light penetration, and horizontal and vertical visibility in oceanic https://doi.org/10.1016/j.jhydrol.2004.03.028, 2004. and coastal waters from surface reflectance, J. Geophys. Res., Lehner, B., Liermann, C. R., Revenga, C., Voeroesmarty, C., Fekete, 112, C06003, https://doi.org/10.1029/2006jc004007, 2007. B., Crouzet, P., Doell, P., Endejan, M., Frenken, K., Magome, J., Duan, H., Ma, R., Zhang, Y., and Zhang, B.: Remote-sensing assess- Nilsson, C., Robertson, J. C., Roedel, R., Sindorf, N., and Wisser, ment of inland lake water clarity in northeast China, Limnology, D.: High-resolution mapping of the world’s reservoirs and dams 10, 135–141, https://doi.org/10.1007/s10201-009-0263-y, 2009. for sustainable river-flow management, Front. Ecol. Environ., 9, Feng, L., Hou, X. J., and Zheng, Y.: Monitoring and un- 494–502, https://doi.org/10.1890/100125, 2011. derstanding the water transparency changes of fifty large Liu, D., Duan, H., Loiselle, S., Hu, C., Zhang, G., Li, J., Yang, lakes on the Yangtze Plain based on long-term MODIS H., Thompson, J. R., Cao, Z., Shen, M., Ma, R., Zhang, M., observations, Remote Sens. Environ., 221, 675–686, and Han, W.: Observations of water transparency in China’s https://doi.org/10.1016/j.rse.2018.12.007, 2019. lakes from space, Int. J. Appl. Earth Obs. Geoinf., 92, 102187, Feng, S. L., Liu, S. G., Huang, Z. H., Jing, L., Zhao, M. F., Peng, X., https://doi.org/10.1016/j.jag.2020.102187, 2020a. Yan, W. D., Wu, Y. P., Lv, Y. H., Smith, A. R., McDonald, M. A., Liu, G., Li, L., Song, K., Li, Y., Lyu, H., Wen, Z., Fang, Patil, S. D., Sarkissian, A. J., Shi, Z. H., Xia, J., and Ogbodo, U. C., Bi, S., Sun, X., Wang, Z., Cao, Z., Shang, Y., Yu, G., S.: Inland water bodies in China: Features discovered in the long- Zheng, Z., Huang, C., Xu, Y., and Shi, K.: An OLCI-based term satellite data, P. Natl. Acad. Sci. USA, 116, 25491–25496, algorithm for semi-empirically partitioning absorption coeffi- https://doi.org/10.1073/pnas.1910872116, 2019. cient and estimating chlorophyll a concentration in various Feyisa, G. L., Meilby, H., Fensholt, R., and Proud, S. R.: Automated turbid case-2 waters, Remote Sens. Environ., 239, 111648, Water Extraction Index: A new technique for surface water map- https://doi.org/10.1016/j.rse.2020.111648, 2020b. ping using Landsat imagery, Remote Sens. Environ., 140, 23–35, Ma, R., Yang, G., Duan, H., Jiang, J., Wang, S., Feng, X., Li, A., https://doi.org/10.1016/j.rse.2013.08.029, 2014. Kong, F., Xue, B., Wu, J., and Li, S.: China’s lakes at present: Giardino, C., Brando, V. E., Dekker, A. G., Strombeck, N., and Number, area and spatial distribution, Sci. China-Earth Sci., 54, Candiani, G.: Assessment of water quality in Lake Garda 283–289, https://doi.org/10.1007/s11430-010-4052-6, 2011. (Italy) using Hyperion, Remote Sens. Environ., 109, 183–195, Ma, T., Zhao, N., Ni, Y., Yi, J. W., Wilson, J. P., He, L. H., Du, Y. https://doi.org/10.1016/j.rse.2006.12.017, 2007. Y., Pei, T., Zhou, C. H., Song, C., and Cheng, W. M.: China’s Gordon, H. R., Clark, D. K., Brown, J. W., Brown, O. B., Evans, improving inland surface water quality since 2003, Sci. Adv., 6, R. H., and Broenkow, W. W.: Phytoplankton pigment concen- eaau3798, https://doi.org/10.1126/sciadv.aau3798, 2020. trations in the middle Atlantic Bight–comparison of ship de- McCullough, I. M., Loftin, C. S., and Sader, S. A.: Combining lake terminations and CZCS estimates, Appl. Optics, 22, 20–36, and watershed characteristics with Landsat TM data for remote https://doi.org/10.1364/ao.22.000020, 1983. estimation of regional lake clarity, Remote Sens. Environ., 123, Han, D., Currell, M. J., and Cao, G.: Deep challenges for China’s 109–115, https://doi.org/10.1016/j.rse.2012.03.006, 2012. war on water pollution, Environ. Pollut., 218, 1222–1233, McCullough, I. M., Loftin, C. S., and Sader, S. A.: Landsat im- https://doi.org/10.1016/j.envpol.2016.08.078, 2016. agery reveals declining clarity of Maine’s lakes during 1995– Hou, X., Feng, L., Duan, H., Chen, X., Sun, D., and Shi, K.: 2010, Freshw. Sci., 32, 741–752, https://doi.org/10.1899/12- Fifteen-year monitoring of the turbidity dynamics in large 070.1, 2013. lakes and reservoirs in the middle and lower basin of the Olmanson, L. G., Bauer, M. E., and Brezonik, P. L.: A Yangtze River, China, Remote Sens. Environ., 190, 107–121, 20-year Landsat water clarity census of Minnesota’s https://doi.org/10.1016/j.rse.2016.12.006, 2017. 10,000 lakes, Remote Sens. Environ., 112, 4086–4097, Huang, J. C., Gao, J. F., and Zhang, Y. J.: Eutrophication Predic- https://doi.org/10.1016/j.rse.2007.12.013, 2008. tion Using a Markov Chain Model: Application to Lakes in the Olmanson, L. G., Brezonik, P. L., and Bauer, M. E.: Evaluation Yangtze River Basin, China, Environ. Model. Assess., 21, 233– of medium to low resolution satellite imagery for regional lake 246, https://doi.org/10.1007/s10666-015-9472-4, 2016. water quality assessments, Water Resour. Res., 47, W09515, Jensen, J.: Remote Sensing of the Environment: An Earth Re- https://doi.org/10.1029/2011wr011005, 2011. source Perspective, Prentice Hall, Upper Saddle River, New Jer- Pekel, J.-F., Cottam, A., Gorelick, N., and Belward, A. sey, 2006. S.: High-resolution mapping of global surface wa- Kloiber, S. N., Brezonik, P. L., Olmanson, L. G., and Bauer, M. ter and its long-term changes, Nature, 540, 418–422, E.: A procedure for regional lake water clarity assessment using https://doi.org/10.1038/nature20584, 2016. Landsat multispectral data, Remote Sens. Environ., 82, 38–47, Pi, X., Feng, L., Li, W., Zhao, D., Kuang, X., and Li, J.: https://doi.org/10.1016/s0034-4257(02)00022-6, 2002. Water clarity changes in 64 large alpine lakes on the Ti- https://doi.org/10.5194/essd-14-79-2022 Earth Syst. Sci. Data, 14, 79–94, 2022
You can also read