A Dynamic Estimation of Service Level Based on Fuzzy Logic for Robustness in the Internet of Things - MDPI
←
→
Page content transcription
If your browser does not render page correctly, please read the page content below
sensors
Article
A Dynamic Estimation of Service Level Based on
Fuzzy Logic for Robustness in the Internet of Things
Bing Jia 1,2   ID
                    , Lifei Hao 1,2   ID
                                           , Chuxuan Zhang 1,2 and Dong Chen 3,∗
 1   School of Computer Science, Inner Mongolia University, Hohhot 010021, China; jiabing@imu.edu.cn (B.J.);
     31709063@mail.imu.edu.cn (L.H.); 31709075@mail.imu.edu.cn (C.Z.)
 2   Inner Mongolia A.R. Key Laboratory of Wireless Networking and Mobile Computing, Hohhot 010021, China
 3   School of Computing and Information Sciences, Florida International University, 11200 S.W. 8th Street,
     Miami, FL 33199, USA
 *   Correspondence: dchen@fiu.edu

 Received: 18 May 2018; Accepted: 1 July 2018; Published: 7 July 2018

 Abstract: The Internet of things (IoT) technology is developing rapidly, and the IoT services are
 penetrating broadly into every aspect of people’s lives. As the large amount of services grows
 dramatically, how to discover and select the best services dynamically to satisfy the actual needs of
 users in the IoT service set, the elements of which have the same function, is an unavoidable issue.
 Therefore, for the robustness of the IoT system, evaluating the quality level of the IoT service to
 provide a reference for the users choosing the most appropriate service has become a hot topic. Most
 of the current methods just use some static data to evaluate the quality of the service and ignore the
 dynamic changing trend of the service performance. In this paper, an estimation mechanism for the
 quality level of the IoT service based on fuzzy logic is conducted to grade the quality of the service.
 Specifically, the comprehensive factors are taken into account according to the defined level changing
 rules and the effect of the service in the previous execution process, so that it can provide users with
 an effective reference. Experiments are carried out by using a simulated service set. It is shown
 that the proposed algorithm can estimate the quality level of the service more comprehensively and
 reasonably, which is evidently superior to the other two common methods, i.e., the estimating method
 by a Randomization Test (RT) and the estimating method by a Single Test in Steps (STS).

 Keywords: Internet of Things; fuzzy logic; service level; estimation; changing rules

1. Introduction
     The advent of ubiquitous wireless connectivity in conjunction with the ever-increasing
deployment of pervasive computing technologies has changed the landscape of information and
communication technologies. One of the most important examples is the Internet of Things (IoT) [1]
metaphor, which is defined as “a world-wide network of interconnected objects uniquely addressable
based on standard communication protocols”. IoT refers to the integration of large numbers of
real-world objects, that is “things”, in the Internet and aims to simplify high-level interactions of the
physical world to resemble interactions taking place in virtual electronic worlds. Theoretically, IoT can
be applied to all kinds of domains, and IoT has been widely used in many key areas such as business,
healthcare and industry [2], currently. For example, Berkers et al. proposed an ecosystem model
around a smart, horizontal IoT service platform to realize IoT business [3]. Shang et al. discussed the
application of IoT in e-commerce [4].
     The IoT service has made great progress in practical applications, which has greatly facilitated our
production and our life. As a large amount of services grows dramatically, how to discover and select
the best services dynamically to satisfy the actual needs of users in the IoT service set, the elements of

Sensors 2018, 18, 2190; doi:10.3390/s18072190                                      www.mdpi.com/journal/sensors
Sensors 2018, 18, 2190 2 of 13
which have the same function, is an unavoidable issue. Therefore, evaluating the quality level of the
service existing in the IoT to provide a reference for the users choosing the most appropriate service
has become a hot topic in the current academic research. At present, researchers have not yet built a
unified estimating method for the quality level of the IoT service, most of which refer to the evaluation
system of web service, i.e., Quality of Service (QoS), which is the most widely-used non-functional
measurement standard, and Quality of Experience (QoE), which is an evaluation method based on
the degree of user acceptance, including both the subjective and objective aspects. For example, in [5],
a QoS ontology was proposed to describe the contextual features of the IoT services embedded in
physical entities. In [6], a multi-dimensional user requirement QoS model was used to describe service
oriented toward physical objects. In [7], four kinds of QoS calculation models were proposed, which
can be used to decompose and optimize the complex QoS requirements of IoT services. Aazam et al.
devised a QoE-based resource estimation in IoT on the basis of the Relinquish Rate (RR) to enhance
QoS [8]. The method reported in [9] adopted multiple linear regression analysis to evaluate QoE in
IoT. In [10], a framework was given of scalable QoE modeling based on the massive amount of quality
metrics for explosively increasing applications in IoT. Another IoT service measurement approach is to
establish a Service Level Agreement (SLA) or its variant [11–13] between the network service providers
and the users. The SLA is in general a contract that defines some terms such as the type of service,
the quality of service and the payment of the customer, and its application in IoT has just begun, with
many drawbacks, though it had been studied for many years in web service [11]. All these research
works above just use some static data to evaluate the quality of the service and ignore the dynamic
changing trend of the service performance during the testing or executing process. For example, most
evaluation methods based on QoS use the static service parameters to determine the service level,
with the level of services remaining unchanged after evaluations. Most of the methods based on
QoE rely too much on users’ subjective feelings, and the evaluation result is uncertain due to the
differences among each one’s feeling. In addition, the traditional approaches to handle Service Level
Agreements (SLAs) are limited to a predefined service quality provided for a fixed price. Likewise,
SLA provides only a static QoS description, and the modification of the predefined QoS parameter
results in a re-negotiation, usually combined with a service termination, which takes plenty of time
and resources [13]. However, the status, or more precisely, the properties of services change over time
moment by moment, such as the executing efficiency, the reliability, the availability, etc. When service’s
efficiency, reliability or availability decrease or increase, the service level evaluated must reflect the
latest status of services as soon as possible. Dynamic estimation of service level, therefore, is very
necessary, such as considering the latest service execution time to measure the property of its efficiency
and the history of service execution accuracy to measure its reliability by giving different weights to
different periods of time. Combined with these factors, the rangeability of the level estimated can be
influenced appropriately in order to achieve the effect of dynamic evaluation.
On the other hand, IoT services enable the interconnection of a large number of smart devices
(things) using a combination of networks and computing technologies. However, an influx of
interconnected things makes a greater demand on the underlying communication networks and
affects the implementation effect of the service [14]. All of these make the performance of the service
fluctuant, which may lead to a reduced availability of the service selection. Some research works
have been carried out to improve the availability. For example, in [15], a QoS architecture for IoT
that focused on the control-mechanism for transferring and translation of QoS was proposed to
improve the QoS of IoT. In [16], a new and trustable framework for a Mobile Edge Computing (MEC)
management/orchestration system with crucial security and authentication components by which it
ensures the delivery of users’ QoE was given. Furthermore, in [17], a cooperative evolution approach
for service composition under the restrictions of QoS was proposed to address the aim of distinguishing
prospective services out of many “similar” services and identifying needed services with regard to the
criteria of QoS. Because locating and invoking suitable services are quite challenging and traditional
service discovery and selection approaches have been proven inadequate, Karageorgos et al. proposedSensors 2018, 18, 2190 3 of 13
a decentralized service discovery and selection model [18] based on Artificial Potential Fields (APFs),
which are formed on each user service request and become active at points where services can be
provided. However, they did not consider some cases such as multiple variables in generating artificial
potential fields, etc. In practical industrial applications, many scholars also have put forward various
methods to solve the problem of the selection strategy for IoT services. For instance, the authors of [19]
proposed a register service selection-based security architecture to get rid of these problems in oil
production materials, pharmaceuticals and compound process industries. However, their approach
only can be applied to some specific areas, not as a generic method to solve the IoT service selection
problem in all kinds of areas.
Based on the above analysis, we can conclude that one effective way to solve the problem
of IoT service selection in IoT is to grade the services, as well as the similar problem in other
domains [20]. It can achieve the purpose of filtering poor quality services to ensure the quality
of services and developing the optimal selection strategy by evaluating the efficiency, reliability and
other comprehensive indexes of services. Nevertheless, there is no specific method for rating or
estimating IoT services [21] or grading the level of services only by a very simple method such as
the estimating method by a Randomization Test (RT) and the estimating method by a Single Test
in Steps (STS) [22]. Neither of these methods consider the angular and the accidental factors, so
that the resulting service level is not very reasonable, and it is difficult to achieve the purpose of
filtering out bad services and preserving the quality services. For example, Kim et al. have studied the
development and application of a taxonomy for IoT services [23], but they did not propose a specific
level evaluation method.
In this paper, a dynamic evaluation method is presented to estimate the quality level of the IoT
service, which takes into account the comprehensive and changeable factors, and each new evaluation
can achieve a higher level for better service indicators or vice versa, i.e., dynamic. Specifically,
an estimation mechanism for the quality level of the IoT service based on fuzzy logic ([24] also
proved fuzzy theory can be applied to IoT effectively) is used to grade the quality of the service,
which only considers the implementation effect of the service in the previous execution process,
instead of considering what kind of evaluation system is adopted, which ensures the proposed method
as a relatively generic approach. Firstly, a series of level changing rules based on fuzzy logic is defined,
which can be used to calculate the quality level of the service by testing the implementation effect of
the service. Furthermore, the dynamic influence factor for the rangeability of the fuzzy membership
degree is analyzed and formulized. Experiments are carried out by using a simulated service set
and show that the performance of the proposed method can achieve a more stable result and is more
in line with the actual service level in comparison with existing approaches, i.e., RT and STS. To sum
up, our main contribution is that the proposed method, which fully considers the dynamic changing
of the service and intensively takes the uncertainty of QoS into account, i.e., combining the theory of
fuzzy logic, is a relatively better approach in terms of appropriate evaluation of IoT services compared
to the other methods. At the same time, it can be used as a general method, since it does not only limit
the specific IoT sub-domain of the service, but also extracts the more common properties in the IoT
service for dynamic evaluation, so that it can be applied to a specific domain by adding or deleting
some certain attributes.
The rest of the paper is organized as follows. Section 2 discusses the basic theory of fuzzy logic and
proposes the estimation method for IoT service level based on fuzzy logic, as well as gives some cases to
illustrate it. In Section 3, the service execution time and service reliability as the evaluation parameters
are added to the influence factor for the rangeability of the fuzzy membership degree; their definition is
given, and how they change the amplitude of the membership degree is explained. Section 4 establishes
a probabilistic model to express the service passing the test or not and reports the experimental results
and performance analysis in comparison with the existing approaches. Finally, Section 5 concludes our
work and sheds light on future works.Sensors 2018, 18, 2190 4 of 13
2. An Estimation Mechanism for the Quality Level of the Service Level Based on Fuzzy Logic
In 1965, American scholar Zadeh put forward a method to describe fuzzy phenomena in
mathematics: fuzzy sets. The fuzzy set theory holds that the object in the domain of discourse
becomes gradually transitive due to the nature of the collection, rather than having a sudden change.
The appropriate membership function is established, and the fuzzy objects can be analyzed by the
relevant operation and transformation of fuzzy sets [25]. The fuzzy logic extends the binary logic zero
and one to the closed interval [0, 1] for any value in it, and it can be consecutive with an infinite number
of values, which belongs to the interval [0, 1]. In domain of discourse U, there is a given mapping µ:U
→ [0, 1]; this means µ determines a fuzzy set on U, marked as c̃. µ is called the membership function
of c̃’, and this is denoted as µc̃ . It represents the degree to which an object belongs to the fuzzy set [26].
When µc̃ (u) = 1, u completely belongs to the fuzzy set c̃, and u completely does not belong to fuzzy
set c̃ when it is equal to zero.
The service level reflects the comprehensive ability of the service, i.e., the overall service
implementation and the evaluation of the service by the users (or the rating agency). The initialization
of the service level can be evaluated by testing. The precondition of the testing is to have a set of
evaluation samples based on a certain standard, and the evaluation sample is divided into the service
levels. A simpler assessment (i.e., STS) is that if the service passes a test of an evaluation sample of
n, we speak about the service reaching a level of n. This method has great randomness such that the
sample of the same rating may not be able to measure the same angle, i.e., the service could only pass
the evaluation testing on these angles and cannot through testing at other angles. As a result, we need
to do a series of tests to evaluate the level of service. In this paper, a method based on fuzzy logic is
proposed to estimate the service level, and we can find out which level the service is most likely to
reach based on the evaluation test.
For the sake of illustration, this paper divides the service into six levels (of course, it can be
extended to n levels), and we use H to represent it, so H = {1, 2, 3, 4, 5, 6}. The membership degree of
each level is denoted by µk (i), i = 1...6. We use K to represent the fuzzy set of the service level, and K
is expressed as: K = {i | µk (i ), i ∈ H}, where 0 ≤ µk (i ) ≤ 1, Σ6i=1 µk (i ) ≤ 1. For a service resource, the
highest degree of membership is the level of the service resource.
For example, assume the membership of the six levels of a service after testing is
{0.1, 0.4, 0.2, 0.1, 0.4, 0}, so the fuzzy set of the service level can be denoted as K =
{(1, 0.1), (2, 0.4), (3, 0.2), (4, 0.2), (5, 0.1), (6, 0)}. As can be seen from the set K, the membership degree
of Level 2 is the highest, so it can be estimated that the service is most likely to reach Level 2.
Based on the fuzzy logic proposed in [27], the membership grade changing rules of fuzzy set K are
given in Table 1. m is the grade of the evaluation sample; i = 1...6. k is the number of rounds currently
being calculated; and q is defined as the changing factor of the membership degree, which affects the
changing rangeability of the membership degree, i.e., the higher q is, the more the membership degree
µk (i ) of the current level increases and vice versa.
Table 1. Membership grade changing rules.
Condition Rule Type
im µk (i) = µk−1 (i) − µk−1 (i)q + µk−1 (i + 1)q Decrease rule
The rule is defined in the way given below when it is used in practice. When the service passes
the evaluation testing at a certain level, this level and the following level adopt the increase rule, while
the above levels adopt the decrease rule. For cases that do not pass, the membership grade does not
change [27]. For example, as shown in Table 2, the parameter q is set to 0.4 in order to explain the
changing rules of the membership grade in K.Sensors 2018, 18, 2190 5 of 13
Table 2. An example of the membership grade changing rule when q = 0.4.
Initial µ = {1, 0, 0, 0, 0, 0} q = 0.4
1 µ = {0.6, 0.4, 0, 0, 0, 0} Pass Level 2
2 µ = {0.36, 0.64, 0, 0, 0, 0} Pass Level 2
3 µ = {0.216, 0.528, 0.256, 0, 0, 0} Pass Level 3
4 µ = {0.216, 0.528, 0.256, 0, 0, 0} Do not pass Level 3
5 µ = {0.216, 0.528, 0.256, 0, 0, 0} Do not pass Level 3
6 µ = {0.1296, 0.7168, 0.1536, 0, 0, 0} Pass Level 2
From this table, we can doubtlessly deduce that the service should be at the second level. Though
it passed the third test, the fourth test at the same level failed. It is assumed that the last time the
service was tested, it happened to coincide with the evaluation angle of the evaluation sample, which
led to the passing of the test; or in this testing, the evaluation angle of the evaluation sample did not
coincide with the test, so that the test failed. When performing the fifth service test at the same level, it
failed again. It is possible to have a higher probability of not reaching this level, then lowering the level
to continue the test. With this algorithm, some interference information can be excluded (i.e., some
angle, contingency factor, etc.) to make the result more reasonable [27]. The level of the service can be
evaluated by a certain number of tests.
In the same test, the degree of membership change obtained is shown in Table 3, after each stage
when q = 0.6.
Table 3. The example of the membership change rule when q = 0.6.
Initial µ = {1, 0, 0, 0, 0, 0} q = 0.6
1 µ = {0.4, 0.6, 0, 0, 0, 0} Pass Level 2
2 µ = {0.16, 0.84, 0, 0, 0, 0} Pass Level 2
3 µ = {0.064, 0.432, 0.504, 0, 0, 0} Pass Level 3
4 µ = {0.064, 0.432, 0.504, 0, 0, 0} Do not pass Level 3
5 µ = {0.064, 0.432, 0.504, 0, 0, 0} Do not pass Level 3
6 µ = {0.0256, 0.7728, 0.2016, 0, 0, 0} Pass Level 2
At this point, we can find that the membership grade of Service Level 3 is the highest in the third
test. If the test has finished at this time, the level of the service will return to 3. Therefore, the accuracy
of the service level estimation depends on the number of tests and the strategy of testing. In general,
the test at the same level should be repeated several times, especially for the case of failing several
times for a certain level of test, and the level must be reduced to test again. For example, in Table 3, the
test level was reduced to 2 when the forth and fifth test of Level 3 were not passed.
In addition, in the event of two consecutive tests of the service not passing a certain level and still
not passing the test after reducing the level the first time, we will make it equal to the first failure to
try the level. In this case, we can guarantee the same subproblems, so that it is convenient for us to
implement this using the iteration method.
Finally, considering the boundary conditions, the test level is no longer reduced when the test
level is 1, and the results of the fuzzy set are integrated with the other level test for the test at Level 6
due to the two consecutive calculations showing a rising rule.
3. The Influence Factor for the Rangeability of the Fuzzy Membership Degree
Based on the above two examples, we can clearly see that parameter q determines the rangeability
of the membership degree. Decrease rules, for example, ∆ = (µk−1 (i + 1) − µk−1 (i ))q with the variation
of µk (i ). Since the service level is a comprehensive evaluation of the service, parameter q can consider
many changeable factors, such as the speed of the test completed for services, the reliability, satisfaction
and interest of the samples, etc. All of these factors may change over time, and the changed factorsSensors 2018, 18, 2190 6 of 13
(better or worse) will affect the q in turn (higher or lower). Therefore, the next evaluation can produce
a different result, which reflects the dynamic nature of the proposed method. In this paper, we selected
two changeable factors to illustrate, i.e., the execution time of the service test and the reliability of the
sample to illustrate.
First of all, the speed of service execution is compared with the similar services by a regular
execution time and the longest execution time. The service completes the test in a time less than
or equal to the regular execution time, indicating that the service response performance is very
good; the performance of service response is flat when the service execution time is between regular
and maximum time; if it exceeds the maximum time, we think the service response performance is
poor [27]. The service completion test speed factor can be defined as Definition 1 in the form of a
function to express.
Definition 1. Ta is the regular time to complete the evaluation sample test for the service; Tb is the maximum
time to complete the test for the service; ρ is the adjustment coefficient, 0 < ρ < 1. The function F (t) that
denotes the speed of testing a service is defined as follows (for each evaluation sample test, the values of Ta and
Tb can be different):
1
i f t ≤ Ta
F (t) = 1 − ρ × ( Tt−−TTaa ) i f Ta < t < Tb (1)
b
0 i f t ≥ Tb
Secondly, RE is used to represent the reliability of samples, 0 < RE < 1. The larger the value of
RE is, the more reliable the evaluation sample is and the faster the service level needs to change. The
reliability of the evaluation sample reflects the historical accuracy of the sample. According to different
historical stages, we have given different adjusting parameters for the calculation of its accuracy to
reflect the reference value of the accuracy of different historical periods. Generally speaking, the most
recent data are the most valuable, so we can obtain Definition 2 for RE and θ1 < θ2 < θ3 in most cases.
Definition 2. Set up T1 and T2 as two historical moments. T2 is a closer moment to the present. Therefore,
there are three time periods, the time period before T1 , the time period T1 –T2 and the time period T2 to present.
θ1 , θ2 , θ3 have been used as factors to adjust the correct reference weight of the three historical periods. Each of
these three factors is greater than zero and less than one, and θ1 + θ2 + θ3 = 1. RE1 , RE2 and RE3 represent
the accuracy of these three historical periods, so we have:
RE = θ1 × RE1 + θ2 × RE2 + θ3 × RE3 (2)
If we use correct1 , correct2 , correct3 respectively representing the same number of services
evaluated by sample testing and the last evaluation results in three historical periods, test1 , test2 ,
test3 , respectively representing the total number of service tests evaluated by the sample in the three
historical periods, therefore we have:
Correcti
REi = i = 1, 2, 3 (3)
testi
Finally, according to the characteristics of q, set:
q = σ × REc × F (t) (4)
where “c” is a constant, 0 < c < 1. “σ” is an adjustable coefficient to reflect the difference in the
evaluation of different services. F (t) = 1 when the service test execution time is within the normal
range, and q becomes larger as the RE becomes higher. F (t) becomes smaller when the test time goes
beyond the normal range, and q becomes smaller as RE becomes lower. F (t) = 0, and q = 0 when the
test time exceeds the maximum time, indicating the failure of the membership changing rule [27].Sensors 2018, 18, 2190 7 of 13
In particular, this mechanism can be extended to achieve a level of self-renewal in
service-providing applications; because when introducing service level matching in the previous
section, we allowed the service to be run across level calling, which is consistent with the strategy of
the evaluation test. In addition, the parameter q that determines the degree of membership changing
is evolved according to the user’s feedback on the performance of the service such as the user’s
satisfaction degree, interest degree, etc. At this time, the parameter RE can be understood as the
credibility of user evaluation.
4. Experiment
In this section, we will carry out the simulation experiment by programming according to the
above method in order to determine the various parameters in the formulas above and to compare the
the practical effects on evaluating levels, as well as the execution efficiency between our Fuzzy Logic
Estimating Level (FLEL) mechanism and the other two methods on the test service set. The changing
rules for the membership degree adopted are as shown in Table 1.
In Section 4.1, a reasonable range of q values is determined by defining the probability model that
the service actually passes the test and comparing the average service level estimated by the FLEL
mechanism with the increase of the q value. Based on this, the parameters ρ in Formula (1) and σ in
Formula (4) are determined, and a test service set containing 300 simulated services is generated to be
used by the three methods in the following section. Finally, the evaluation processes of the other two
methods that will be compared are described.
In Section 4.2, the actual effects of three methods on estimating the service level are compared
to the average estimation level result and its variance, and the executing efficiency by the average
passing time.
4.1. Setup
4.1.1. Parameters
To simulate the actual probability of service at a certain level, we define the probability model of
a service passing a certain level as Formula (5), where n is the largest level, α is the basis of probability
and β is the factor for the probability decreasing. In this experiment, we take n as 6, α as 0.4 and β as
0.1, which are more consistent with the actual situation of the service passing the tests.
Prob pass = α + (n + 1 − leveltest ) × β (5)
On the basis of this probability model, we test the changing of the estimated level with the
increasing of the q value after the implementation of service level estimation based on fuzzy logic,
where the ordinate numeral denotes the average result of estimating 100 times, as shown in Figure 1.
Figure 1. The changing trend of the average value of the service level estimated with the increasing of
the q value.Sensors 2018, 18, 2190 8 of 13
Through the above figure, we can conclude that the estimated results nearly had no change after
the q value reached around 0.5. At the same time, the estimated level change was relatively flat from a
q value of 0.5–1.0. Therefore, we need to adjust the ρ in Formula (1) and the σ in Formula (4) for the
final calculation of the q value to be distributed more homogeneously between 0.1 and 0.5.
4.1.2. Service Set
In order to test the actual effect of this method, we randomly generated a test set of 300 services
and randomly divided each service into one of four categories, as partly shown in Table 4. The value
range of the current service’s test execution time is [1, 120], and we set Ta as 60 and Tb as 100 according
to Definition 1. The scope of the credibility evaluation sample parameters test1 , test2 , test3 is set to
[1, 100]; the scope of correct1 , correct2 , correct3 is respectively set to [1, test a ] [1, testb ] [1, testc ]; and the
parameters θ1 , theta2 , theta3 are 0.2, 0.3, 0.5 respectively, according to Definition 2. Through many
attempts, the final setting of the value of ρ is 0.8, and σ is set between [0.6, 0.75] based on the service
type so as to reflect the difference in the evaluations of different services.
Table 4. Part of the test service set.
Service No. Type t Test1 Test2 Test3 Correct1 Correct2 Correct3
Service 131 Type 2 75 44 53 72 44 43 46
Service 132 Type 3 116 60 35 63 1 32 44
Service 133 Type 3 46 12 77 2 2 1 2
Service 134 Type 4 58 38 45 54 14 4 6
Service 135 Type 1 35 43 83 6 3 57 2
Service 136 Type 2 50 89 62 75 49 15 1
Service 137 Type 4 81 59 68 16 16 13 12
Service 138 Type 4 21 83 91 54 77 67 36
Service 139 Type 3 104 11 23 43 10 7 22
Service 140 Type 2 23 77 85 37 41 13 14
Combining Formulas (1), (2) and (4), the q value distribution of 300 services is shown in Figure 2
according to the above parameters.
Figure 2. Parameter q distribution of 300 services.
We can arrive at the conclusion that the q value of most services was evenly distributed between
0.1 and 0.5 for all the services that were randomly generated except for the q value of the service
with an execution time exceeding the longest response time (i.e., t > Tb ), which is 0. There are onlySensors 2018, 18, 2190 9 of 13
18 services with a q value of more than 0.5, which means that 94% of the services have a good parameter
for the membership degree changing rangeability.
4.1.3. The Other Two Methods
Estimating method by the Randomization Test (RT): This method finds the highest level ratio
by comparing each level ratio of the evaluated service and regarding it as the final evaluation result.
We use the roulette probability model to simulate the passing probability of the service by this method
due to the difference between this method and our FLEL method on evaluation levels. The probability
model is shown in Figure 3. This method also can be regarded as testing for every level randomly and
takes the maximum passing rate level as the final result after several rounds of testing.
Figure 3. Roulette probability model.
Estimating method by the Single Test in Steps (STS). This method is the same as the FLEL method
for the service level estimation process, but it increases the test level only after a single successful test,
as well as drops the test level only after a single test failure. We adopted the same probability model,
as FLEL passed the service level test for this approach, as shown in Formula (5).
4.2. Results and Analysis
4.2.1. Estimation Result
We compared the proposed FLEL mechanism with the other two methods for the actual estimation
results on the test service set, and the degree and dispersion of the level result estimated by the three
methods can be assessed by the mean value and the variance of the service level obtained by experiment.
We expect to get a more moderate level average (i.e., not too high or not too low), as well a larger
variance to ensure the discrete degree of the estimated results, which will maximize the differences
between services.
Formula (6) defines the mean value of estimating service level L, where Li represents the
estimation level of the i-th service and n represents the total number of services. Formula (7) defines
the variance of estimating service level σL2 , where Li and n are the same as above. Finally, as the total
number of services n increases, the changing of L and σL2 is plotted in Figure 4a,b, respectively.
∑ Li
L= i = 1...n (6)
nSensors 2018, 18, 2190 10 of 13
( L i − L )2
σL2 = i = 1...n (7)
n
It can be seen that RT has a lower estimation result mean value of service level, and STS’s result is
higher, while the result of the FLEL mechanism is relatively moderate, as shown in Figure 4a, which
means FLEL has a better estimation result according to the discussion above.
(a) The mean service level (b) The variance of the service level
Figure 4. The changing of the service level with respect to different amounts of service. RT,
Randomization Test; STS, Single Test in Steps.
Moreover, as can be seen from Figure 4b, FLEL always has the highest variance compared with
the other two methods, so that its estimation results of the service level are more discrete. In another
words, it can fully reflect the differences of quality between each service, which is more convenient for
providing an effective reference to users.
Furthermore, combing the result of the discussion in Section 2, it can also be shown that the FLEL
mechanism can eliminate interference information such as perspective and accidental factors, etc.,
which makes the evaluation better conform to the actual situation of the service, while the other two
methods do not consider these factors.
To sum up, based on the above discussion, the proposed mechanism FLEL shows a better effect
than the other two methods (RT and STS) in estimating the service level.
4.2.2. Efficiency Measure
As stated earlier, the FLEL method’s estimated result of the service level is more accurate and
objective, which depends on its strategy and the number of tests to a certain extent. Therefore, does
that means the FLEL method’s efficiency is low and that it will greatly extend the time consumption of
the evaluation?
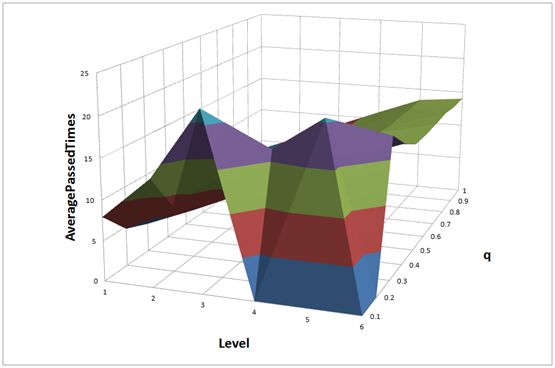
In this section, we compare the efficiency of the three methods by using the Average Passed
Times (APTs).
For RT, APT mainly depends on the number of rounds tested at six levels so that APTRT = 6 × n,
where n is the number of rounds tested, as mentioned in Section 4.1.3.
For the STS, APT is equal to the result level, namely APTSTS = Levelservice , which is a
constant value.
For FLEL, we can only get the APT through the actual test. Accordingly, for each q value from
0.1–1.0, we calculate 1000 times to get the APT of each level, as shown in Figure 5. We can find that
the maximum APT is about 22 when q is 0.1 and the service level is evaluated at Level 3. Besides, in
the sixty ranking results, 91.7% of APTs are less than 15. This can be approximated to APTFLEL ≤ 15,
which is a constant value.Sensors 2018, 18, 2190 11 of 13
Figure 5. The Average Passed Times (APTs) of FLEL.
As a result, APTSTS < APTFLEL < APTRT .
Through the above analysis, the APTs of FLEL and STS are smaller than the APT of RT, meanwhile
the APTs of FLEL and STS are constant in the same order of magnitude. We can obtain that the
efficiency of FLEL is very close to the traditional methods or even higher, and its evaluation is more
stable and more in line with the actual level of service.
5. Conclusions
In the application of IoT services, one effective way to discover the service needed by users and
to develop a service selection strategy is to grade the services. Due to the imperfect evaluation or
estimation methods for services, this paper proposed a dynamic IoT service level estimation method
based on fuzzy logic. On account of fuzzy set theory, this method sets reasonable membership grade
changing rules and takes into account the comprehensive factors, which are both changeable and
generic, such as service execution efficiency and service reliability. In the experimental section, we
determined the various parameters of services according to the distributed range of the q value first
and then generated the service test set, which conformed to the actual situation. By comparison with
two classical estimation methods, the experimental results showed that the FLEL method has a suitable
level result, and it can maximize the quality differences between services when evaluating the level of
service. It was proven that the efficiency of this method is close to the other methods or even higher
through the comparison of APTs. Our future work will include optimizing the membership grade
changing rules by combining with a new theory, further expanding the scale of the experiment to
ensure the stability of this method and applying this method in practice to examine its actual effect,
e.g., adding a lightweight self-renewal module of the service level based on the proposed mechanism
to the actual service in the IoT circumstance, so that the service level can change dynamically through
the service itself instead of through the users, which can address the issue of service selection in a
more efficient way.
Author Contributions: Conceptualization, B.J.; Methodology, B.J.; Software, L.H; Validation, C.Z. and D.C.;
Formal Analysis, L.H.; Investigation, B.J.; Resources, B.J.; Data Curation, L.H.; Writing—Original Draft Preparation,
L.H.; Writing—Review & Editing, B.J., C.Z. and D.C.; Visualization, L.H. and C.Z.; Supervision, B.J.; Project
Administration, B.J.; Funding Acquisition, B.J.
Funding: This research was funded by the National Natural Science Foundation of China, Grant Number 41761086.Sensors 2018, 18, 2190 12 of 13
Conflicts of Interest: The authors declare no conflict of interest.
References
1. Atzori, L.; Iera, A.; Morabito, G. The Internet of Things: A survey. Comput. Netw. 2010, 54, 2787–2805.
[CrossRef]
2. Munteanu, L.; Dumitriu, D.; Chiroiu, V.; Marin, D. On the tactile sensing based on the smart materials.
Comput. Mater. Cont. 2015, 46, 79–103.
3. Berkers, F.; Roelands, M.; Bomhof, F. Constructing a multi-sided business model for a smart horizontal
IoT service platform. In Proceedings of the 2013 17th International Conference on Intelligence in Next
Generation Networks (ICIN), Venice, Italy, 15–16 October 2013.
4. Shang, X.; Zhang, R.; Chen, Y. Internet of Things IoT Service Architecture and its Application in E-Commerce.
J. Electr. Commer. Organ. 2012, 10, 44–55. [CrossRef]
5. Li, L.; Liu, N.; Li, G. Method to QoS-based dynamic service composition in semantic Web of Things.
Appl. Res. Comput. 2016, 33, 802–805.
6. Zhang, T.; Zhang, X.; Liu, Z.D. Requirement-driven service composition approach for Internet of Things.
Appl. Res. Comput. 2013, 30, 1756–1759, 1763.
7. Zhou, M.; Yan, M.A. QoS-aware computational method for IoT composite service. J. China Univ.
Posts Telecommun. 2013, 20, 35–39. [CrossRef]
8. Aazam, M.; St-Hilaire, M.; Lung, C.H.; Lambadaris, I. MeFoRE: QoE based resource estimation at fog to
enhance QoS in IoT. In Proceedings of the International Conference on Telecommunications, Thessaloniki,
Greece, 16–18 May 2016.
9. Li, L.; Rong, M.; Zhang, G. An Internet of Things QoE evaluation method based on multiple linear regression
analysis. In Proceedings of the International Conference on Computer Science & Education, Cambridge,
UK, 22–24 July 2015; pp. 925–928.
10. Ikeda, Y.; Kouno, S.; Shiozu, A.; Noritake, K. A framework of scalable QoE modeling for application explosion
in the Internet of Things. In Proceedings of the 2016 IEEE 3rd World Forum on Internet of Things (WF-IoT),
Reston, VA, USA, 12–14 December 2016; pp. 425–429.
11. Gaillard, G.; Barthel, D.; Theoleyre, F.; Valois, F. SLA Specification for IoT Operation—The WSN-SLA
Framework. Netw. Int. Archit. 2014, 1, 71.
12. Singh, A.; Viniotis, Y. An SLA-based resource allocation for IoT applications in cloud environments.
In Proceedings of the 2016 Cloudification of the Internet of Things (CIoT), Paris, France,
23–25 November 2016.
13. Grubitzsch, P.; Braun, I.; Fichtl, H.; Springer, T.; Hara, T.; Schill, A. ML-SLA: Multi-Level Service Level
Agreements for Highly Flexible IoT Services. In Proceedings of the 2017 IEEE International Congress on
Internet of Things (ICIOT), Honolulu, HI, USA, 25–30 June 2017.
14. Awan, I.; Younas, M.; Naveed, W. Modelling QoS in IoT Applications. In Proceedings of the International
Conference on Network-Based Information Systems, Salerno, Italy, 10–12 September 2014.
15. Duan, R.; Chen, X.; Xing, T. A QoS Architecture for IOT. In Proceedings of the CPSCom 2011: The 4th IEEE
International Conference on Cyber, Physical, and Social Computing, Dalian, China, 19–22 October 2011;
pp. 717–720.
16. Tahaei, H.; Ko, K.; Seo, W.; Joo, S. A QoE Based Trustable SDN Framework for IoT Devices in Mobile
Edge Computing. In Advances in Computer Science and Ubiquitous Computing; Springer: Heidelberg/Berlin,
Germany, 2018.
17. Liu, J.; Chen, Y.; Chen, X. A Cooperative Evolution for QoS-driven IoT Service Composition. Automatika
2013, 54, 438–447. [CrossRef]
18. Karageorgos, A.; Karageorgos, A.; Houstis, C. Decentralized service discovery and selection in Internet of
Things applications based on artificial potential fields. Serv. Oriented Comput. Appl. 2017, 11, 75–86.
19. Kanagaraju, P.; Nallusamy, R. Registry service selection based secured Internet of Things with imperative
control for industrial applications. Clust. Comput. 2018, 1–13. [CrossRef]
20. Yildizel, S.A.; Öztürk, A.U. A study on the estimation of prefabricated glass fiber reinforced concrete panel
strength values with an artificial neural network model. Comput. Mater. Cont. 2015, 52, 41–52.Sensors 2018, 18, 2190 13 of 13
21. Andročec, D. Overcoming Service-Level Interoperability Challenges of the IoT. In Computer Communications
and Networks; Springer: Heidelberg/Berlin, Germany, 2017.
22. Khalil, A.; Mbarek, N.; Togni, O. Service Level Guarantee Framework for IoT environments. In Proceedings
of the International Conference on Internet of Things and Machine Learning, Liverpool City, UK,
17–18 October 2017.
23. Kim, E.A.; Kim, K.S.; Leem, C.S.; Lee, C.H. A Study on Development and Application of Taxonomy of
Internet of Things Service. J. Soc. e-Bus. Stud. 2015, 20, 107–123. [CrossRef]
24. Kaur, J.; Kaur, K. A fuzzy approach for an IoT-based automated employee performance appraisal.
Comput. Mater. Cont. 2015, 53, 24–38.
25. Zadeh, L.A. Fuzzy sets. Inf. Control 1965, 8, 338–353. [CrossRef]
26. Zadeh, L.A. Fuzzy sets as a basis for a theory of possibility. Fuzzy Sets Syst. 1978, 1, 3–28. [CrossRef]
27. Zhuang, Z. Estimation method of student’s cognitive level in self-adaptive distance tutoring system.
Comput. Eng. Appl. 2007, 43, 220–223.
c 2018 by the authors. Licensee MDPI, Basel, Switzerland. This article is an open access
article distributed under the terms and conditions of the Creative Commons Attribution
(CC BY) license (http://creativecommons.org/licenses/by/4.0/).You can also read