A brain network for deep brain stimulation induced cognitive decline in Parkinson's disease
←
→
Page content transcription
If your browser does not render page correctly, please read the page content below

https://doi.org/10.1093/brain/awac012                                                                        BRAIN 2022: 145; 1410–1421           | 1410

A brain network for deep brain stimulation
induced cognitive decline in Parkinson’s
disease

                                                                                                                                                               Downloaded from https://academic.oup.com/brain/article/145/4/1410/6509276 by guest on 19 June 2022
Martin M. Reich,1,2,3 Joey Hsu,1,2,4 Michael Ferguson,1,2,5 Frederic L. W. V. J. Schaper,1,2,5
  Juho Joutsa,1,6,7 Jonas Roothans,3 Robert C. Nickl,8 Anneke Frankemolle-Gilbert,9
Jay Alberts,10 Jens Volkmann3 and Michael D. Fox1,2,5,11

See Kuhn et al. (https://doi.org/10.1093/brain/awac101) for a scientific commentary on this article.

Deep brain stimulation is an effective treatment for Parkinson’s disease but can be complicated by side-effects such as
cognitive decline. There is often a delay before this side-effect is apparent and the mechanism is unknown, making it
difficult to identify patients at risk or select appropriate deep brain stimulation settings. Here, we test whether
connectivity between the stimulation site and other brain regions is associated with cognitive decline following deep
brain stimulation. First, we studied a unique patient cohort with cognitive decline following subthalamic deep brain
stimulation for Parkinson’s disease (n = 10) where reprogramming relieved the side-effect without loss of motor
benefit. Using resting state functional connectivity data from a large normative cohort (n = 1000), we computed
connectivity between each stimulation site and the subiculum, an a priori brain region functionally connected to brain
lesions causing memory impairment. Connectivity between deep brain stimulation sites and this same subiculum
region was significantly associated with deep brain stimulation induced cognitive decline (P , 0.02).
We next performed a data-driven analysis to identify connections most associated with deep brain stimulation induced
cognitive decline. Deep brain stimulation sites causing cognitive decline (versus those that did not) were more connected
to the anterior cingulate, caudate nucleus, hippocampus, and cognitive regions of the cerebellum (PFWE , 0.05). The
spatial topography of this deep brain stimulation-based circuit for cognitive decline aligned with an a priori lesion-
based circuit for memory impairment (P = 0.017). To begin translating these results into a clinical tool that might be
used for deep brain stimulation programming, we generated a ‘heat map’ in which the intensity of each voxel reflects
the connectivity to our cognitive decline circuit. We then validated this heat map using an independent dataset of
Parkinson’s disease patients in which cognitive performance was measured following subthalamic deep brain
stimulation (n = 33). Intersection of deep brain stimulation sites with our heat map was correlated with changes in
the Mattis dementia rating scale 1 year after lead implantation (r = 0.39; P = 0.028).
Finally, to illustrate how this heat map might be used in clinical practice, we present a case that was flagged as ‘high risk’
for cognitive decline based on intersection of the patient’s deep brain stimulation site with our heat map. This patient had
indeed experienced cognitive decline and our heat map was used to select alternative deep brain stimulation parameters.
At 14 days follow-up the patient’s cognition improved without loss of motor benefit. These results lend insight into the
mechanism of deep brain stimulation induced cognitive decline and suggest that connectivity-based heat maps may help
identify patients at risk and who might benefit from deep brain stimulation reprogramming.

1   Berenson-Allen Center for Noninvasive Brain Stimulation and Division of Cognitive Neurology, Department of
    Neurology, Beth Israel Deaconess Medical Center, Harvard Medical School, Boston, MA, USA
2   Harvard Medical School, Boston, MA, USA

Received August 26, 2021. Revised November 15, 2021. Accepted December 19, 2021. Advance access publication January 17, 2022
© The Author(s) 2022. Published by Oxford University Press on behalf of the Guarantors of Brain.
This is an Open Access article distributed under the terms of the Creative Commons Attribution License (https://creativecommons.org/licenses/by/4.0/), which
permits unrestricted reuse, distribution, and reproduction in any medium, provided the original work is properly cited.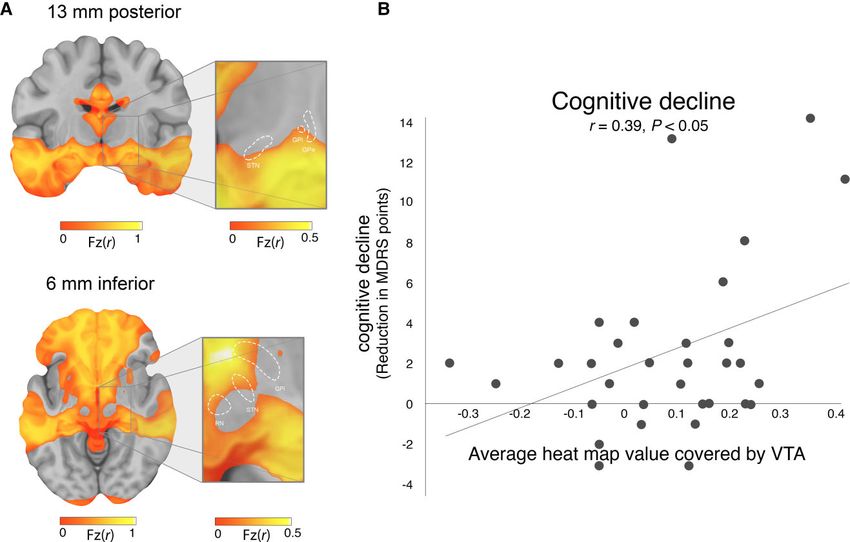
Cognitive decline in DBS                                                                       BRAIN 2022: 145; 1410–1421       | 1411

3  Department of Neurology, University Hospital and Julius-Maximilians-University, Wuerzburg, Germany
4  School of Medicine, University of Pittsburgh, Pittsburgh, PA, USA
5  Center for Brain Circuit Therapeutics, Department of Neurology, Psychiatry, and Radiology, Brigham & Women’s
   Hospital, Boston, MA, USA
6 Turku Brain and Mind Center, Clinical Neurosciences, University of Turku, Turku, Finland
7 Turku PET Centre, Neurocenter, Turku University Hospital, Turku, Finland
8 Department of Neurosurgery, University Hospital and Julius-Maximilians-University, Wuerzburg, Germany
9 Department of Biomedical Engineering, Duke University, Durham, NC, USA
10 Department of Biomedical Engineering, Cleveland Clinic, Cleveland, OH, USA
11 Martinos Center for Biomedical Imaging and Department of Neurology, Massachusetts General Hospital, Harvard
   Medical School, Boston, MA, USA

Correspondence to: Michael D. Fox, MD, PhD
Director, Center for Brain Circuit Therapeutics

                                                                                                                                            Downloaded from https://academic.oup.com/brain/article/145/4/1410/6509276 by guest on 19 June 2022
Associate Professor, Harvard Medical School
Brigham and Women’s Hospital, Neurosciences Center
60 Fenwood Road
1st Floor, Hale Building for Transformative Medicine
Boston, MA 02115, USA
E-mail: mdfox@bwh.harvard.edu

Correspondence may also be addressed to: Dr. med. Martin M. Reich, MD
Junior Research Group Leader—visualDBSlab
University Hospital Wuerzburg
Department of Neurology
Josef-Schneider-Str.11, D-97080 Wuerzburg, Germany
E-mail: reich_m1@ukw.de

Keywords: Parkinson’s disease; deep brain stimulation; cognitive decline; connectivity
Abbreviations: DBS = deep brain stimulation; MDRS = Mattis Dementia Rating Scale; STN = subthalamic nucleus;
UPDRS = Unified Parkinson’s disease Rating Scale; VTA =volume of tissue activated

Introduction                                                          memory-related brain regions.14 Given evidence that lesions
                                                                      and DBS sites that cause similar symptoms are connected to the
Deep brain stimulation (DBS) to the subthalamic nucleus improves      same circuit,15 our lesion-based memory circuit provides an a
motor symptoms of Parkinson’s disease by 40–60% and improves          priori template for studying DBS induced cognitive decline.
quality of life.1,2 However, side-effects such as cognitive decline       Here, we test whether connectivity between the stimulation site
can occur in up to 15–20% of patients and dramatically limit this     and other brain regions can predict cognitive decline following
benefit.3 Cognitive decline can stem from neuronal damage              subthalamic nucleus (STN) DBS. We studied a unique Parkinson’s
during the surgery3,4 or from the effects of stimulation after the    disease patient cohort with stimulation-induced cognitive decline
surgery.5 Stimulation-induced cognitive decline can go                following DBS (n = 10) where DBS reprogramming relieved the
unrecognized because it can appear slowly over time and with          side-effect without loss of motor benefit.5 First, we used resting
DBS settings that work well for the primary motor symptoms.5,6 If     state functional connectivity data from a large cohort of healthy
recognized, cognitive decline may be reversible by changing the       subjects (n = 1000) to test whether stimulation sites causing
DBS settings.5 However, there is currently no effective way to        cognitive decline were more connected to an a priori region in the
predict who will develop stimulation-induced cognitive decline or     subiculum previously derived from brain lesions.14 Second, we
select DBS settings to avoid this side effect.3                       performed a data-driven analysis to identify connections most
    Accumulating evidence suggests that both the benefits and          associated with DBS induced cognitive decline and tested for
side-effects of DBS may come from stimulation of specific brain        alignment with connections most associated with post-stroke
circuits.7–10 Normative human brain connectomes, based on             cognitive impairment. Accordingly, different cognitive metrics were
specialized MRI scans from thousands of healthy individuals,11        used in post-stroke (episodic memory)14 and post-DBS cognitive
can be used to identify these brain circuits without requiring        decline (n-back task).5 Third, we generated a ‘heat map’ in
connectivity data from the DBS patients themselves. Thus, this        which the intensity of each voxel reflects the connectivity to our
connectome approach can be applied to almost any clinical DBS         cognitive decline circuit, which could provide a clinically useful
dataset.10,12,13 Although this connectome approach has not yet        template to predict the risk of cognitive decline post DBS and
been used to study post-DBS cognitive decline, it has been used       guide DBS programming. Finally, we validated this heat map by
to study post-stroke cognitive decline.14 Specifically, lesion         testing whether it could identify stimulation sites associated
locations causing memory impairment show stronger                     with cognitive decline in an independent dataset of Parkinson’s
connectivity to the subiculum and a network of other                  disease patients post STN DBS (n = 33).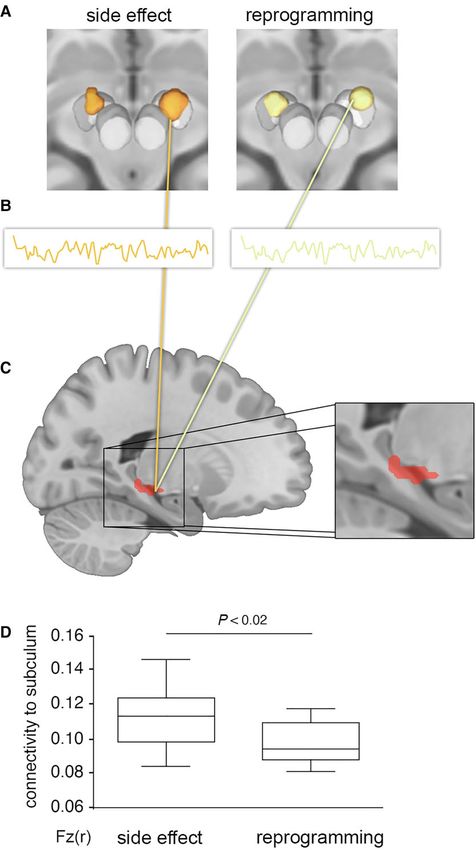
1412 | BRAIN 2022: 145; 1410–1421                                                                                          M. M. Reich et al.

Materials and methods                                                      VTAs, similar to prior work.19 Significance was assessed by
                                                                           permuting the data (switching the assignment of side effect
Overall study design and participants                                      versus reprogrammed VTA) and repeating the analysis 5000
Two independent cohorts of Parkinson’s disease patients with STN           times. The analysis was conducted using FSL PALM. We
DBS were included in this study, a ‘DBS reprogramming’ cohort              controlled for multiple comparisons using threshold free
(n = 10) with two stimulation settings (one with and one without           cluster-enhancement20 and family-wise error (FWE)-corrected
the cognitive side effects) per patient, and a ‘DBS validation’            α of 0.05. We also looked for significant voxels at a liberal
cohort (n = 33) with one stimulation setting per patient. The DBS          uncorrected α of 0.05.
reprogramming cohort was used to test our a priori hypotheses,
derive a data-driven circuit for DBS cognitive decline, and derive a       Relating side-effects to stimulation site
heat map for DBS induced cognitive decline. The DBS validation             connectivity: reprogramming cohort
cohort was used to test whether our heat map (derived from the
reprogramming cohort) could identify patients at risk of cognitive         To compute connectivity between stimulation sites and other brain
decline in an independent dataset and potentially guide                    regions, we used a database of normative human connectome data
                                                                           as in prior work from our group.10,21 This resting state functional

                                                                                                                                                  Downloaded from https://academic.oup.com/brain/article/145/4/1410/6509276 by guest on 19 June 2022
reprogramming.
    The study was carried out in accordance with the Declaration of        MRI blood oxygen level-dependent (BOLD) dataset was obtained
Helsinki and approved by the institutional review board of the Beth        from 1000 healthy subjects using a 3T Siemens scanner as part of
Israel Deaconess Medical Center, Boston, USA (IRB Protocol no.             the Brain Genomics Superstruct Project.11,22 Preprocessing of the
2018P000128).                                                              BOLD data included regression of global signal, white matter and
                                                                           CSF signals, and the six motion parameters, as well as spatial
DBS reprogramming cohort                                                   smoothing with a 6 mm full width at half maximum kernel as
                                                                           previously described.11 The resolution of the connectome data and
The DBS reprogramming cohort consisted of 10 patients with                 calculated connectivity maps was 2 × 2 × 2 mm.
Parkinson’s disease who experienced cognitive decline following                First, we computed connectivity between each stimulation site
STN-DBS measured with the n-back task.5 These patients then                and an a priori region of interest at the junction of the
underwent DBS reprogramming which improved the cognitive                   hippocampus and retrosplenial cortex (subiculum-retrosplenial
side-effects [2-back condition, F(4,18) = 2.9945, P = 0.033, n2 = 0.247]   continuum).14 This region of interest came from a prior study
without significant change in motor benefit [Unified Parkinson’s              showing that connectivity between lesion locations and this
disease Rating Scale (UPDRS)-III: 30.0 + 2.4 points versus 30.5 + 5.6      region of interest was sensitive and specific for memory
points; P = 0.76]. The n-back task required the participant to repeat      impairment.14 We tested the hypothesis that connectivity
the nth item back (e.g. 0-back, 1-back and 2-back) in a sequentially       between DBS sites and this same region of interest would be
presented list of items.16Additional details regarding this DBS cohort     associated with post-DBS memory impairment. A paired t-test
are available in the original publication.5 To our knowledge, this DBS     was performed on the difference in VTA connectivity to this
cohort is unique in that each patient has two stimulation settings         region of interest (side effect versus reprogrammed VTAs), and α
that differ only in the degree to which they caused cognitive side         level of 0.05 was selected for statistical significance.
effects. As such, this was an ideal dataset in which to test our               Second, we used a hypothesis-free data-driven approach to
hypotheses and derive a DBS cognitive -decline circuit.                    identify connections associated with DBS induced cognitive
                                                                           decline. The approach was similar to prior work,10,23 but modified
Identification of stimulation                                               to compare VTA connectivity within a subject rather than across
sites: reprogramming cohort                                                subjects. Whole-brain functional connectivity maps were
                                                                           generated for the side-effect-causing and reprogramming VTAs
As described previously,5 each subject’s electrode position was
                                                                           for each subject as follows. First, the mean BOLD time course was
identified using a patient-specific DBS computer model generated
                                                                           extracted from voxels within each VTA and correlated with the
using Cicerone v1.2.5,17 Briefly, co-registration between the frame
                                                                           time courses of all other brain voxels. This procedure was
image (T1-weighted) and a postoperative CT verified the intended
                                                                           performed using the resting-state fMRI data for each subject in
surgical placement of the DBS electrode (Medtronic Electrode
                                                                           our 1000-subject connectome dataset, generating 1000 ‘r’-maps
Model 3387 or 3389) and obtained the final stereotactic
                                                                           for each VTA. Then, the Fisher z-transformation was applied to
coordinates. This was displayed within the model system and
                                                                           each ‘r’-map, and the resulting ‘Fz’-maps were averaged to
volume of tissue activated (VTA) was computed for each subject
                                                                           generate the whole-brain connectivity map for each VTA. A
before and after reprogramming using the built-in models of
                                                                           statistical group ‘cognitive decline map’ was then obtained from
Cicerone v1.2.18 Images were then normalized into ICBM 2009b
                                                                           these connectivity maps via a permutation-based, voxel-wise
NLIN asymmetric space based on the local atlas registrations
                                                                           paired t-test, performed within FSL PALM and using threshold
using a self-made MATLAB tool. To avoid any potential for bias in
                                                                           free cluster-enhancement20 and 5000 permutations. FWE
electrode localization or VTA modelling, the VTAs used for our
                                                                           correction was applied and an α level of 0.05 was selected to
analyses are identical to those used in the initial publication of
                                                                           identify voxels demonstrating significant preferential positive
this dataset.5
                                                                           connectivity to the side-effect-causing VTAs. Note that this was
                                                                           the same statistical analysis we used to contrast the VTA locations.
Relating side-effects to stimulation site
                                                                               Third, we tested whether our data-driven map of DBS-induced
location: reprogramming cohort
                                                                           cognitive decline was similar to our published map of
To determine if side-effects could be predicted by VTA location            lesion-induced      memory       impairment.14     This  map      of
alone, we performed a voxelwise paired t-test contrasting                  lesion-induced memory impairment consists of voxels
the location of the side effect VTAs with the reprogrammed                 significantly more connected to lesions causing amnesia than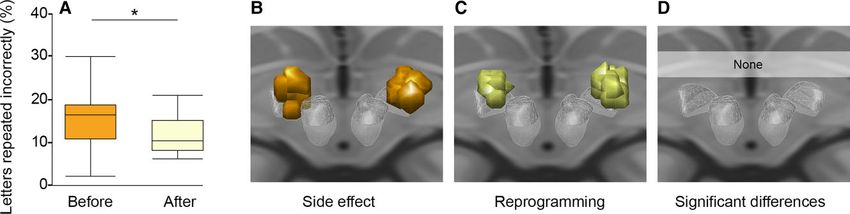
Cognitive decline in DBS                                                                             BRAIN 2022: 145; 1410–1421            | 1413

lesions causing other symptoms.14 We used spatial correlation to        Table 1 Demographic characteristics and chronic stimulation
quantify the similarity between the DBS- and lesion-derived             parameters of the independent cohort subdivided in patients
maps and then recalculated this metric based on permuted                with clinically relevant cognitive decline (≥5 points reduction
versions of the DBS dataset (swapping side-effect-causing and           in the 1-year follow-up) and control subjects
reprogramming VTAs) to test whether the observed value was
                                                                          Characteristic                           Validation cohort (n = 33)
stronger than expected by chance (10 000 permutations and an α
level of 0.05), similar to a recent work from our group.15                                                    Cognitive decline        Control
    Finally, we tested whether our DBS-induced cognitive decline
                                                                          n                                           6                   27
network was distinct from our previously published network for
                                                                          Age at surgery, years                  59.2 (+7.1)          60.7 (+8.0)
DBS-induced motor improvement.10 First, we compared the
                                                                          Disease duration prior to              11.7 (+2.7)          12.9 (+4.5)
topography of the two networks using the same spatial                        surgery, years
correlation and permutation technique detailed above. Second,             Baseline motor severity               50.2 (+16.9)         50.0 (+10.8)
we computed the connectivity between each VTA (clinical and                  (UPDRS-III)
reprogramming) and each network (cognitive decline and motor              Baseline side-effect                  141.5 (+2.0)         141.1 (+2.5)
improvement). We hypothesized that connectivity of VTAs to our               severity (MDRS)

                                                                                                                                                     Downloaded from https://academic.oup.com/brain/article/145/4/1410/6509276 by guest on 19 June 2022
cognitive decline network would be associated with n-back task            Follow-up time, months                    12.0                 12.0
performance, but not motor improvement (measured as change                Motor improvement over                42.8 (+11.3)         55.5 (+15.9)
                                                                             baseline, %
in UPDRS-III scores with DBS on versus DBS off, both assessed
                                                                          Follow-up side effect                 131.8 (+4.4)         140.2 (+2.6)
after overnight medication OFF).5 Conversely, we hypothesized
                                                                             severity (MDRS)
that connectivity to our motor improvement network would be
                                                                          Stimulation parameters
associated with motor improvement, but not n-back task                      Amplitude, mA                         3.2 (+1.4)           3.2 (+0.8)
performance.                                                                Pulse width, µs                           60                   60
                                                                            Frequency, Hz                       150.0 (+27.4)        146.7 (+23.9)

Local network heat map projection: reprogramming                        Values are presented as mean (+SD).
cohort
We transformed our data-driven map of connections associated            based on the preoperative MRI. DBS electrode contacts were
with DBS induced cognitive decline into a ‘heat map’ that could         localized within MNI space and VTAs were simulated using
more easily be used to guide DBS programming. This heat map             Lead-DBS software.10 As with our reprogramming cohort, we used
could allow for the evaluation of new VTAs through their direct         previously published VTAs to avoid any potential bias in lead
overlap on the heat map—a much less computationally                     localization or VTA generation.
intensive process compared to recalculating the connectivity of             We computed the intersection between the VTAs from each
each VTA with our cognitive decline network. The heat map               patient in our validation cohort (n = 33) with the heat map
was generated by calculating the spatial correlation between            generated using the data from our reprogramming cohort. The
the whole-brain connectivity map for each brain voxel and the           average value of all heat map voxels intersected by each VTA
‘reference’ cognitive decline map. The spatial correlation values       was calculated to generate a single ‘cognitive decline risk score’
were then Fisher z-transformed. Thus, the value at each voxel           for each subject. We then tested for a correlation between this
reflects the connectivity of that voxel to our cognitive decline         risk score and measured cognitive decline (change between
map. In theory, the average value of heat map voxels                    baseline and 1-year follow-up MDRS). We also stratified patients
encompassed by a VTA should reflect the risk of cognitive                into three risk groups based on the intersection of their VTAs
decline symptoms resulting from that VTA.                               with our heat map. Specifically, we split patients into three equal
                                                                        sized groups for low (−0.1 + 0.11, n = 11), medium (0.09 + 0.04,
                                                                        n = 10) and high risk (0.234 + 0.08, n = 11). ANOVA were used to
Heat map validation in independent cohort
                                                                        analyse variance between these three groups and posthoc we
The DBS validation cohort consisted of 33 patients with Parkinson’s     tested if two groups differ in cognitive changes between baseline
disease who consecutive received STN-DBS in Wurzberg, Germany           and 1-year follow-up.
between 2011 and 2015. This was a subset of patients from our prior         For the patients in our high-risk group, we tested whether we
study10 who completed cognitive testing (baseline and 1-year            could find new stimulation that would lead to a lower risk of
follow-up Mattis Dementia Rating scale, MDRS). Since passage of         cognitive decline. This was done by simulating monopolar
the lead through the head of the caudate during DBS surgery has         VTAs at all four contacts, for the left and right electrodes,
been associated with cognitive decline,3 all lead trajectories were     using a single standard VTA (3.2 mA; 60 µs). Parameters for this
blindly evaluated in Elements (Brainlab Inc.) by a neurosurgeon         single standard VTA were based on the average stimulation
(R.C.N.) trained in stereotactic surgery, and any subjects meeting      settings from our independent reprogramming cohort (Table 1).
this criterion were also excluded (n = 1). The clinical details are     In total, there were 16 stimulation settings tested for each
presented in Table 1.                                                   patient (four contacts on both the left and right electrode). For
    DBS leads in the validation cohort were localized as described in   each setting, we computed a cognitive risk score based on
the original publication of this dataset.10 Briefly, postoperative       intersection with our heat map. One patient in our high-risk
images were linearly co-registered to preoperative MRI using SPM12      group returned for routine clinical follow-up during the time
(http://www.fil.ion.ucl.ac.uk/spm/software/spm12/; postoperative         our analyses were being done. As the patient had experienced
MRI). Images were then normalized into ICBM 2009b NLIN                  cognitive decline, the DBS settings were changed based on our
asymmetric space using the SyN approach implemented in                  heat map. A UPDRS score and MDRS score were repeated at
advanced normalization tools (http://stnava.github.io/ANTs/)            14 days.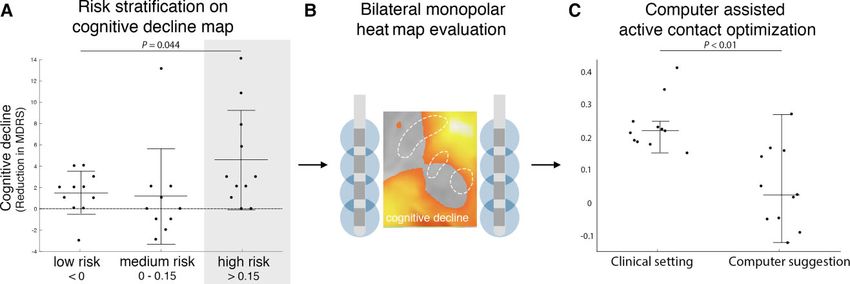
1414 | BRAIN 2022: 145; 1410–1421                                                                                             M. M. Reich et al.

Statistical analysis                                                            Further supporting a differentiation between networks, we
                                                                            found that connectivity of VTAs to our cognitive decline network
All statistical analyses were performed with GraphPad Prism 6               was correlated with baseline n-back task performance (r = 0.663
(Version 2015) and an α level of 0.05 was selected as significant.           P = 0.013) but not motor improvement (r = 0.31 P = 0.1914).
For voxel-wise analyses, which were performed with FSL PALM as              Conversely, connectivity of VTAs to our motor improvement
described above, FWE correction was applied with α level of 0.05.           network was correlated with UPDRS-III improvement (r = 0.597,
                                                                            P = 0.034) but not n-back task performance (r = 0.083 P = 0.41).
Data availability                                                           With reprogramming, the change in connectivity to our cognitive
                                                                            decline network was significantly greater than the change in
The data that support the findings of this study are available on            connectivity to our motor improvement network (−0.1007 +
request from the corresponding author. The data are not publicly            0.08801 versus −0.034 + 0.02883; P = 0.0195), consistent with a
available due to their containing information that could                    change in n-back scores but no change in UPDRS.5 Finally, the
compromise the privacy of research participants.                            improvement in the n-back task with reprogramming was
                                                                            correlated with the change in connectivity to the cognitive decline
                                                                            network (R = −0.61; P = 0.029) but not correlated with change

                                                                                                                                                      Downloaded from https://academic.oup.com/brain/article/145/4/1410/6509276 by guest on 19 June 2022
Results                                                                     in connectivity to the motor improvement network (R = 0.109;
                                                                            P = 0.38).
DBS reprogramming of cognitive decline:
stimulation location and connectivity profile
                                                                            Network heat maps and individual optimized
In our DBS re-programming cohort,5 comparison between the
                                                                            neuromodulation
location of VTAs associated with the cognitive decline side effect
and the location of VTAs after reprogramming failed to identify             After transforming our DBS-based cognitive decline circuit into a
any voxels significantly associated with cognitive decline, either           voxel-wise heat map, we observed that voxels in the ventral
before or after multiple comparisons correction (Fig. 1). In                anterior STN showed stronger connectivity to our cognitive
contrast, functional connectivity between these same VTAs and               decline circuit than voxels in the dorsal posterior STN (Fig. 4).
our a priori region of interest in the subiculum was significantly           Using an independent STN DBS validation dataset (n = 33), we
associated with cognitive decline (Fig. 2). Consistent with our             found that intersection of VTAs with our cognitive decline
hypothesis and prior lesion-based results,14 VTAs causing                   heat map correlated with cognitive decline measured at 1 year
cognitive decline were more connected to the subiculum than                 post-DBS (change in MDRS (r = 0.39, P , 0.05, Fig. 4).
reprogrammed VTAs that improved this decline (P = 0.015).                       When patients in our validation cohort were stratified into risk
   Using a data-driven analysis, VTAs causing cognitive decline             groups based on the degree of VTA overlap with the cognitive
(versus reprogrammed VTAs) showed stronger functional                       decline heat map, there was a significant difference in cognitive
connectivity to the bilateral anterior cingulate, caudate nucleus,          decline across groups (one-way ANOVA: P = 0.0448; Fig. 5).
hippocampus, and cognitive regions of the cerebellum                        Parkinson’s disease patients in our high-risk group showed
(FWE-corrected P , 0.05, Fig. 3 and Table 2). The topography of             significantly more cognitive decline than patients in our medium
this DBS-based cognitive decline circuit aligned well with our              risk cohort (−4.5 + 4.6 points versus −1.1 + 4.5 points on MDRS,
a priori lesion-based circuit for memory impairment (Fig. 3).14             P = 0.010; Fig. 5A) or low risk cohort (−4.5 + 4.6 points versus −1.0
These circuits were significantly more similar than expected by              + 1.9 points on MDRS, P = 0.029; Fig. 5A).
chance (spatial r = 0.66; P = 0.017, permutation test). In contrast,            Using a set of simulated VTAs covering all possible monopolar
the topography of our DBS-based cognitive decline network to                electrode choices for each patient, we found that patients in our
our previously published DBS-based motor improvement                        high-risk group could potentially be changed to an alternative
network showed a very low spatial correlation (spatial r = 0.29, P          setting that would decrease their risk of cognitive decline (P ,
= 0.52; Supplementary Fig. 1).10 As such, only 9% of the spatial            0.01; Wilcoxon rank sum test). Specifically, 8/11 patients (72%) in
variance aligns between the two networks, with 91% of the                   the high risk cohort had an alternative DBS setting that would
variance being unique to each network.                                      place them in the lower risk group, predicting a significant

Figure 1 Cognitive decline following STN-DBS can be improved with reprogramming, but there is no significant difference in the stimulation location.
DBS reprogramming resulted in significant improvement in working memory performance in a previously published cohort of 10 Parkinson’s disease
patients. (A) Reproduced from Frankemolle et al.5). VTAs associated with impaired working memory (B) and the reprogrammed VTAs associated with
improved working memory (C) showed no significant difference in stimulation location (D). *P , 0.05.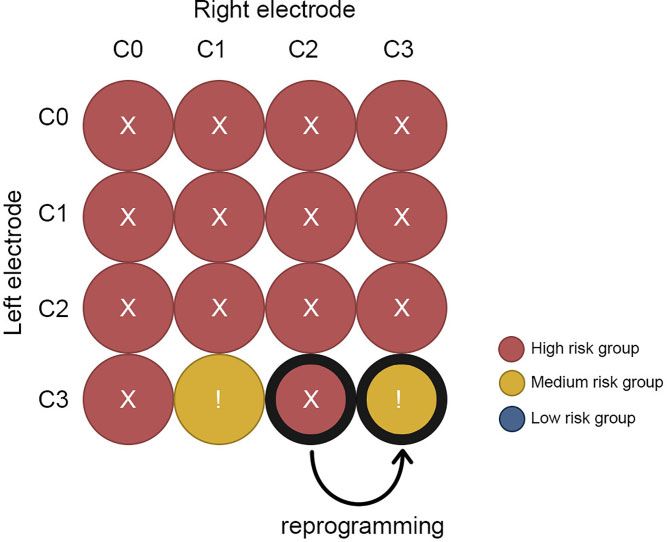
Cognitive decline in DBS                                                                               BRAIN 2022: 145; 1410–1421          | 1415

                                                                                                                                                       Downloaded from https://academic.oup.com/brain/article/145/4/1410/6509276 by guest on 19 June 2022

Figure 2 Connectivity of stimulation site to the subiculum is associated with cognitive decline. For each patient, the VTA associated with cognitive
decline (A, left) and the reprogrammed VTA associated with improvement (A, right) were used as seed regions for a functional connectivity analysis,
leveraging a normative connectome dataset from 1000 healthy subjects (B). We computed connectivity between each VTA and an a priori region of
interest in the subiculum previously linked to lesion-induced memory impairment (C, red, reproduced from Ferguson et al.14). VTAs associated with
cognitive decline were significantly more connected to the subiculum than reprogrammed VTAs associated with improvement (D).

benefit in terms of cognitive decline (clinical setting: 0.22 + 0.08         improved from −11 points on the MDRS (preoperative baseline
versus ‘low risk’ setting 0.03 + 0.12; P , 0.01; Fig. 5C). Results for      versus 1 year post DBS) to −6 points (preoperative baseline
one example patient are shown (Fig. 6) who was seen back in                 versus 14 days after reprogramming). Parkinson’s disease motor
clinic for DBS reprogramming. His DBS site was changed from                 symptom control by STN DBS was unchanged (52%
the clinical setting to an alternative setting with a hypothesized          improvement in UPDRS III versus 48% improvement after
lower risk of cognitive decline based on our heat map. Cognition            reprogramming measured in medication OFF).
1416 | BRAIN 2022: 145; 1410–1421 M. M. Reich et al.
Downloaded from https://academic.oup.com/brain/article/145/4/1410/6509276 by guest on 19 June 2022
Figure 3 Connections associated with DBS-induced cognitive decline are similar to connections associated with lesion-induced memory impairment.
Connections associated with DBS induced cognitive decline are shown using no threshold (A) and after FWE correction for multiple comparisons (B).
Connections associated with lesion-induced memory impairment are shown using no threshold (C) and after FWE correction for multiple comparisons
(D) as previously reported in Ferguson et al.14 Warm colours denote voxels more connected to VTAs/lesions associated with cognitive impairment while
cool colours denote voxels more connected to reprogrammed VTAs/lesions not associated with cognitive impairment. The unthresholded maps (A and
C) can be compared using spatial correlation and permutation analysis and are significantly similar to one another (r = 0.66; P = 0.017). The FWE
corrected maps (B and D) show that similar voxels are statistically significant across both analyses.
Discussion DBS induced cognitive decline and for avoiding this side effect in
DBS patients.
In this study, there are four main findings. First, cognitive decline
following STN DBS for Parkinson’s disease is associated with
Connectivity profiles of DBS effects
connectivity between the stimulation site and a specific network
of other brain regions. Second, this network aligns with regions Our results align well with a growing literature suggesting that
previously implicated in lesion-induced memory impairment.14 connectivity between DBS sites and brain networks is responsible
Third, this network can be converted into a voxel-wise heat map for DBS induced effects.10,24 Further, our results provide further
and intersection of VTAs with this heat map is correlated with support that a normative connectome can be used to identify
cognitive decline in an independent dataset. Finally, we illustrate these networks. While there is value in obtaining connectivity
how this heat map might be used to predict the risk of DBS data from the patients themselves19,24 or using advanced imaging
induced cognitive decline and guide reprogramming. These to directly measure remote DBS effects25,26 this is often not
results have implications for understanding the mechanism of possible in clinical settings. In such cases, using a normativeCognitive decline in DBS BRAIN 2022: 145; 1410–1421 | 1417
Table 2 Brain areas (coordinates of regions and peak-voxel in MNI space) with significantly increased connectivity (FWE corrected)
P (FWE corr.) k Region Coordinates (mm) t value
x y z
Cognitive decline
0.05 26292 Frontal orbital cortex 28 12 −20 4.85
−12 24 −18 4.68
−26 14 −22 4.54
Subcallosal cortex 0 28 −2 4.44
Caudate nucleus −16 −6 26 4.37
−12 14 −4 4.10
Anterior cingulate cortex 4 34 −2 4.32
Posterior cingulate cortex 16 −42 28 4.28
−20 −64 24 3.92
Angular gyrus 44 −46 24 4.15
Downloaded from https://academic.oup.com/brain/article/145/4/1410/6509276 by guest on 19 June 2022
40 −60 −38 3.84
Hippocampus 32 −30 −8 3.85
0.05 1439 Cerebellum, left crus I −40 −58 −36 4.06
0.05 811 Cerebellum, left IX −4 −52 −58 4.01
Figure 4 Cognitive decline heat map and validation in an independent cohort. To begin translating our network results into a clinical tool, we generated
a heat map where the intensity at each voxels reflects the connectivity of that voxel to our cognitive decline network (A). In the area of the STN (white
outline), there is an anterior-posterior and dorsal-ventral gradient. We then tested this heat map in an independent cohort of Parkinson’s disease
patients with STN DBS and MDRS at baseline and 1 year after DBS (B). Intersection between VTAs and our cognitive decline heat map was corelated
with cognitive decline measured at 1 year (r = 0.39; P , 0.05).
connectome averaged across thousands of subjects can serve as lower quality (and quantity) than normative connectomes and
useful approximation of the connectivity in each patient.10 While appear to have little impact on results.10,27 This normative
this approach may sacrifice subject-specific differences in connectome approach has worked robustly across brain lesions,28
connectivity, this limitation is largely outweighed by the ability to noninvasive brain stimulation,27 and DBS.29 This approach
produce robust and reproducible connectivity estimates. requires no specialized imaging of the patient, only a record of
Connectomes specific to the population of interest can also be the stimulation location based on routine clinical scans, and thus
used (e.g. from Parkinson’s disease patients) but are generally of can be broadly applied in research or clinical settings.1418 | BRAIN 2022: 145; 1410–1421 M. M. Reich et al.
Downloaded from https://academic.oup.com/brain/article/145/4/1410/6509276 by guest on 19 June 2022
Figure 5 Using the cognitive decline heat map for risk assessment and potential reprogramming. Patients were stratified into three risk groups based
on VTA overlap with our cognitive decline heat map (A). Parkinson’s disease patients in the high-risk cohort showed significantly more cognitive
decline than patients in low-risk cohort and medium risk cohort. We simulated all possible monopolar electrode choices for patients in the
high-risk group (B) and choose the setting that would minimize the risk of cognitive decline (C). In 8 of 11 patients there were alternative
programming settings where cognitive decline could potentially be reduced. One of these high-risk patients presented for routine clinical follow-up
and was reprogrammed, moving from a high risk setting to a medium-risk setting based on the heat map (D). The MDRS improved by 7 points,
while parkinsonism was unchanged (48% to 52% UPDRS III reduced to baseline).
The current study pushes the boundary of this connectivity- that would typically require a much larger cohort when
based approach and provides an important advance. Specifically, performing a more traditional cross-subject analysis. The
the normative connectome was used to estimate connectivity increased power of a within-subject design may come from the
differences between stimulation settings within the same patient, fact that this design controls for many factors that introduce
rather than connectivity difference across patients. These confounds into cross-subject analyses such as genetics, electrode
within-subject VTAs were highly overlapping and appeared nearly trajectory, or disease progression. Further, this dataset was unique
identical, both visually and statistically (Fig. 1). Furthermore, in that there was no change in motor benefit between stimulation
the cohort size was remarkably small (n = 10). In spite of this, settings, allowing one to relate connectivity differences to
statistically significant and reproducible connectivity differences cognitive decline.5
could be identified. This suggests that a within-subject analysis in
a small but well-defined cohort may have the power to detect
connectivity differences associated with specific clinical effects Alignment between DBS effects and lesion networks
An important finding is that our brain network for DBS induced
cognitive decline aligned almost optimally with a recently
published network for lesion-induced memory impairment14 and
is different to the network of DBS induced motor benefits10
(Supplementary Fig. 1). The concordance of the cognitive network
occurred despite that fact that different cognitive metrics were
used in the two studies (n-back task versus episodic memory).
However, this concordance is consistent with prior work
suggesting that the lesion-based network for memory impairment
generalizes across metrics for measuring memory impairment.14
The concordance is also consistent with a growing literature
suggesting that lesion locations and DBS sites that cause similar
effects converge on common brain networks.15,30–33 As such, brain
networks derived from brain lesions may be valuable in guiding
future DBS trials or avoiding other DBS induced side effects. High
frequency DBS (40–180 Hz) is thought to have a functional effect on
brain circuits that is similar to lesions, possibly through altering
network ‘communication’ via information overload.34 As such, one
would expect that high frequency DBS sites that impair a function
would be connected to the same brain circuit as lesions that
Figure 6 DBS programming prediction for an individualized treatment impair that function. This is exactly what we observed here for
An exhaustive evaluation of this patients on the heat map of cognitive memory/cognitive decline and what we have observed previously
decline detected a preferable electrode contact combination to reduce for DBS sites and lesions associated with depression.15 However, it
the risk of cognitive side-effects. We called back this patient and
is possible that different relationships could be observed for
changed stimulation settings from right lead C2 to C3. Parkinsonism
was equally controlled (48–52% UPDRS III reduced to baseline) 14 days alternate DBS settings that act differently than a lesion. For
in the medication OFF state, while the MDRS improved by 7 points to example, low frequency DBS may drive or activate a circuit and
previous DBS settings (still 6 points reduced to preoperative baseline). could have the opposite functional effect from high frequency DBSCognitive decline in DBS BRAIN 2022: 145; 1410–1421 | 1419
or lesions.35 Future work is required to determine whether DBS sites Such observations are consistent with our heat map, which
connected to our memory circuit, but using alternative DBS showed a clear dorsal ventral gradient. However, our heat map
parameters, could improve memory or cognition rather than also showed a clear anterior posterior gradient and depending on
inhibit it.36 the exact location of an individual’s electrode, simply moving to a
more dorsal contact may not avoid our cognitive decline network.
Further work is needed to determine whether reprogramming
Converting connectivity profiles into heat maps
based on our cognitive decline heat map can outperform other
One barrier to translating connectome results into better DBS heuristics.
programming is the relatively long computational time that
would be required to re-compute connectivity with each change Limitations
in the stimulation site or DBS parameters. One cannot simply
Different cognitive metrics were used to define cognitive decline
look at the connectivity network for cognitive decline (e.g. Fig. 3)
across datasets (working memory vs episodic memory versus
and know which DBS settings should be used to avoid this
MDRS). However, this should bias us against the present findings
network. By converting a connectivity profile into a heat map,
of convergence across datasets. Second, the discovery dataset
one can easily test whether a stimulation site intersects this
Downloaded from https://academic.oup.com/brain/article/145/4/1410/6509276 by guest on 19 June 2022
used to generate our DBS induced cognitive decline network was
heat map, choose a site that avoids this heat map, or perform an
remarkably small (n = 10). We could not have used a dataset this
exhaustive review of a patient’s stimulation settings to select an
small to derive a cognitive decline network based on difference
‘ideal’ setting within a matter of seconds. An advantage of the
across subjects. Using a unique within subject analysis, this small
heat map approach is that the connectivity information has all
dataset was sufficient to generate significant findings that were
been ‘precalculated’, allowing a clinician to quickly assess the
then validated in independent datasets. Third all of our primary
risk of cognitive decline from any given stimulation site based
analyses were retrospective. Whether our cognitive decline
on simple intersection between the stimulation site and the
network or heat map can predict cognitive decline remains to be
heat map. This heat map can be distributed as a single small file
tested prospectively. Finally, our single patient that was
and this calculation can be performed in less than a second. In
reprogrammed should be taken as an illustration of how this
contrast, computing connectivity between the stimulation site
approach might be used in a clinical reprogramming scenario. The
and our cognitive decline network (without the heat map)
clinical value of this approach must be assessed using a
requires access to our 1000-subject connectome, specialized
randomized and blinded clinical trial.
software, and computational resources that are not routinely
accessible to DBS clinicians. This conversion of a connectivity
network into a heat map has been used for OCD37 but to our Conclusion
knowledge this is the first use and validation of this approach
for a DBS side effect. Our study shows that DBS-induced cognitive decline is associated
Our cognitive decline heat map, derived using a within-subject with connectivity between the stimulation site and a specific
analysis in a small cohort (n = 10), was correlated with cognitive brain network previously implicated in lesion-induced memory
decline across subjects in an independent cohort. This is an impairment. Transforming this network into a heat map may
important advantage, as small within-subject studies can be easily help identify DBS patients at risk of delayed-onset side-effects
conducted in a research setting (e.g. n = 10 patients), then applied and guide reprogramming efforts.
more broadly to predict DBS effects across different clinical
populations. The ability to predict (side) effects in any patient, Acknowledgements
based only on the location of the patient’s electrodes and their DBS
settings, greatly broadens the impact and clinical utility of this We thank Cameron McIntyre for generously sharing the VTAs and
work. Furthermore, our heat map could be used to improve cognitive metrics from their prior study.
imaging-based implantation strategies and provide the
neurosurgeon with data regarding risk of delayed side effects that
Funding
may not be apparent based on microelectrode recordings or acute
effects of intra-operative test stimulation. So far, our cognitive This study was sponsored by the Interdisziplinäres Zentrum für
decline heat map applies only to STN DBS for Parkinson’s disease. Klinische Forschung (IZKF) of the University Hospital Wuerzburg
Whether this heat map is relevant for cognitive outcomes (Grant number Z-3/64-2) and by a scholarship to M.M.R of the
following STN DBS for other conditions, such as obsessive German Society of Clinical Neurophysiology. M.M.R. and J.V. were
compulsive disorder, requires future study.38 supported by the German Research Foundation (DFG,
Project-ID424778381, TRR 295). J.J. was supported by the Academy of
Finland, Finnish Medical Foundation, Finnish Foundation for Alcohol
Clinical implications on programming DBS
Studies, Instrumentarium Research Foundation and Finnish
Titration of stimulation parameters is a critical component of DBS Parkinson Foundation. MDF was supported by the Nancy Lurie Marks
therapy and focuses predominantly on acute motor benefit and Foundation, the Kaye Family Research Endowment, the Ellison/
acute side-effects evident in real time.29,39 Delayed side effects Baszucki Foundation, and the NIH (R01MH113929, R21MH126271,
such as cognitive decline are therefore problematic and can go R56AG069086, R01MH115949, and R01AG060987).
unrecognized for years or be attributed to progression of the
disease itself rather than DBS.3 Even when DBS is suspected, it is
often unclear which DBS settings should be changed to relieve
Competing interests
the side effect. Previous studies have suggested reprogramming M.M.R. reports grant support and honoraria for speaking from
to more dorsal contacts can help relive cognitive decline.3,5,40 Medtronic and Boston Scientific, outside the submitted work; J.J.1420 | BRAIN 2022: 145; 1410–1421 M. M. Reich et al.
reports a lecturer honorarium from Lundbeck, outside the 16. Dobbs AR, Rule BG. Adult age differences in working memory.
submitted work; J.V. reports grants and personal fees from Psychol Aging. 1989;4:500–503.
Medtronic Inc., grants and personal fees from Boston Scientific, 17. Miocinovic S, Noecker AM, Maks CB, Butson CR, McIntyre CC.
personal fees from St. Jude, outside the submitted work. Cicerone: stereotactic neurophysiological recording and deep
brain stimulation electrode placement software system. Acta
Neurochir Suppl. 2007;97(Pt 2):561–567.
Supplementary material 18. Butson CR, McIntyre CC. Role of electrode design on the volume
of tissue activated during deep brain stimulation. J Neural Eng.
Supplementary material is available at Brain online.
2006;3(1):1–8.
19. Akram H, Sotiropoulos SN, Jbabdi S, et al. Subthalamic deep brain
stimulation sweet spots and hyperdirect cortical connectivity in
References Parkinson’s disease. Neuroimage. 2017;158:332–345.
1. Deuschl G, Schade-Brittinger C, Krack P, et al. A randomized trial 20. Winkler AM, Ridgway GR, Webster MA, Smith SM, Nichols TE.
of deep-brain stimulation for Parkinson’s disease. N Engl J Med. Permutation inference for the general linear model. Neuroimage.
2006;355(9):896–908. 2014;92:381–397.
Downloaded from https://academic.oup.com/brain/article/145/4/1410/6509276 by guest on 19 June 2022
2. Schuepbach WM, Rau J, Knudsen K, et al. Neurostimulation for 21. Darby RR, Horn A, Cushman F, Fox MD. Lesion network
Parkinson’s disease with early motor complications. N Engl localization of criminal behavior. Proc Natl Acad Sci USA. 2018;
J Med. 2013;368(7):610–622. 115(3):601–606.
3. Witt K, Granert O, Daniels C, et al. Relation of lead trajectory and 22. Holmes AJ, Hollinshead MO, O’Keefe TM, et al. Brain
electrode position to neuropsychological outcomes of genomics superstruct project initial data release with
subthalamic neurostimulation in Parkinson’s disease: results structural, functional, and behavioral measures. Sci Data.
from a randomized trial. Brain. 2013;136(Pt 7):2109–2119. 2015;2:150031.
4. Gologorsky Y, Ben-Haim S, Moshier EL, et al. Transgressing the 23. Horn A, Fox MD. Opportunities of connectomic
ventricular wall during subthalamic deep brain stimulation neuromodulation. Neuroimage. 2020;221:117180.
surgery for Parkinson disease increases the risk of adverse 24. Vanegas-Arroyave N, Lauro PM, Huang L, et al. Tractography
neurological sequelae. Neurosurgery. 2011;69(2):294–300. patterns of subthalamic nucleus deep brain stimulation. Brain.
5. Frankemolle AM, Wu J, Noecker AM, et al. Reversing 2016;139(Pt 4):1200–1210.
cognitive-motor impairments in Parkinson’s disease 25. Gibson WS, Jo HJ, Testini P, et al. Functional correlates of the
patients using a computational modelling approach to therapeutic and adverse effects evoked by thalamic
deep brain stimulation programming. Brain. 2010;133(Pt 3): stimulation for essential tremor. Brain. 2016;139(Pt 8):2198–
746–761. 2210.
6. Volkmann J, Daniels C, Witt K. Neuropsychiatric effects of 26. Reich MM, Brumberg J, Pozzi NG, et al. Progressive gait
subthalamic neurostimulation in Parkinson disease. Nat Rev ataxia following deep brain stimulation for essential
Neurol. 2010;6(9):487–498. tremor: adverse effect or lack of efficacy? Brain. 2016;139(11):
7. Montgomery EB Jr, Gale JT. Mechanisms of action of deep 2948–2956.
brain stimulation(DBS). Neurosci Biobehav Rev. 2008;32(3): 27. Weigand A, Horn A, Caballero R, et al. Prospective validation
388–407. that subgenual connectivity predicts antidepressant efficacy
8. Mure H, Hirano S, Tang CC, et al. Parkinson’s disease of transcranial magnetic stimulation sites. Biol Psychiatry.
tremor-related metabolic network: characterization, 2018;84(1):28–37.
progression, and treatment effects. Neuroimage. 2011;54(2): 28. Boes AD, Prasad S, Liu H, et al. Network localization of
1244–1253. neurological symptoms from focal brain lesions. Brain. 2015;
9. Fox MD, Buckner RL, Liu H, Chakravarty MM, Lozano AM, 138(Pt 10):3061–3075.
Pascual-Leone A. Resting-state networks link invasive and 29. Tommasi G, Krack P, Fraix V, et al. Pyramidal tract side effects
noninvasive brain stimulation across diverse psychiatric and induced by deep brain stimulation of the subthalamic
neurological diseases. Proc Natl Acad Sci USA. 2014;111(41): nucleus. J Neurol Neurosurg Psychiatry. 2008;79(7):813–819.
E4367–E4375. 30. Corp DT, Joutsa J, Darby RR, et al. Network localization of
10. Horn A, Reich M, Vorwerk J, et al. Connectivity predicts deep cervical dystonia based on causal brain lesions. Brain. 2019;
brain stimulation outcome in Parkinson disease. Ann Neurol. 142(6):1660–1674.
2017;82(1):67–78. 31. Joutsa J, Horn A, Hsu J, Fox MD. Localizing parkinsonism based
11. Thomas Yeo BT, Krienen FM, Sepulcre J, et al. The organization on focal brain lesions. Brain. 2018;141(8):2445–2456.
of the human cerebral cortex estimated by intrinsic functional 32. Padmanabhan JL, Cooke D, Joutsa J, et al. A human depression
connectivity. J Neurophysiol. 2011;106(3):1125–1165. circuit derived from focal brain lesions. Biol Psychiatry. 2019;
12. Baldermann JC, Melzer C, Zapf A, et al. Connectivity profile 86(10):749–758.
predictive of effective deep brain stimulation in 33. Joutsa J, Shih LC, Horn A, et al. Identifying therapeutic targets
obsessive-compulsive disorder. Biol Psychiatry. 2019;85(9):735– from spontaneous beneficial brain lesions. Ann Neurol. 2018;
743. 84(1):153–157.
13. Al-Fatly B, Ewert S, Kübler D, Kroneberg D, Horn A, Kühn AA. 34. Grill WM, Snyder AN, Miocinovic S. Deep brain stimulation
Connectivity profile of thalamic deep brain stimulation to creates an informational lesion of the stimulated nucleus.
effectively treat essential tremor. Brain. 2019;142(10):3086–3098. Neuroreport. 2004;15(7):1137–1140.
14. Ferguson MA, Lim C, Cooke D, et al. A human memory circuit 35. Pedrosa DJ, Auth M, Eggers C, Timmermann L. Effects of
derived from brain lesions causing amnesia. Nat Commun. low-frequency thalamic deep brain stimulation in essential
2019;10(1):3497. tremor patients. Exp Neurol. 2013;248:205–212.
15. Siddiqi SH, Schaper FLWVJ, Horn A, et al. Brain stimulation and 36. Lozano AM, Fosdick L, Chakravarty MM, et al. A phase II study
brain lesions converge on common causal circuits in of fornix deep brain stimulation in mild Alzheimer’s disease.
neuropsychiatric disease. Nat Hum Behav. 2021;5:1707–1716. J Alzheimers Dis. 2016;54(2):777–787.Cognitive decline in DBS BRAIN 2022: 145; 1410–1421 | 1421
37. Li N, Hollunder B, Baldermann JC, et al. A unified 39. Volkmann J, Moro E, Pahwa R. Basic algorithms for the
functional network target for deep brain stimulation in programming of deep brain stimulation in Parkinson’s
obsessive-compulsive disorder. Biol Psychiatry. 2021;90: disease. Mov Disord. 2006;21(Suppl 14):S284–S289.
701–713. 40. Greenhouse I, Gould S, Houser M, Hicks G, Gross J, Aron AR.
38. Bouwens van der Vlis TAM, Duits A, van de Veerdonk M, et al. Stimulation at dorsal and ventral electrode contacts targeted at
Cognitive outcome after deep brain stimulation for refractory the subthalamic nucleus has different effects on motor and
obsessive-compulsive disorder: A systematic review. emotion functions in Parkinson’s disease. Neuropsychologia.
Neuromodulation. 2022;25(2):185–194. 2011;49(3):528–534.
Downloaded from https://academic.oup.com/brain/article/145/4/1410/6509276 by guest on 19 June 2022You can also read