26th April 2010 - EPA Offices Richview IMP Ireland Steering Group Meeting 4
←
→
Page content transcription
If your browser does not render page correctly, please read the page content below
26th April 2010 – EPA Offices Richview

  IMP Ireland Steering Group Meeting 4

      ImpIreland@APEnvEcon.com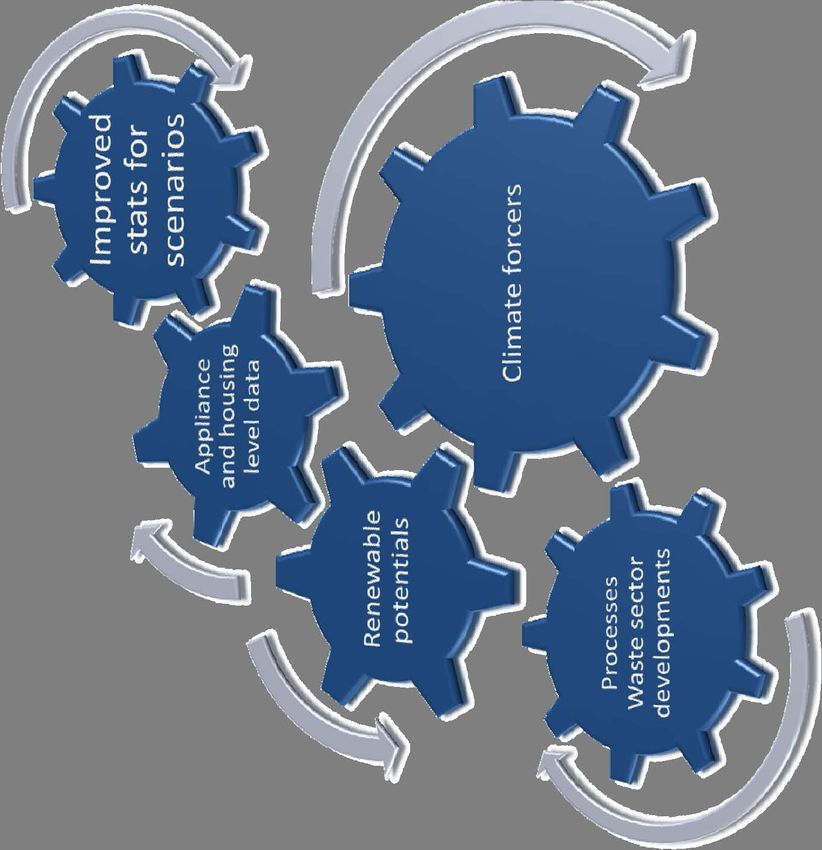
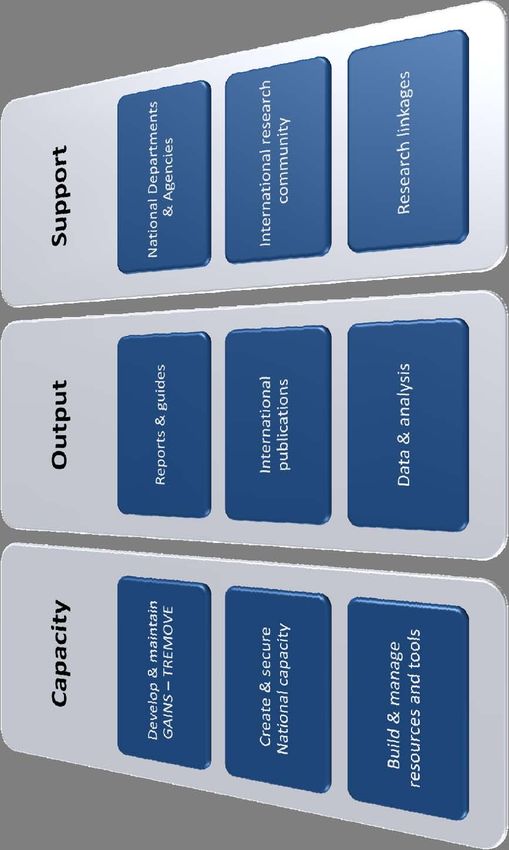
Core objectives of IMP Ireland

Presentation Structure

TREMOVE Ireland           GAINS Ireland             Policy Support &
   Progress                 Progress               International work

         Policymeasures.com               October Plan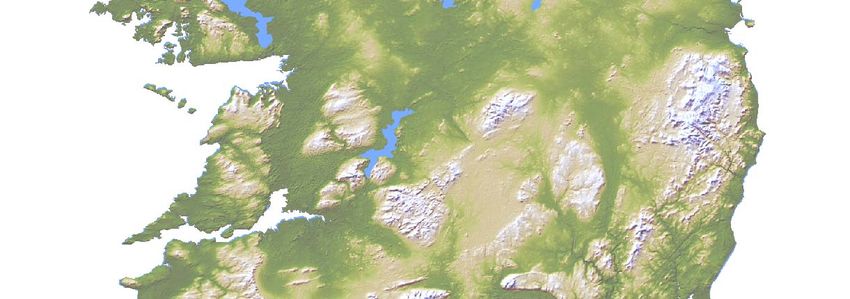
Section 1 of 5

TREMOVE IRELAND PROGRESS

Summary Progress ‐ TREMOVE

  Force calibrated model to update base case year(s)
    parameters. Continuing to work at C:\ level to
     reprogram the model for any given analysis.

 Maintaining system with best available data – prices,
  taxes, vkm, tkm, fleet. Regionalising and exploring
 data to inform more targeted policies. Ongoing task.

  Generating analytical outputs and policy relevant
      deliverables. Papers – Reports – Guide.

 Developing new data sets for further enhancements.
 Linking and feeding into GAINS Transport calibration.
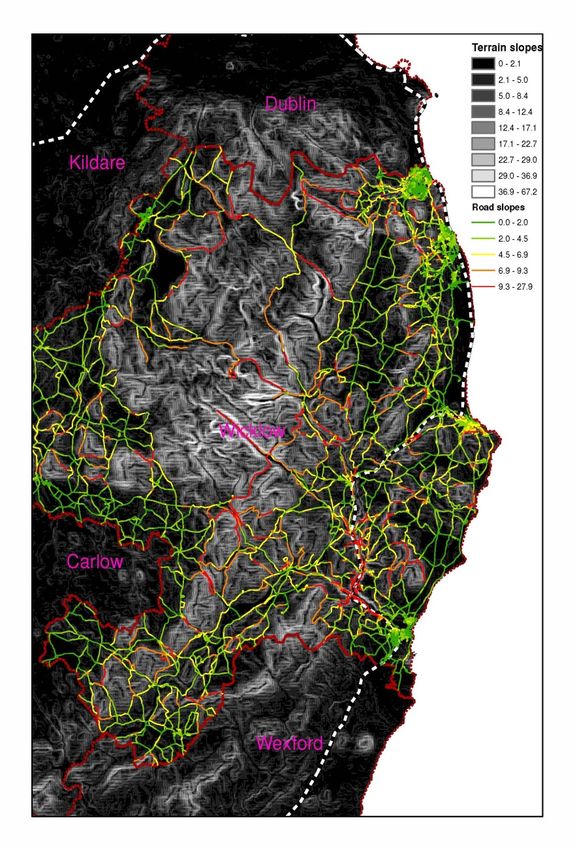
TREMOVE GIS

Example on the right is exploring the
slope of road areas in the greater
Dublin area.

This work has then been overlayed
against the URBIS Street map layer.

This can then be used to estimate
improved parameters for the
TREMOVE calculation of emissions
from goods vehicles.
TREMOVE GUI

We are supporting the European Commission efforts to redevelop a GUI for the TREMOVE model. This puts us
firmly in the mix of the core modellers in this area – working principally with the team behind COPERT.

The GUI will be made publically available and offers greater accessibility to the model analysis. Albeit with the
same complexities of scale and challenges in sourcing parameter values.

However… whilst more accessible, the system is far less flexible and we are not likely to use the GUI as we
have far greater control by reprogramming and manipulating the model at the command line.
TREMOVE Paper I
Assessment of the impacts of ownership and usage based carbon related taxation on fleet structure, emissions
                           and welfare – Key assumptions identification for policy

The first full paper based on TREMOVE analysis has been completed, submitted and accepted to EAERE World
Congress, and will be submitted to a journal in the summer. The paper tests the impact of varied carbon
related taxation, also illustrating sensitivity to three key parameter assumptions. The piece concludes with
recommendations for policy design.

  CO2 emission and energy consumption reduction between simulation and basecase

                               Only fuel carbon tax               VRT and motor carbon tax               VRT, motor and fuel

       Scenario
                       All            Imm              High     All        Imm          High     All            Imm             High
                      costs           costs            EOS     costs       costs        EOS     costs           costs           EOS

             2015     ‐1.85%         ‐3.37%           ‐3.69%   ‐0.06%     ‐0.37%       ‐0.36%   ‐1.92%         ‐3.72%          ‐4.04%

    CO2      2020     ‐1.87%         ‐3.42%           ‐3.73%   ‐0.06%     ‐0.56%       ‐0.54%   ‐1.93%         ‐3.95%          ‐4.24%

             2030     ‐1.84%         ‐3.47%           ‐3.77%   ‐0.11%     ‐0.78%       ‐0.76%   ‐1.95%         ‐4.21%          ‐4.48%

             2015     ‐1.87%         ‐3.38%           ‐3.71%   ‐0.11%     ‐0.42%       ‐0.41%   ‐1.98%         ‐3.78%          ‐4.1%

    Egy      2020     ‐1.89%         ‐3.45%           ‐3.76%   ‐0.13%     ‐0.63%       ‐0.61%   ‐2.03%         ‐4.05%          ‐4.34%

             2030     ‐1.88%         ‐3.51%           ‐3.81%   ‐0.21%     ‐0.87%       ‐0.85%   ‐2.08%         ‐4.34%          ‐4.61%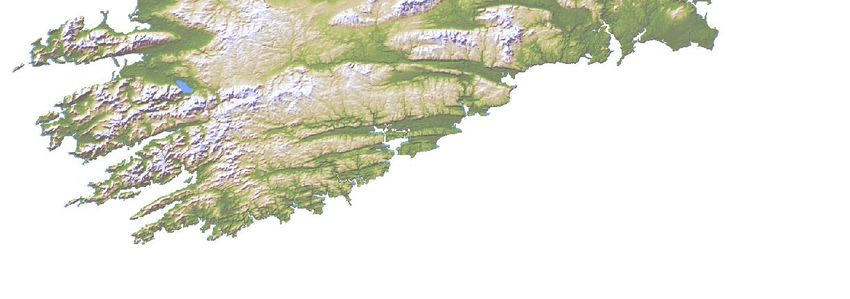
Legend

                                                 60
                                                Legend
  Transport Paper II                             Disposable income
                                                       60
                                                 Population density
                                                 Road slope
                                                        Disposable income
                                                 Rail frequency
                                                        Population density
                                                                                        Donegal
                                                        Road slope

Do regional characteristics affect the                  Rail frequency

distribution of car engine sizes?
―A longitudinal multinomial logit study
based on county data of Ireland                                              Sligo        Leitrim
                                                                                                              Monaghan

                                                                                                       Cavan              Louth
                                                              Mayo

The map on the right illustrates the                                         Roscommon
                                                                                           Longford
county characteristics which explain the                                                        Westmeath
                                                                                                                   Meath

purchase probabilities.                                                  Galway
                                                                                                                            Dublin

                                                                                             Offaly
                                                                                                                Kildare

Examined birth rates, disposable income,                                                              Laois                 Wicklow

public transport service, population                                 Clare
                                                                                     Tipperary NR                Carlow
densities and road characteristics to
                                                                                                        Kilkenny
understand the factors which contribute                                Limerick
                                                                                       Tipperary SR                 Wexford
toward car engine size preferences in the
                                                                                             Waterford
vehicle purchase decision.                            Kerry

                                                                         Cork

Has relevance for policies focused on
gradual fleet evolution characteristics.
Section 2 of 5

GAINS IRELAND PROGRESS
Summary Progress ‐ GAINS

Completed Harmonisation V3 Report – Shifting to Sectoral
  Focus Reports. Evolving work with greater GHG focus.

  ‘Base’ and ‘White’ scenarios loaded. Refinements still
 being made, but hopefully stable for analysis for 1 year.

Good cohesion for AQ on blind test with EPA. Opportunity
 to continue to work together on projections and policy.

   Model is evolving reasonably quickly – Increased
 parameters and detail with more forthcoming. We will
                      keep pace.

   Exec Scenario Report drafted. Work continues on
   uncertainty, NTMs, MACs. Model used regularly in
 connection with policy support work and these pieces.
Blind NOX Comparison
Sum of emissions
2020 White
Good consistency across industry, domestic
and other transport. EPA WAM (Mar
Sector NAT WHITE 10 GOTH SUB 2010 '10)
Minor issue remaining with power. CON_COMB 0.37 0.37
We may have taken more aggressive view DOM 6.09 6.90 5.94
on cement production reduction
IN_BO 1.97 1.71
14.70
Transport is the major revision. 4 changes IN_OC 4.47 3.71
are responsible for the bulk of the
variation. PP 6.7 6.16 7.4
PROC 8.46 8.46
• New AG machinery standard ↘ NOX
• EURO IV/V truck issue ↗ NOX TRA_OT 9.85 9.87 12.4
• Euro 4/5 car issue ↑ NOX
TRA_RD 34.35 35.75 24.8
• LDT UEF change ↑ NOX
Other 1.2
Transport is the topic of the 1st sectoral
focus report. Total 72.23 71.79 66.37Blind SO2 Comparison
2020 White Sum of emissions
Good consistency – industry and EPA WAM (Mar
power balance (~3kt) to be reviewed. Sector NAT WHITE 10 GOTH SUB 2010 '10)
CON_COMB 0.49 0.49
Acknowledged point of oil in power
sector. DOM 5.52 4.64 5.32
IN_BO 1.33 1.14
4.21
Gothenburg submission by IIASA has
taken strict interpretation of IED on IN_OC 5.18 3.78
instruction of Commission. This has
dropped industry and power emissions PP 5.36 3.66 9.37
considerably.
PROC 1.90 1.90
Power is the topic for the 2nd sectoral TRA_OT 0.30 0.30 0.36
focus report.
TRA_RD 0.11 0.11 0.11
Other 1.61
Total 20.18 16.02 20.98Blind VOCs Comparison
Sum of emissions
2020 White
EPA WAM (Mar
Sector NAT WHITE 10 GOTH SUB 2010 '10)
Difficult to contrast due to varied
CON_COMB
methodologies.
FUG & SOL 36.82
DOM 3.11
Also the sources in GAINS are
numerous and would not fit so easily IN_BO
1.02
to such a table.
IN_OC
PP 0.11
Reasonably close aggregate values but
PROC
the potential to update the alternative
parameters in GAINS and cooperate TRA_OT 0.50
with EPA on source estimates will be
taken as part of future sectoral focus TRA_RD 6.19
reports.
Other 5.29
Total 49.60 51.59 53.04Sum of emissions
Blind NH3 Comparison
2020 White EPA WAM (Mar
Sector NAT WHITE 10 GOTH SUB 2010 '10)
AGR_BEEF 54.46 54.46 79.44
There is a sizeable variation between
AGR_COWS 18.7 18.7
the GAINS NH3 emissions and official
projections. AGR_OTANI 3.706 3.706 9.95
AGR_PIGS 4.991 4.991
The reasons for this are mostly well AGR_POULT 2.021 1.717
understood and principally relate to
CON_COMB 0.00 0.00
the following.
COWS_3000 17.15 17.15
DOM 0.14 0.14
• The milk yield adaptation
FCON 17.83 17.83
• Nitrates directive interpretation IN_BO 0.03 0.03
and housing of animals IN_OC 0.05 0.04
OTH 0.57 0.57 5.92
PP 0.09 0.08
With support from Liam and Padraig
PROC
we would hope to develop an Ag
sectoral focus report in time looking at TRA_OT 0.01 0.00
Irish specific topics. TRA_RD 0.40 0.31 0.92
Total 120.14 119.73 96.24Year
Provisional GHG Results Pollutant 2000 2005 2010 2015 2020
Total GHG (Base) 71.08 71.52 67.41 69.11 68.02
There is considerable work ongoing with respect
Total GHG (White) 71.09 71.52 66.90 66.09 63.91
to GHGs at the modelling level with IIASA. The
system is evolving. GHG Target Level 55.59 55.59 55.59 55.59 55.59
ETS Target 17.69 17.69 17.69 17.69 17.69
From our perspective, GHG outputs from the
GAINS Ireland work will be gradually improved as
we work through parameters and methodologies
80.00
with both IIASA and the Agency. This offers
opportunity for useful exchanges.
70.00
For example, emissions have been recently 60.00
updated in our system with process and waste
parameters based on discussions between
50.00
Mtonnes CO2e
ourselves, EPA and IIASA.
Total GHG (B)
40.00
We do not yet have official national data for Total GHG (W)
comparison, but will work with Bernard and co. 30.00 GHG Target Level
once we do. National projections can help guide
our work plan in this regard.
20.00
Split results by ETS/Non‐ETS in our scenario 10.00
reporting template are also available – again the
splitting lines at a subsectoral level require 0.00
further work.
2000 2005 2010 2015 2020Energy
Report
Executive Summary
Report for 2010 Policy
Agriculture
Analysis
Report
Report
FSR in 2009 illustrated the range of content and
material that can be generated from the GAINS
system. FSR
The system is expanding and the potential detail of Control
Effects
outputs will improve as we continue to work with Report
Stategy
the system and incorporate our own peripheral Report
analysis and metrics alongside these outputs..
Emissions
Report
However, generating an FSR entails considerable
work and can limit accessibility of the model outputs.
For 2010 we have simply generated a condensed –
executive summary report.
We had hoped to assess a post Copenhagen scenario
– but instead focus on the new ‘Base’ and ‘White’
scenarios.
Longer term plans are to develop a new more
concise set of output formats for varied audiences,
and to integrate peripheral work on NTMs, MACS,
ESR
Uncertainty, ETS/NON ETS splits into certain versions.
2010NEXT STEPS GAINS Sectoral focus reports ‐ SFR There are individual aspects of the modelling which are best approached individually as mini‐research topics. Number of areas can be improved while still remaining imperfect. Transport and Power first. In essence there are parameters to be changed where we are confident we can make more the model more representative of reality, whilst still uncertain of the precision. For example evidence for agriculture revisions, activity rebalancing etc.
NEXT STEPS GAINS
Expansion potential

Model is expanding and becoming
more complex – we must work to
catch up and then keep pace. SFRs are
the best approach.

Opportunity forthcoming to store
greater detail in the model – not
necessarily emission drivers values,
but rather filter and optimisation
related values.

For example – renewable potentials
for both commercial and private,
detailed process tables, home
appliance characteristics, informative
economic data.

System can become an increasingly
useful hub of information and tool for
analysis. Requires regular maintenance
and use.
Section 3 of 5

POLICY SUPPORT & INTERNATIONAL
GAINS Policy Support
Compliance problems   NOX   NMVOC   SO2   NH3   Total

                                           Austria          1      0      0     0     1

                                          Belgium           1      0      0     0     1

Flexmex Work                              Bulgaria          0      0      0     0     0

                                           Cyprus           0      0      0     0     0

                                       Czech Republic       0      0      0     0     0
Three year average analysis               Denmark           1      1      0     0     2

                                           Estonia          0      0      0     0     0

                                           Finland          0      0      0     1     1

Based on national submissions,             France           1      0      0     0     1

interpolations of years between           Germany           1      1      0     1     3

national inventories and available         Greece           0      0      0     0     0

                                          Hungary           0      0      0     0     0
projections in GAINS Ireland, the          Ireland          1      0      0     0     1
3 year average scheme for the               Italy           0      0      0     0     0

NECD in 2010 would result in the           Latvia           0      0      0     0     0

following outcomes.                       Lithuania         0      0      0     0     0

                                         Luxembourg         1      0      0     0     1

                                           Malta            0      0      1     0     1

5 new cases of non‐compliance. 3         Netherlands        0      0      1     0     1

cases of compliances. Challenge            Poland           0      1      0     0     1

                                          Portugal          0      1      0     0     1
reduced in many more cases
                                          Romania           0      0      0     0     0
though.                                   Slovakia          0      0      0     0     0

                                          Slovenia          1      0      0     0     1

                                            Spain           1      1      0     1     3
Denmark to have the worst of it.           Sweden           1      0      0     0     1

                                       United Kingdom       1      0      0     0     1

                                           EU‐27           11      5      2     3     21
Other International engagements since last SG
Chaired cost‐benefit
session at Swedish
presidency meeting
‘Climate & Air’
Delivered keynote
Contributed article presentation on
on modelling and Flexibilities at
EU research for FP8 TFIAM
Gothenburg paper Delivered
picked up by EU presentation on
policy brief uncertainty to
magazine EC4MACS/NIAM
Coordinated and
planned May TFIAM
meeting in DublinTFIAM Meeting in May Category Value
Venue Pembroke suite, Radisson St. Helen
Ireland hosting TFIAM for the 1st time
Task force on Integrated Assessment
Event
Recognition of increased engagement Modelling
in this group internationally.
Duration 3 days
Will deliver 2 or 3 presentations –
including one on the national IAM
work and capacity building as a strong Attendance Approximately 60
international example.
Specific focus of this meeting is on Start Monday 17th May ~1pm
flexibility, uncertainty and the more
economic aspects of the process.
Finish Wednesday 19th May ~2pm
Also continuing the work of looking
out towards 2050 and the expansion
of modelling capacity to broader
integrated assessment. Tuesday – Joyce Tower / Dinner and
Social Event
reception in Beaufield MewsSection 4 of 5 POLICYMEASURES.COM
Development timeline

                         Open launch in
                         November 2010

                                                Ongoing development
                                                and expansion 2011
Select launch in May
2010                   Content development to
                       October 2010
Section 5 of 5 OCTOBER PLAN
Modelling Progress for October
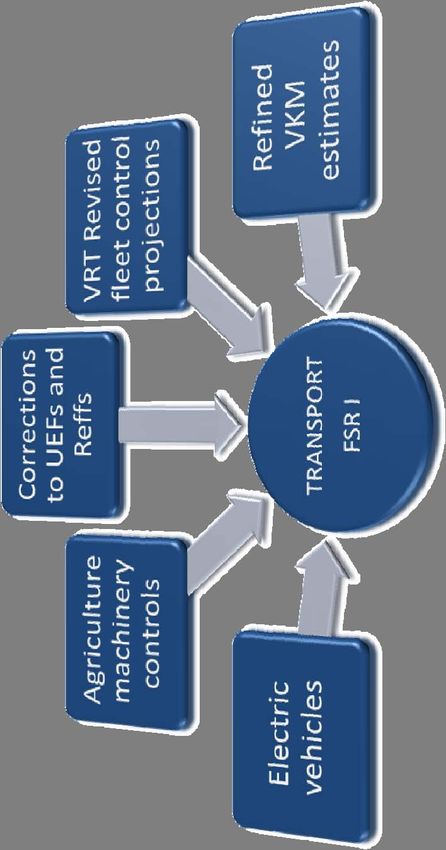
TREMOVE Improvements

•   Improvements from new NCT work
•   Improvements from new CSO data
•   Fleet updates from current paper work
•   Experiment with elasticity
•   GIS link development and refinements
•   Sensitivity analysis and reprogramming

              GAINS Improvements

•   Emission comparison files for AQ
•   Emission comparison files for GHGs
•   Comparisons to guide later SFRs
•   Sectoral focus report – Transport I
•   Sectoral focus report – Power I
•   Review and improve energy splitting system
                                                         Longer term GAINS improvements
•   Refinements to waste and processes
                                                 •   Link to TIMES for controls evidence
• Continue MACS development work
                                                 •   Research appliance characteristics
• Continue Uncertainty presentation work
                                                 •   Review energy efficiency assumptions
                                                 •   Research renewable potentials (Priv/Comm)
                                                 •   Defining new controls e.g. AG
                                                 •   Scenario driven evaluations * Taxes ‐ Amar
Written Outputs for October
Published Papers in Oct
Profiling road transport activity: Emissions from 2000 to 2005 in Ireland using national car test data    Transport Policy

Setting national emission ceilings for air pollutants: policy lessons from an ex‐post evaluation of the
                                                                                                          Env. Sci & Policy
Gothenburg Protocol

Journal Submitted Papers in Oct
Assessment of the impacts of ownership and usage based carbon related taxation on fleet                   Transport Policy
structure, emissions and Welfare (with SEAI?)
Competitiveness and the allocation of allowances in phase 3 of the EU ETS                                 Climate Policy

Presenting uncertainty: A practical approach for the assessment and illustration of uncertainty in        Atmospheric Environment
emissions modelling
A MNL model analysis of car purchase decisions in the republic of Ireland                                 Transportation Research P

Flexibilities – An evaluation of flexible compliance mechanisms for use in conjunction with               Env & Resource
transboundary pollution regulation with Netherlands Environmental Assessment Agency                       Economics

Planned draft Papers in Oct
A framework for the integrated evaluation of NTMs in climate and transboundary air pollution modelling and policy

Innovation and the potential for technology deployment in the Irish ETS sector with Kyoto University

Environmental taxation policy paper

Miscellany Paper – Could focus on smoky coal ban, waste policy, etc.

Transboundary Air Pollution policy – number of potential angles with TFIAM collaborators

Transport paper ‐ number of potential angles likely to draw on NCT and GIS – link with SEAI on a paper
Reports Finalised in Oct
RAINS model overview Climate air and energy report 2009
2020 Ceiling analysis report Climate and Energy report 2010
Disproportionate challenge report Origins of the EU ETS Report
Making GAINS report
Annex I calculator tool Brief
Pathway NOX 2010‐2015 GHG Capacities within GAINS Brief
TREMOVE model overview V1 / V2 GHGs MACC and GAINS Brief
Flexibilities for Ceilings V1 / V2 NOx taxation in Europe Brief
Full Scenario Report 2009 Theory of Pollution Control Brief
Exec Scenario Report 2010 Vehicle weight classification Brief
Environmental Modelling AQ & GHGs ‐ Chapter 2010 Update ‐ NOX 2010‐20 Options Report
Other reports and briefs as work evolvesGuides Finalised in Oct Agricultural Guide Version 1 with IIASA Energy Guide Version 1 with IIASA Control strategies Guide for GAINS TREMOVE Guide Version 2 Harmonisation Report V1 / V2 / V3 Sectoral Focus Report – Transport I Sectoral Focus Report – Power – I Other outputs to date 20 external presentations delivered 15 sets of meeting reports delivered Cover letters, national scenario submissions, and considerable correspondence with IIASA, TFIAM, NIAM, Commission Numerous smaller informal support and assessment reports by request Miscellaneous media/magazine articles
Other IMP Work
• Full launch of site to ‘Public’ in November
• Ongoing updating, management and contribution

• Continue supporting role for Goth Protocol Revision 2020
• Scenario development, review, feedback and negotiation
• Work to develop and include clause for new protocol on Flexmex provision

• Manage a successful TFIAM meeting in Dublin
• Use opportunity to showcase work and strengthen International links
• Presenting on uncertainty, flexibilities and IAM In Ireland

•   Work with EPA to enhance value of GAINS work in parallel with EPA work
•   Specifically projections, scenario development, methodology updates
•   Provide support as requested to Government Departments on relevant work
•   Principally effort sharing and transboundary air pollution
•   Collaborate on a paper with SEAI – Link to TIMES work?
•   3 International collaborations planned – Netherlands, Kyoto, TFIAM
ImpIreland@APEnvEcon.com
You can also read