2021 DISTRICT 17 HUNTING PROSPECTS Pacific and Grays Harbor counties - WDFW
←
→
Page content transcription
If your browser does not render page correctly, please read the page content below
2021
ANTHONY NOVACK, District Wildlife
Biologist
SCOTT HARRIS, Private Lands Biologist
WARREN MICHAELIS, Assistant District
Wildlife Biologist

 DISTRICT 17 HUNTING
 PROSPECTS
 Pacific and Grays Harbor counties

TABLE OF CONTENTS
DISTRICT 17 GENERAL OVERVIEW ................................................................................................................. 2

ELK ........................................................................................................................ Error! Bookmark not defined.

        Summary ....................................................................................................................................................... 4

        General Information, Management Goals, and Population Status .................................................................... 4

        Which GMU Should Elk Hunters Hunt? ......................................................................................................... 5

        What to Expect During the 2020 Season ......................................................................................................... 8

        How To Find Elk ......................................................................................................................................... 10

        Elk Areas ..................................................................................................................................................... 11

        Notable Hunting Changes............................................................................................................................. 11

        ELK HOOF DISEASE (Treponeme bacteria) ............................................................................................... 11

DEER .................................................................................................................................................................. 13

        Summary ..................................................................................................................................................... 13

        General Information, Management Goals, and Population Status .................................................................. 13

        Which GMU Should Deer Hunters Hunt? ..................................................................................................... 14

        What To Expect During The 2020 Season .................................................................................................... 17

        How To Find and Hunt Black-Tails .............................................................................................................. 18

        Notable Hunting Changes............................................................................................................................. 19

BEAR .................................................................................................................................................................. 20

        General Information, Management Goals, and Population Status .................................................................. 20

        What to Expect During the 2020 Season ....................................................................................................... 20

        How To find Black Bear .............................................................................................................................. 21

        Notable Changes .......................................................................................................................................... 22

COUGAR ............................................................................................................................................................ 23

        General Information, Management Goals, and Population Status .................................................................. 23

        what To Expect During The 2020 Season ..................................................................................................... 24

        Notable Changes .......................................................................................................................................... 24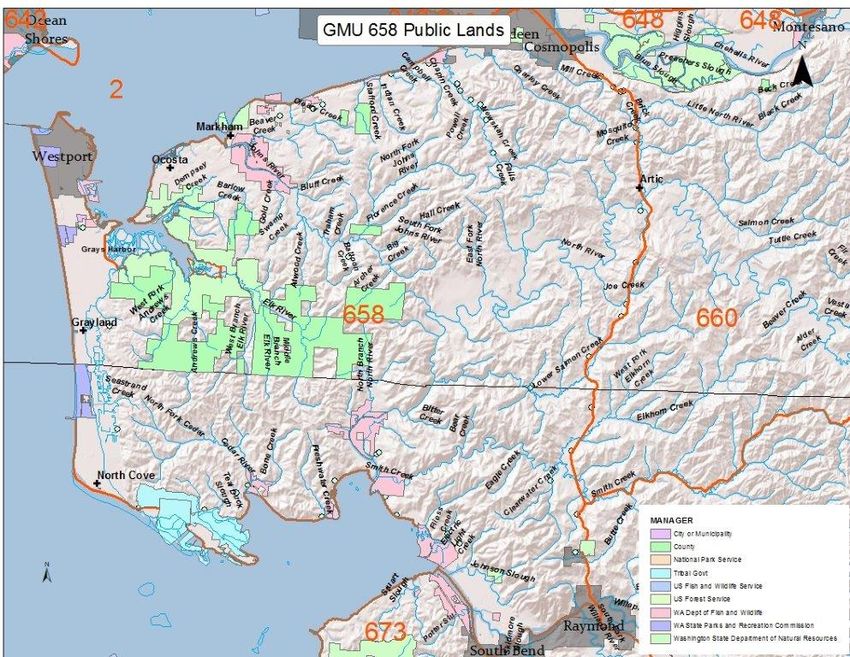
DUCKS ............................................................................................................................................................... 25

       Common Species ......................................................................................................................................... 25

       Migration Chronology.................................................................................................................................. 25

       Concentration Areas..................................................................................................................................... 25

       Population Status ......................................................................................................................................... 26

       Harvest Trends and 2020 Prospects .............................................................................................................. 26

       Hunting Techniques ..................................................................................................................................... 26

       Public Land Opportunities............................................................................................................................ 26

GEESE ................................................................................................................................................................ 27

       Common Species ......................................................................................................................................... 27

       Migration Chronology and Concentration Areas ........................................................................................... 28

       Population Status ......................................................................................................................................... 28

       Harvest Trends and 2020 Prospects .............................................................................................................. 28

       Hunting Techniques ..................................................................................................................................... 29

       Special Regulations...................................................................................................................................... 29

       Public Land Opportunities............................................................................................................................ 30

       Notable Hunting Changes............................................................................................................................. 30

FOREST GROUSE .............................................................................................................................................. 30

       Species and General Habitat Characteristics ................................................................................................. 30

       Population Status ......................................................................................................................................... 31

       Harvest Trends and 2020 Prospects .............................................................................................................. 31

       Hunting Techniques and Where To Hunt ...................................................................................................... 31

PHEASANTS ...................................................................................................................................................... 32

QUAIL ................................................................................................................................................................ 32

TURKEYS ........................................................................................................................................................... 32

BAND-TAILED PIGEONS.................................................................................................................................. 33

       General Description ..................................................................................................................................... 33

       Population Status and Trend ......................................................................................................................... 33
Harvest Trends and 2020 Prospects .............................................................................................................. 33

       Where and How To Hunt Band-Tailed Pigeons............................................................................................. 34

       Special Regulations...................................................................................................................................... 34

       Upcoming Research ..................................................................................................................................... 34

OTHER SMALL GAME SPECIES ...................................................................................................................... 35

MAJOR PUBLIC LANDS ................................................................................................................................... 35

PRIVATE INDUSTRIAL FORESTLANDS ......................................................................................................... 37

       General Information ..................................................................................................................................... 37

       important Notes About Access for the 2020 season ....................................................................................... 37

       Basic Access Rules ...................................................................................................................................... 52

       General Overview of Access Allowed by Major Timber Companies and Non-Profit organizations ................ 52

       Heads Up For Archery and Muzzleloader Hunters ........................................................................................ 53

       General Description of the “Dot” System...................................................................................................... 53

       Contact information For Major Timber Companies ....................................................................................... 54

GENERAL OVERVIEW OF HUNTER ACCESS IN EACH GMU ...................................................................... 54

PRIVATE LANDS ACCESS PROGRAM ............................................................................................................ 58

ONLINE TOOLS AND MAPS............................................................................................................................. 58
DISTRICT 17 GENERAL OVERVIEW
Administratively, District 17 includes all of Pacific and Grays Harbor counties and is one of four
management districts (11, 15, 16, and 17) that collectively comprise the Washington Department
of Fish and Wildlife’s (WDFW) Region 6 (see map). The northern portion of District 17 (north
of Highway 12) includes the southwestern portion of the Olympic Mountains while the southern
part of the district is situated in the Willapa Hills.

District 17 is located in southwest Washington and consists of 12 Game Management Units
(GMUs): 638 (Quinault Ridge), 648 (Wynoochee), 660 (Minot Peak), 672 (Fall River), 681
(Bear River), 699 (Long Island), 618 (Matheny), 642 (Copalis), 658 (North River), 663 (Capital
Peak), 673 (Williams Creek), 684 (Long Beach).

            Four administrative districts and their associated GMUs within WDFW Region 6

2|P a g e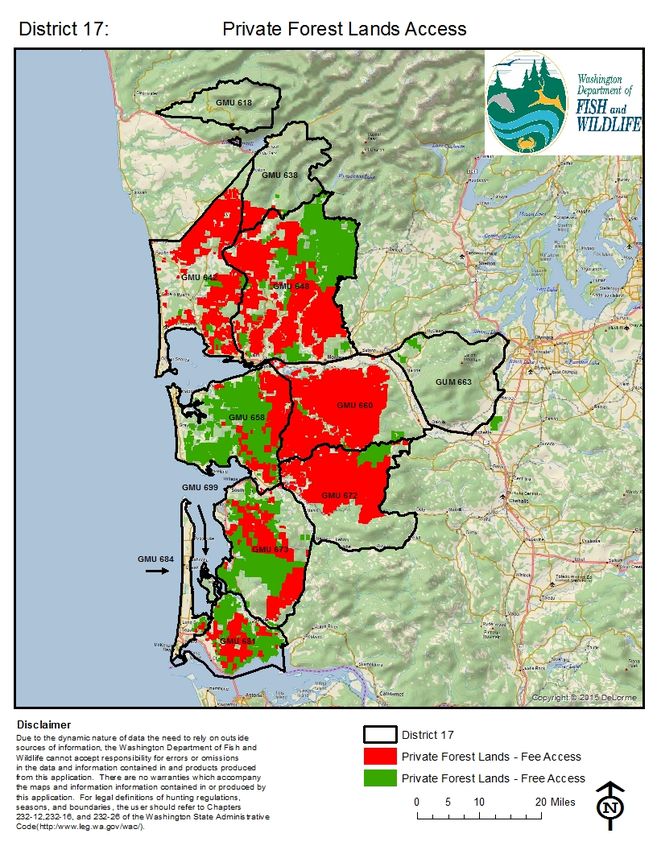
The landscape in District 17 is dominated by intensely managed industrial forest land
characterized by second and third growth forests. These lands are primarily dedicated to
producing conifers such as Douglas fir, western hemlock, and occasionally cedar. A small
number of stands focus production on red alder. Other habitats in the district range from sub-
alpine habitat in areas adjacent to Olympic National Park to coastal wetlands along the outer
coast.

District 17 is best known for elk hunting opportunities in the Willapa Hills and waterfowl
hunting opportunities around Willapa Bay, Grays Harbor, and in the Chehalis and Willapa River
valleys. High quality hunting opportunities exist for other game species, including black-tailed
deer, black bears, and forest grouse. The following table shows the estimated harvest for most
game species in District 17 during the 2015-2020 seasons. For more specific information on
harvest trends, please refer to the appropriate section in this document.

Table 1. Total hunter harvest for selected game species during previous 5 years in District 17.
*Data Unavailable
ᶲ Cougar harvest may include animals from adjacent GMU’s 636 and 651.
ǂ Late season goose not included for 2018-20 due to changes in reporting method
                      Harvest
                      year
                         2020
 Species                            2019            2018          2017          2016
 Elk                     766        748             856           733           717
 Deer                   1,476       1,674           1,542         1,258         1,837
 Bear                    139        202             123           109           73
 Cougar                   8ᶲ        7               14            11            8
 Ducks                  16,864      *               19,715        19,157        15,211
                          ǂ         ǂ               ǂ
 Geese (late                                                                    1,979
 season)                                                          1,372
 Geese (early             190       *               ǂ
 season)                                            309           424           269
 Forest Grouse           4,503      *               3,724         3,700         3,500
 Rabbits                  124       *               35            131           5

3|P a g e
ELK

SUMMARY
Success rates: Ranges widely depending on weapon type, GMU, and land access.
Recent trends: Stable harvest and hunter effort. Protracted decline in modern firearm elk
hunters.
GMUs with highest elk harvest in rank order: GMU 673 then 658. Followed by 660 and 681

GENERAL INFORMATION, MANAGEMENT GOALS, AND POPULATION
STATUS
The subspecies of elk in District 17 are Roosevelt elk. Unlike other areas in western Washington,
Rocky Mountain elk were never introduced into the area and Roosevelt-Rocky Mountain elk
hybrids do not occur. The state of Washington contains 10 distinct elk herds. A portion of two
elk herds occur in District 17:
   •   Olympic elk herd (GMUs 618, 638, 642, and 648)
   •   Willapa Hills elk herd (GMUs 658, 660, 663, 672, 673, 681, 684, and 699).

The quality of elk hunting in District 17 varies from marginal to excellent depending on the
GMU. The greatest harvest opportunities occur in GMUs associated with the Willapa Hills elk
herd area, specifically GMUs 658, 672, 673, and 681.

In Washington, elk are managed at the herd level, while harvest regulations are set at the GMU
level. In general, each herd occupies several GMUs that collectively define the range of a
population that minimizes interchange with adjacent elk populations.

Overall, District 17 is managed with the primary goal of promoting stable or increasing elk
herds. To meet that goal, our specific objective is to maintain herds at a minimum ratio of 15
bulls to 100 cows in the pre-hunting season population and a minimum of 12 bulls to 100 cows
in the post-season population. Portions of the district (such as GMU 684) must balance overall
herd objectives with the equally important mission to minimize conflicts with people. Elk can
cause severe impacts to crops, such as hay or cranberries.

Currently, WDFW does not use formal estimates or indices of population size to monitor elk
populations across the entire district. Trends in harvest, hunter success, and harvest per unit
effort are used as surrogates to formal indices or estimates. These surrogates have limitations
when applied to monitoring trends in population size. Consequently, the agency developed a
more detailed monitoring strategy specifically for the Willapa Hills elk herd to:
   •   Determine elk population trends
   •   Quantify cow to calf ratios
   •   Quantify bull to cow ratios

4|P a g e
Due to limitations imposed by the COVID-19 epidemic, no surveys occurred in the Willapa Hills
in 2021. WDFW previously conducted surveys during March of 2020 in the southern half of the
Willapa Hills Elk herd area in portions of GMUs 506, 530, 673, and 681. WDFW observed
1,524 elk during the survey and the bull to cow ratios averaged 17 bulls per 100 cows. This
17:100 statistic is well above the 12 bulls per 100 cow minimum that WDFW uses to benchmark
breeding success. Calf to cow ratios measured 33 calves per 100 cows. This calf ratio indicates
fair elk production. Mature bulls, carrying antlers with five points or more, were uncommon.

WDFW conducted surveys during March of 2019 in the northern half of the Willapa Hills Elk
herd area, specifically portions of GMUs 658, 660, 672 and 501. WDFW observed 889 elk
during the 2019 survey and the bull to cow ratios averaged 23 bulls per 100 cows. This 23:100
statistic is well above the 12 bulls per 100 cow minimum that WDFW uses to benchmark
breeding success. Calf to cow ratios measured 45 calves per 100 cows. This calf ratio indicates
good elk production. Mature bulls, carrying antlers with five points or more, were uncommon
(

that means there are also very few hunters. Note that many industrial timber companies have
begun limiting access or charging a fee to access their land. This change has effectively, and
sometimes dramatically, reduced the density of hunters on those lands.

The information provided in Tables 2, 3, and 4 provides a general assessment of how District 17
GMUs compare with regard to harvest, hunter numbers, and hunter success during general
modern firearm, archery, and muzzleloader seasons. The values presented are the five-year
averages for each statistic. Total harvest and hunter numbers were further summarized by the
number of elk harvested and hunters per square mile.

Comparing total harvest or hunter numbers is not always a fair comparison since GMUs vary in
size. For example, the average number of elk harvested in a five-year period from 2009-2013
during the general modern firearm season in GMUs 681 and 673 was 36 and 116 elk,
respectively. That total harvest may seem to indicate much higher density of elk in GMU 673
compared to GMU 681. However, examining the number of elk harvested per square mile
(harvested/mi²) provides an estimate of 0.436 harvested/mi2 in GMU 673 and 0.330
harvested/mi2 in GMU 681. Expressed as the number of elk harvested per mile, elk numbers are
probably more similar between the two GMUs than total harvest indicates.

Each GMU was ranked from 1 to 11 for elk harvested/mi2 (bulls and cows), hunters/mi2, and
hunter success rates for the 2009-2013 season. Three ranking values were summed to produce a
final rank sum. GMUs are listed in order of least rank sum to largest. The modern firearm
comparisons are the most straightforward because bag limits and seasons are the same in each
GMU.

Archers should consider that antlerless elk seasons are not uniform across all GMUs. Antlerless
elk may be harvested during the general season in six GMUs, and three GMUs are open during
early and late archery seasons. These differences are important when comparing total harvest or
hunter numbers among GMUs. Muzzleloader seasons are not uniform either. Some muzzleloader
seasons are open during the early muzzleloader season, while others are only available during the
late muzzleloader season. Hunters should keep these differences in mind when interpreting the
information provided in Tables 2 through 4.

6|P a g e
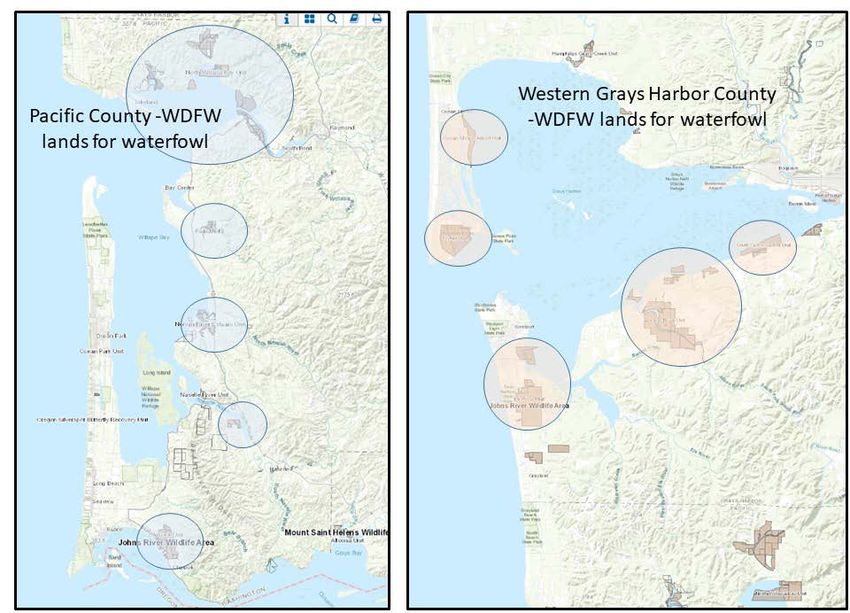
Table 2. Comparison of historic modern firearm general elk season total harvest, hunter numbers, and
hunter success rates using rank sum analysis. Data presented are based on a historic five year running
average (2009-2013).

 MODERN FIREARM
              Harvest                              Hunter Density                 Hunter Success

         Size                   Harvest                        Hunters                              Rank
 GMU     (mi2)         Total    per mi2    Rank    Hunters     per mi2     Rank   Success   Rank    Sum
 684     51            4        0.078      6       30          0.59        3      13%       2       11
 681     109           36       0.330      2       240         2.20        9      15%       1       12
 673     266           116      0.436      1       1011        3.80        10     11%       3       14
 658     257           62       0.241      3       557         2.17        8      11%       4       15
 672     257           34       0.132      4       337         1.31        7      10%       5       16
 660     302           27       0.089      5       290         0.96        5      9%        7       17
 638     153           10       0.065      7       111         0.73        4      10%       6       17
 642     278           6        0.022      9       73          0.26        1      8%        8       18
 663     210           2        0.010      10      64          0.30        2      3%        10      22
 648     431           17       0.039      8       416         0.97        6      4%        9       23

Table 3. Comparison of historic muzzleloader general elk season total harvest, hunter numbers, and
hunter success rates using rank sum analysis. Data presented are based on a historic five-year running
average (2009-2013). GMU 684 is in bold and open during both early and late season for any elk.
* Note: Muzzleloader seasons were recently opened for the 2014 seasons in units 648, 673, 681.

 MUZZLELOADER
                  Harvest                         Hunter Density                  Hunter Success

         Size                Harvest per                     Hunters per                           Rank
 GMU     (mi2)    Total      mi2           Rank   Hunters    mi2           Rank   Success   Rank   Sum
 684     51       14         0.275         1      51         1.00          7      28%       1      9
 642     278      3          0.011         6      20         0.07          2      14%       2      10
 672     257      9          0.035         3      97         0.38          5      9%        3      11
 660     302      10         0.033         4      98         0.32          4      9%        4      12
 658     257      11         0.043         2      184        0.72          6      6%        5      13
 638     153      2          0.013         5      41         0.27          3      6%        6      14
 663     210      1          0.005         7      13         0.06          1      2%        7      15

7|P a g e
Table 4. Comparison of historic archery general elk season total harvest, hunter numbers, and hunter
success rates using rank sum analysis. Data presented are based on an historic five year running
average (2009-2013). GMU 684 is in bold and open during both early and late archery
*GMUs with 3-point minimum or antlerless harvest restrictions
ARCHERY
Harvest Hunter Density Hunter Success
Size Tota Harvest per Hunters per Rank
GMU (mi2) l mi2 Rank Hunters mi2 Rank Success Rank Sum
658 257 16 0.062 5 111 0.43 5 15% 2 12
673* 266 79 0.297 3 488 1.83 8 16% 1 12
699* 8 11 1.375 1 78 9.75 11 14% 3 15
681* 109 53 0.486 2 377 3.46 10 14% 4 16
638 153 5 0.033 9 53 0.35 3 10% 6 18
672* 257 52 0.202 4 483 1.88 9 11% 5 18
684* 51 2 0.039 7 19 0.37 4 9% 8 19
660* 302 12 0.040 6 135 0.45 6 9% 7 19
642 278 2 0.007 10 20 0.07 1 9% 9 20
663 210 1 0.005 11 27 0.13 2 4% 11 24
648 431 16 0.037 8 283 0.66 7 6% 10 25
WHAT TO EXPECT DURING THE 2021 SEASON
Elk populations do not vary much from year to year, especially in District 17, which lacks the
severe winter weather conditions that might result in a winter die-off. Consequently, the number
of elk available for harvest is expected to be similar in size to the 2021 season. Elk harvest
appeared to be higher in 2018 compared to prior years so, a slight decline in elk harvest for 2019
was not unexpected. Hunter numbers do not typically change much from one year to the next,
but recent actions by private timber companies to charge for access have reduced hunter numbers
in those areas affected.
Weather can be dramatically different from year to year and has the potential to influence harvest
rates. As an example, 2012 was a hot and dry summer by western Washington standards, which
produced extreme fire danger warnings and caused many timber companies to close their lands
to public access during the latter part of the general early archery season and the entire early
muzzleloader season. We’ve witnessed record high temperatures in early summer this year so,
conditions could result in extreme fire dangers in Fall of 2021. Since WDFW is not able to
predict long-term weather events, the best predictor of future harvest during general seasons is
recent trends in harvest, hunter numbers, and hunter success.
Below (Figures 1-6) are detailed charts on historic elk harvest for District 17. These figures are
intended to provide hunters with the following information to make an informed decision on
where to hunt.
A. Historic harvest data for the Willapa Hills and Olympic Elk Herd Areas.
B. Hunter participation and success rates for the Willapa Hills and Olympic elk herds.
C. Hunter success rates for Willapa Hills and Olympic elk herds.
8|P a g eAntlerless Bull Total
800
700
600 GMU 684
# of elk harvested
500
400
300
200
100
0
Year
Figure 1. District 17 Willapa Hills Herd area (GMUs 658-699) elk harvest totals. Total bull (blue) and
antlerless (green) elk harvested during general modern firearm, archery, and muzzleloader elk seasons
combined, 2001–2020. Harvest totals do not include tribal harvest.
Antlerless Bull Total
140
120
# of elk harvested
100
80
60
40
20
0
Year
Figure 2. Olympic herd area (GMUs 618, 638, 642, 648), 2001-2020 total elk harvest. *Note: Only
includes elk harvest totals for GMUs inside District 17. Total bull (blue) and antlerless (green) elk
harvested during general modern firearm, archery, and muzzleloader elk seasons combined, 2001–2020.
Totals do not include tribal harvest.
9|P a g eHOW TO FIND ELK
Like most places, when hunting elk in District 17, hunters need to do homework and spend time
scouting before the season opens. Predicting where elk are located is especially difficult after
hunting pressure increases. The majority of hunters spend their time focused on clear cuts. Elk
often forage in clear cuts and are highly visible when they do. Those highly visible elk often
attract other hunters. Consequently, clear cuts can get crowded in a hurry. Many elk (especially
bulls) will infrequently visit clear cuts during daylight hours. Instead, they may spend most of
their day in closed canopy forests, swamps, or regeneration stands.
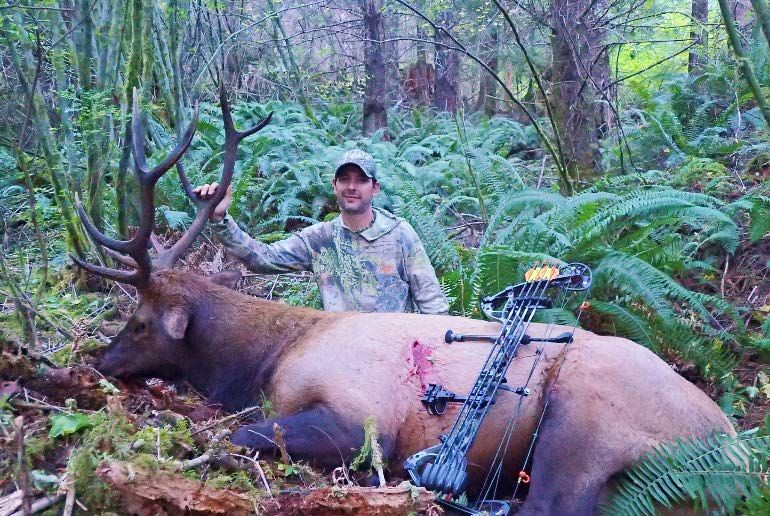
Corey Bronckhorst with elk taken from GMU 673 during the 2016 archery season.
Some generalities can be made about the landscape that will increase the odds of locating elk.
When going to a new area, hunters are encouraged to cover as much ground as possible. Note
areas where you see signs along roads and landings. Landings are often ungraveled, making it
easy to see fresh tracks. Scouting will reveal which areas hold elk and where to focus more
intensive efforts.
After identifying areas with abundant signs of elk, hunters should focus on areas that provide
cover and are adjacent to clear cuts. During early seasons, when it is warm, these cover areas
often include swamps, creek bottoms, river bottoms, or any place near water. Once the season
progresses and temperatures cool, elk are less attracted to water, and locating them becomes
more difficult. Hunting pressure also can force elk to use areas that provide thicker cover or are
more inaccessible to hunters because of topography.
Later in the season, consult a topographic map and find benches located in steep terrain with
thick cover. Elk often use these benches to bed down during the day. Finally, don’t let a locked
gate (provided that non-motorized access is allowed) keep you from going into an area to search
for elk. Frequently, these areas hold elk that have not received much hunting pressure, making
them less skittish and easier to hunt. A popular approach to hunting behind gates is to use
mountain bikes with trailers. Biking on timber company lands is facilitated by high densities of
maintained gravel roads.
10 | P a g eELK AREAS There are two Elk Areas in District 17: Elk Area 6010 (Mallis or Raymond) and Elk Area 6064 (Quinault Valley). Nearly all permit opportunities in District 17 are antlerless elk hunts and are associated with these Elk Areas. Elk Area 6010 was established in a location with chronic elk damage problems, and its primary purpose is to provide antlerless harvest opportunities that help control the growth rate of herds in localized agricultural areas. Elk Area 6064 was established to resolve problems landowners had with elk hunters. Special restrictions apply in each Elk Area. In Elk Area 6064, only Master Hunters are allowed to hunt elk during general modern firearm, archery, and muzzleloader seasons. The purpose of Elk Area 6010 is to alleviate elk damage on private agricultural lands. Elk Area 6010 also contains tracts of public or private timber company lands where elk are not problematic. Hunters that draw a permit in either Elk Area are encouraged to call the Private Lands Biologist (Scott Harris) in the Region 6 Office (360-249-4628 ext.234). Mr. Harris may be able to put you in contact with a landowner currently having problems with elk. NOTABLE HUNTING CHANGES Several private timber companies in District 17 charge a fee to access areas previously open to the public. Property ownership changes irregularly. Hunters should contact landowners in areas they intend to hunt and determine the company’s current policy. See private lands access section for more information. ELK HOOF DISEASE (TREPONEME BACTERIA) Since 2008, reports of elk with deformed, broken, or missing hooves have increased dramatically in southwest Washington, with sporadic observations in other areas west of the Cascade Range, including within the Olympic and Willapa Elk herd areas. While elk are susceptible to many conditions which result in limping or hoof deformities, the prevalence and severity of this new affliction suggested something altogether different. WDFW diagnostic research (2009 – 2014), in conjunction with a panel of scientific advisors, found that these hoof abnormalities were strongly associated with treponeme bacteria, known to cause a hoof disease of cattle, sheep, and goats called digital dermatitis. Although digital dermatitis has affected the livestock industry for decades, Treponeme-Associated Hoof Disease (TAHD) is the first known instance of digital dermatitis in a wild ungulate. The disease is currently concentrated in southwestern Washington where prevalence is highest in Cowlitz, Wahkiakum, and western Lewis County. The disease is also present at lower prevalence in elk herds that are distant and discrete from the core affected area. Hoof disease is found throughout District 17 in both the Olympic and Willapa Hills elk herd areas. TAHD appears to be more prevalent among elk in the Willapa Herd area and southern end of the Olympic Peninsula. 11 | P a g e
While many questions remain about the disease, several aspects of TAHD in elk are clear:

    •   Vulnerability: The disease appears to be highly infectious among elk, but there is no
        evidence that it affects humans. TAHD can affect any hoof in any elk, young or old, male
        or female.

    •   Hooves only: Tests show the disease is limited to animals’ hooves and does not affect
        their meat or organs. If the meat looks normal and if hunters harvest, process and cook it
        practicing good hygiene, it is probably safe to eat.

    •   No treatment: There is no vaccine to prevent the disease, nor are there any proven
        options for treating it in the field. Similar diseases in livestock are treated by cleaning and
        bandaging their hooves and giving them foot baths, but that is not a realistic option for
        free-ranging elk.

How hunters can help:

In 2021, WDFW is implementing an incentive-based pilot program to encourage west-side (400,
500, 600 series GMUs) hunters to harvest limping elk, potentially reducing prevalence of the
disease over time. The objective of this program is to increase the proportion of limping elk in
the total harvest, rather than increase elk harvest overall. General season or permit hunters can
choose to participate in the program by submitting elk hooves at one of the many collection sites
in western Washington. Hunters that submit hooves with signs of TAHD (for example, abnormal
hooves) will be automatically entered into a drawing for a special incentive permit for the
following license year. Multiple bull permits in western Washington with season dates of Sep. 1
– Dec 31 will be awarded. Additionally, all participants will receive a custom, waterproof license
holder.
    •   Harvest a limping elk from any 400, 500, 600 series GMUs

    •   Turn in your elk hooves along with complete registration forms at one of several
        collection sites in western Washington

    •   Report elk: Hunters can help WDFW track TAHD by reporting observations of both
        affected and unaffected elk on the department’s online reporting form.

    •   Clean shoes and tires: Anyone who hikes or drives off-road in a known affected area
        can help minimize the risk of spreading the disease to new areas by removing all mud
        from their shoes and tires before leaving the area.
WDFW is working with scientists, veterinarians, outdoor organizations, tribal governments and
others to better understand and manage TAHD. For more information about TAHD, see
WDFW’s website at https://wdfw.wa.gov/conservation/health/hoof_disease/. Additional
information on TAHD and this incentive program can also be found on page 65 of the Big Game
Hunting Pamphlet.

12 | P a g e
DEER SUMMARY Success rates: Depends on weapon type and GMU hunted. For the entire district, hunter success generally ranges from 15-20%. Recent trends: Observable increase in harvest last year compared to the year prior. GMUs with highest harvest: 660, 663, 672, 648 GENERAL INFORMATION, MANAGEMENT GOALS, AND POPULATION STATUS Columbian black-tailed deer (black-tails or black-tailed deer) are the only species of deer in District 17. Deer hunting opportunities in District 17 range from marginal to very good. The best opportunities to harvest a black-tailed deer in District 17 occur in GMUs 663, 648, 672, and 660. In Washington, black-tail harvest regulations are set at the GMU level. All areas of District 17 are managed with the primary goal Clint Bryson with of promoting stable or increasing deer populations while black-tailed deer taken minimizing conflicts with people. Management objectives include during modern firearm maintaining deer populations to have a minimum of 15 bucks per season of 2016 in GMU 100 does in the post-hunting season population. 648 WDFW does not attempt to survey deer populations to estimate their total numbers in District 17. Trends in harvest, hunter success, and harvest per unit effort are used as surrogates to a formal estimate of population size. WDFW recognizes the limitations of using harvest data to monitor trends in population size, and the agency is currently evaluating new approaches to monitor black-tailed deer populations. Finding an effective way to monitor black-tailed deer populations has been an ongoing management challenge. Black-tailed deer are secretive and use densely vegetated habitats. Their ability to remain unseen substantially lowers the probability of detection through aerial surveys. Aerial surveys have been attempted, but very few deer were seen during those surveys. The small number of deer observed results in insufficient sample sizes to monitor population trends or demographics (buck:doe and fawn:doe ratios). Overall deer harvest declined from an estimated 1,837 deer in 2016 to 1,258 in 2017 then, rose again to 1542 in 2018 and 1,674 in 2019. Last year’s harvest was 1,476 deer. Long-term trends in harvest data seemed to indicate stable deer populations. The seemingly steep decline from 2016 to 2017 is surprising and without an obvious biological cause. For more detailed information on the status of black-tailed deer in Washington, hunters should read through the most recent version of the Game Status and Trends Report. This report is available for download on the Department’s website or by clicking here. 13 | P a g e
ANTLER POINTS AND AGE

Prior to mandatory reporting in 2001, WDFW conducted field checks stations to gather
information of age structure. Hunters have frequently asked if there is a correlation between age
and antler points. During the fall of 1979, tooth samples were collected from bucks harvested in
western Washington and sent in for cementum annuli aging. Of the total of 36 buck deer tooth
samples collected 25 (69%) were spikes and two points. The remaining bucks sampled were at
least three points or better (31%), with four of the three points being 2.5 years old at time of
harvest.

A more accurate assessment of the age of buck deer harvested in Western Washington has
occurred recently. WDFW collected hundreds of tooth samples from successful black-tailed deer
hunters during the 2019 and 2020 season. Reported number of antler points was submitted with
each tooth and samples were sent to a laboratory for analysis of cementum annuli to determine
age. A table of the results is plotted below. Generally, the number of antler points increases with
age. However, a 3-year-old buck may still be a spike and, an 11-year-old buck could be a 2 pt.
while, conversely, a yearling could have 4 points.

 Max Antler Points Average Age – Rounded to                        Total # of
 (1 side)          nearest ½ year                                  Submissions
      1 (Spike)                1 Year                                         65
          2                   3 Years                                       120
          3                   4 Years                                         97
          4                  4 ½ Years                                        65
          5                   5 Years                                         30
          6                   6 Years                                         4
Figure #3 – Average age of black-tailed bucks harvested in Washington state in comparison to the
highest number of reported antler points

WHICH GMU SHOULD DEER HUNTERS HUNT?
“What GMU should I hunt?” is one of the most frequent questions asked of WDFW. Answering
that question is not always easy. The best answer depends on the hunting method and the target
hunting experience. Some hunters are looking for the best chance to harvest a large, mature buck,
while others want to harvest any legal deer or simply be in an area with few hunters.

The ideal GMU for most hunters would have:
    •   High numbers of deer
    •   Low numbers of hunters
    •   High hunter success rates

14 | P a g e
Unfortunately, the perfect scenario does not exist in any GMU that is freely open to the public
during any season within District 17. GMUs with the highest deer numbers tend to have the
highest hunter numbers as well. For many hunters, high hunter densities are not enough to
persuade them to avoid a GMU with many deer. Others prefer to hunt areas with moderate to low
numbers of deer if they can avoid other hunters.
Information in Tables 5-7 assesses GMUs by harvest, hunter numbers, and hunter success during
general modern firearm, archery, and muzzleloader deer seasons. The values presented are the
five-year averages for 2009-2013 for each statistic. Total harvest and hunter numbers are
summarized by the number of deer harvested and hunters per square mile. A comparison of total
harvest or hunter numbers is not always preferred because GMUs vary in size. For example, the
average number of deer harvested over 2009-2013 seasons during the general modern firearm
season in GMUs 663 and 648 was 245 and 266 deer, respectively. Total harvest suggests that
deer densities are quite similar between the two GMUs. However, examining the number of deer
harvested per square mile (harvested/mi2) provides an estimate of 1.167 in GMU 663 and 0.617
in GMU 648. These numbers indicate that deer densities are probably higher in GMU 663 than
in GMU 648.
Each GMU (excluding GMU 618) was ranked from 1 to 11 for deer harvested/mi2, hunters/mi2,
and hunter success rates. The three ranking values were summed to produce a final rank sum.
GMUs are listed in order of lowest rank sum to largest. Comparisons are mostly direct since bag
limits and seasons are the same for most GMUs. Differences that should be considered are:
1. GMU 681 had a 2-point minimum harvest restriction during all general seasons (2009-
2013).
2. GMU 673 had a bag limit of any buck during the general archery season, while all other
GMUs (except 681) had a bag limit of any deer.
15 | P a g eTable 5. Comparison of historic modern firearm general deer season total harvest, hunter numbers, and
hunter success rates using rank sum analysis. Data presented are based on a five-year running average
(2009-2013).
MODERN FIREARM
Harvest Hunter Density Hunter Success
Size Harvest Hunters Rank
GMU (mi2) Total per mi2 Rank Hunters per mi2 Rank Success Rank Sum
684 51 19 0.373 7 56 1.10 3 34% 1 11
642 278 68 0.245 8 276 0.99 2 25% 2 12
660 302 158 0.523 4 746 2.47 6 21% 4 14
672 257 155 0.603 3 715 2.78 8 22% 3 14
673 266 123 0.462 5 579 2.18 5 21% 5 15
663 210 245 1.167 1 1321 6.29 10 19% 6 17
648 431 266 0.617 2 1426 3.31 9 19% 7 18
638 153 13 0.085 10 97 0.63 1 14% 10 21
658 257 116 0.451 6 710 2.76 7 16% 8 21
681 109 25 0.229 9 168 1.54 4 15% 9 22
Table 6. Comparison of historic muzzleloader general deer season total harvest, hunter numbers, and
hunter success rates using rank sum analysis. Data presented are based on a five-year running average
(2009-2013).
MUZZLELOADER
Harvest Hunter Density Hunter Success
Size Harvest Hunters Rank
GMU (mi2) Total per mi2 Rank Hunters per mi2 Rank Success Rank Sum
673 266 41 0.154 1 123 0.46 8 34% 1 10
648 431 4 0.009 6 20 0.05 3 23% 2 11
663 210 8 0.038 3 48 0.23 7 15% 3 13
672 257 3 0.012 5 40 0.16 5 7% 5 15
684 51 3 0.059 2 26 0.51 9 12% 4 15
642 278 1 0.004 8 7 0.03 1 6% 7 16
658 257 4 0.016 4 58 0.23 6 6% 6 16
660 302 2 0.007 7 29 0.10 4 5% 8 19
638 153 0 0.000 9 6 0.04 2 0% 9 20
16 | P a g eTable 7. Comparison of historic archery general deer season total harvest, hunter numbers, and hunter
success rates using rank sum analysis. Data presented are based on a five-year running average (2009-
2013).
ARCHERY
Harvest Hunter Density Hunter Success
Size Harvest Hunters Rank
GMU (mi2) Total per mi2 Rank Hunters per mi2 Rank Success Rank Sum
684 51 9 0.176 3 24 0.47 5 38% 1 9
663 210 90 0.429 1 435 2.07 10 22% 2 13
642 278 12 0.043 8 66 0.24 3 19% 3 14
672 257 60 0.233 2 355 1.38 9 17% 5 16
660 302 34 0.113 5 186 0.62 7 18% 4 16
638 153 3 0.020 9 25 0.16 1 11% 8 18
648 431 39 0.090 6 234 0.54 6 17% 6 18
658 257 5 0.019 10 42 0.16 2 12% 7 19
681 109 8 0.073 7 106 0.97 8 7% 9 24
673 266 4 0.015 11 114 0.43 4 4% 10 25
699 8 1 0.125 4 21 2.63 11 1% 11 26
WHAT TO EXPECT DURING THE 2021 SEASON
Deer populations do not change dramatically between typical years. Winter weather conditions
rarely cause winter die-offs within District 17. Consequently, the total quantity of deer available
for harvest is expected to be similar to previous seasons.
Hunter numbers do not change dramatically between typical years unless hunting regulations are
significantly modified or access is closed. The best predictor of expected general season harvest
is recent trends in:
1. Harvest
2. Hunter numbers
3. Hunter success
The following charts and figures provide trend data for each of these statistics.
17 | P a g eAntlerless Buck Total
3000
2500
# of deer harvested
2000
1500
1000
500
0
Year
Figure 4. District 17 deer harvest totals. Total buck (blue) and antlerless (green) deer harvested during
general modern firearm, archery, and muzzleloader elk seasons combined, 2001–2020. Harvest totals
does not include tribal harvest.
HOW TO FIND AND HUNT BLACK TAILS
The key to harvesting a black-tailed deer in District 17 is scouting. Black tails are present
throughout the district and in nearly every habitat type. Deer numbers differ among habitat types
and the highest deer densities are associated with 3- to 9-year-old clear cuts. These young tree
stands provide large amounts of both cover and food.
Many hunters will focus efforts on new clear cuts. Deer in a clear cut are much more visible than
most other habitats. However, deer know they are exposed and typically visit the clear cuts at
night, early dawn, and dusk. Hunters should also explore areas adjacent to these openings.
18 | P a g eThose areas with cover are more likely to contain deer
for the majority of the day. Large amounts of deer sign
in an area indicate deer are in close vicinity. Consider
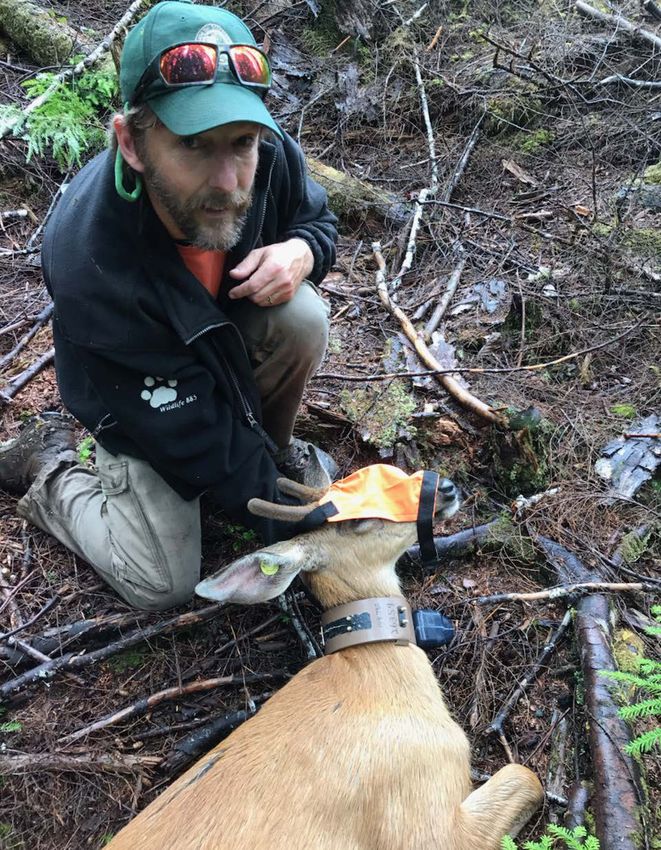
that over the past several years, deer in Capitol Forest
(GMU 663) were fitted with GPS collars as part of a
larger study throughout western Washington conducted
by WDFW. The goal of this study was to better
understand the effects timber management practices
have on deer survival and productivity. These GPS
collars automatically upload the deer’s location via
satellite several times a day. The data gives biologists a
detailed look at black-tailed deer movements and habitat
use.
None of the deer monitored in WDFW’s doe study used
an area larger than 0.38 mi2 (243 acres). The average
home range size was 0.14 mi2 (86 acres). Some deer
Dana Morgan with spike deer taken used an area no bigger than 45 acres in size during an
during the late firearm season in entire year. If a hunter sees signs of deer in an area, but
GMU 663 no deer, they need to be patient or change their
approach.
The traditional approaches to hunting black-tailed deer
include still-hunting or sitting patiently in high use areas (clear cuts, highly traveled trails, or
funnels) until the deer appears. A less well-known, or less-utilized, technique is rattling and
grunting to simulate two bucks fighting over a doe. The rattling technique is more common with
mid-west and eastern white-tailed deer hunters but can be effective on black-tailed deer as well.
A quick internet search on the technique yields plenty of evidence to illustrate its effectiveness
when conditions are right.
Buck movements tend to increase during the rut and, they are less wary than during other parts of
the year. The last week of October and first week of November seem to be those periods of time
when male deer are most susceptible to harvest. Starting in 2017, WDFW initiated a buck
mortality study which will pinpoint the activity periods and survival rates for male black-tail deer
in Western Washington. If you harvest a buck with a collar attached to its neck, please call
WDFW or return the collar to one of our regional offices.
NOTABLE HUNTING CHANGES
Several private timber companies in District 17 are going to fee access programs in areas where
they historically offered free access. Typically, these companies will post signs at primary
roadways but, hunters should be aware of changes. Everyone is advised to contact landowners in
areas where they hunt to determine the individual company’s current policy regarding land
access. See the private lands access section for more information.
19 | P a g eBEAR
GENERAL INFORMATION, MANAGEMENT GOALS, AND POPULATION
STATUS
Black bears are present throughout District 17. Bear numbers vary among GMUs and the harvest
can change noticeably from year to year. The best places to harvest bears usually occurs in
GMUs 648, 660 and 663. Other GMUs worth mentioning are 618, 638, 658, 660, 672, and 681.
Bear seasons are primarily designed to maintain stable black bear populations. Spring seasons
are directed to areas where black bear cause measurable damage to young commercial timber
stands or other sites of human-bear conflict. The existing bear populations are not expected to
have much impact on big game herds. Three statistics used to assess black bear harvest are:
• Proportion of females harvested
• Median age of harvested females
• Median age of harvested males
WDFW initiated surveys in 2019 to estimate bear density in portions of Region 6. The initial
study area was located in the Fall River GMU (672). The resulting estimates are expected to help
the agency formulate management objectives and understand the relationship between the
number of bears in the area with the habitat characteristics and annual harvest rates. For Fall
River, the bear density was estimated at just under 8 bears per 100 square kilometers of bear
habitat in the summer of 2019.
WHAT TO EXPECT DURING THE 2021 SEASON
Most bears are probably harvested opportunistically during general deer and elk seasons.
Overall hunter success is low, but annual harvest can vary widely from year to year and 2019 and
2020 had some of the highest harvest rates for the past 10 years. Depending on the GMU hunted,
between 4 and 15 percent of bear hunters in District 17 were successful in 2019. Since 2001,
overall hunter success for this district has typically ranged from 4 percent to 8 percent. District-
wide, bear hunter success in 2019 was 11%. Hunter success rates are likely higher for those that
specifically hunt bears compared to hunters that take bear incidentally during deer or elk season.
Annual bear harvest in District 17 increased from 2002 to 2008. Harvest declined sharply during
the 2009 season but rebounded in 2010. Bear harvest has since remained generally stable to
increasing, although 2014 was a low year and 2019 was a high year.
20 | P a g e200
Males Females Total
180
160
140
120
100
80
60
40
20
0
2001 2002 2003 2004 2005 2006 2007 2008 2009 2010 2011 2012 2013 2014 2015 2016 2017 2018 2019 2020
Figure 5. Trends in the number of male and female black bears and total number of bears harvested
during the general bear season in District 17, 2001–2020. Harvest estimates include bears harvested
during spring permit seasons. Totals do not include bears removed because of conflicts with people or
timber damage. The sex of harvested bears was not available for 2011.
More bears are typically harvested during the general season in GMUs 648 than any other GMU.
GMU’s 642, 658, 660, 663, 673, and 681 are also regular producers of bears during the general
and spring permit hunting seasons. Overall bear harvest in 2019 and 2020 were above the five-
year average.
HOW TO FIND BLACK BEAR
Black bears are common and occur at high densities in some locales. However, bears in District
17 are seen infrequently because of thick vegetation dominating the landscape. Consequently,
scouting is extremely important when hunting for black bears.
Black bears occupy a variety of habitat types, and it can be difficult to narrow down where to
find them. Because bears have an incredible sense of smell, hunters should focus on open terrain.
When out in the open, a bear can be seen from a distance without alerting it. In dense cover, a
bear is likely to smell a hunter before being seen and move to avoid an encounter. Bears are
often located in clear cuts containing a large number of berry-producing shrubs. Examples
include:
• Elderberries
• Salmonberries
• Huckleberries
• Blackberries
• Salal berries
21 | P a g eDuring the fall, hunters should seek clear cuts with these types of shrubs and search for bear
sign. Fresh signs indicate a bear is visiting that stand. Patient hunters who watch these areas for
extended periods of time can increase their chances of harvesting a bear.
NOTABLE CHANGES
Bear Season starts August 1st across all parts of the state
Bear Photo from GMU 672 survey site
22 | P a g eCOUGAR
GENERAL INFORMATION,
MANAGEMENT GOALS, AND
POPULATION STATUS
Cougars occur throughout District 17,
but densities vary among GMUs.
Cougar populations in District 17 are
managed primarily to maintain a stable
cougar population. Beginning in 2012,
WDFW changed the system for
managing cougar harvest in
Washington. WDFW shifted away from
using season length or permit seasons to
manage the number of cougars
harvested, and implemented a standard
season coupled with harvest guidelines. The intended goal was to allow a longer season without
weapon restrictions. Cougar seasons will close for a specific area once harvest reached or
exceeded a harvest guideline.
To accomplish harvest goals, WDFW established a series of hunt areas with standard season
dates of September 1 through April 30. Harvest numbers are examined starting January 1. Any
hunt area that meets or exceeds the harvest guideline may be closed. Anyone planning to hunt
cougar after January 1 should take a moment to confirm the cougar season is still open. Harvest
guidelines for each hunt area located in District 17 are provided in Table 8.
Starting in 2019, WDFW convened an internal group to assess the results of implementing the
harvest guideline hunting structure.
Table 8. Harvest guidelines and 2016-21 cougar harvest for hunt areas located in District 17.
Harvest 2020-21 2019-20 2018-19 2017-18 2016-17
Hunt Area Guideline Harvest Harvest Harvest Harvest Harvest
618, 636, 1 0 1 4 1
4-5 adults
638
642, 648, 5 4 10 8 5
6-8 adults
651
658, 660,
663, 672, 3 3 3 7 3
673, 681, 8-11
684, 699 adults
23 | P a g eWHAT TO EXPECT DURING THE 2021 SEASON Cougar harvest in District 17 is highly variable. The variability may be due to the prohibition on hound hunting and trapping. Most cougars are taken opportunistically by deer and elk hunters. Since 2001, the average number of cougars harvested in District 17 is six animals. Young animals are overrepresented in the harvest. Most cougar harvest in District 17 has occurred in GMU 642, 648, and 651 NOTABLE CHANGES Subadults will no longer count towards the cougar harvest guideline. Please remember that the season ends April 30, unless closed early. A 2022 tag and license are required after March 31, 2022. 24 | P a g e
DUCKS

COMMON SPECIES
A wide variety of ducks occur in District 17. Common dabbling ducks include northern pintail,
American wigeon, mallard, green-wing teal, and northern shoveler. Species of divers, including
bufflehead, scaup, and common goldeneye are present, but occur in low numbers. Nesting wood
ducks can be located in the Chehalis River Valley early in the season and provide a unique
hunting opportunity. Sea ducks, including scoters and long-tailed ducks, are seen occasionally in
Willapa Bay and Grays Harbor.

Mallards are the most abundant species of duck in Washington. Consequently, mallards
constitute the majority of ducks harvested statewide (typically ≥ 50 percent). In contrast,
American wigeon are the most abundant species of duck in District 17. During recent aerial
survey flights of Willapa Bay, American
wigeon typically comprised 50 percent to
60 percent of the ducks observed. Hunters
should expect to primarily harvest
American wigeon, northern pintail, and
mallard. Green-winged teal are abundant
early in the season but decrease in numbers
as the season progresses.

MIGRATION CHRONOLOGY
Very few ducks are found during late spring
and early summer. Beginning in mid to late
September, birds within the Pacific Flyway
will migrate south from Alaska. (Note -
Banded ducks marked from the Central
Flyway have been harvested along coastal
Washington, indicating that some
movement between flyways does exist).
Duck numbers will continue to increase until peaking in late October and early November. The
migrating ducks are believed to concentrate in District 17 as resting areas. They do not appear to
remain in the district for long periods of time. Consequently, the number of ducks located inside
District 17 likely varies on a daily basis. Total duck numbers decline precipitously once the flow
of migrants from Alaska has stopped. By Christmas, duck numbers are typically 5% of what they
were at the end of October. Unlike eastern Washington, major weather events do not alter
migration chronology in coastal Washington. Regardless of weather events, duck numbers
decline at about the same point in time each year.

CONCENTRATION AREAS
In general, waterfowl concentrations occur in Willapa Bay, Grays Harbor, and the Chehalis and
Willapa River valleys. The exact locations where duck concentrations occur depends on many
factors (hunting pressure, weather, food, etc.) that can change daily.

25 | P a g e
Waterfowl concentrations shift around the bay each winter. Small, forested wetlands also provide
areas where migratory ducks may congregate. In the river valleys after large soaking
precipitation events, dabbling ducks can be found in areas where sheet water has accumulated.
The number of ducks that can use these small bodies of water can be surprisingly high. Hunters
should scout a few days before hunting to locate where concentrations of ducks are currently
located and/or where sheet water is likely to occur.

POPULATION STATUS
Pacific Flyway waterfowl populations have remained strong for several years, allowing liberal
seasons for many species. Breeding duck populations in western Washington were not monitored
until 2010, when WDFW developed and began flying established transects in five select areas of
western Washington. Surveys are flown during April and early May. One of the selected areas
occurs in District 17 and is associated with the Chehalis River Valley.

Surveys did not occur in 2020-21 due to impacts of the coronavirus. In 2019, the breeding
population in the Chehalis River Valley was estimated at 4,130 ducks which, is lower than the
6,841 estimated in 2018. Mallard numbers during the spring breeding flights remained the same
and American wigeon numbers decreased for the second year.

HARVEST TRENDS AND 2021 PROSPECTS
Breeding duck numbers in Alaska are the biggest factor affecting duck hunters in Washington.
Unfortunately, surveys were canceled due to impacts from the coronavirus. Historic harvest can
provide insight into probable hunting opportunity. Overall, harvest trends since 2016 have been
rising slightly and are more similar to the average total number of ducks harvested since 2010.
For instance, the 2016 season was noteworthy for having low numbers of ducks in October.
Harvest, especially for Grays Harbor, again ticked up in 2018 compared to the 2016 season. Last
year, 2020, was an average year for duck hunter harvest.

HUNTING TECHNIQUES
Duck hunting techniques should vary depending on where you choose to hunt. Traditional setups
work best when hunting inland waters around ponds, rivers, or feeding areas. Birds are most
active in early morning and late afternoon, as they move between resting sites and feeding areas.

The tides influence hunting the coastline of Willapa Bay or Grays Harbor. Regardless of the time
of day, ducks along the coastline tend to move very little at either low or high tide. Hunters can
expect very little movement during tidal extremes. However, bird activity and opportunities
increase when the tide is going out or coming in. A perfectly timed tide can provide success to
coastline hunters at 3 p.m., unlike traditional waterfowl hunting areas that are typically limited to
early morning and late afternoon. For more information, see Let’s Go Waterfowl Hunting.

PUBLIC LAND OPPORTUNITIES
There are a number of WDFW Wildlife Areas in District 17 that offer good waterfowl hunting
opportunities. The following map is intended to provide hunters with the general location of
these wildlife areas, but hunters should visit the WDFW waterfowl hunting page (click here) or
the Go Hunt application for more detailed information.

26 | P a g e
You can also read