2020 Growth Trends - Clarington
←
→
Page content transcription
If your browser does not render page correctly, please read the page content below

2020 Growth Trends
Review
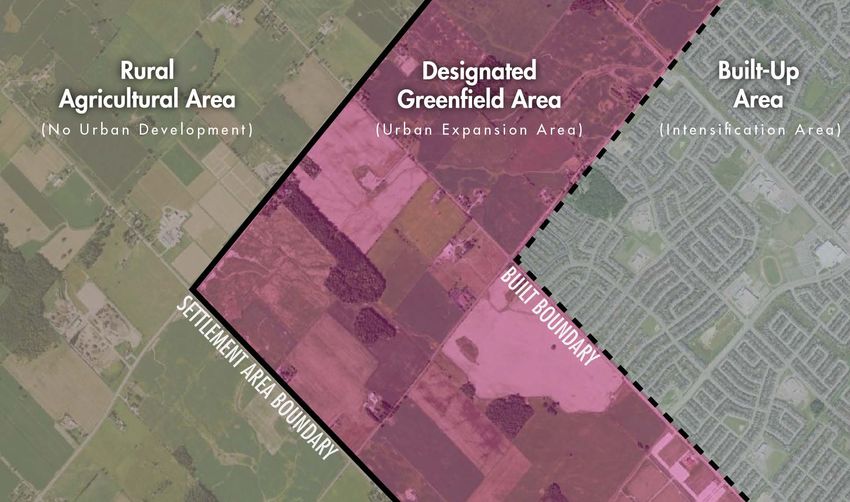
Table of Contents
1.0     Introduction .................................................................................................................................................................................... 1
  1.1      Purpose of the Growth Trends Review ......................................................................................................................................... 1
  1.2      Information Sources ...................................................................................................................................................................... 1
  1.3      Publishing of the Growth Trends Review ...................................................................................................................................... 1
  1.4      Contact Information....................................................................................................................................................................... 1
2.0     COVID-19......................................................................................................................................................................................... 2
  2.1      Introduction ................................................................................................................................................................................... 2
  2.2      Clarington’s Response .................................................................................................................................................................. 2
  2.3      Impact on the Building Industry ..................................................................................................................................................... 3
3.0     Overall Growth Trends .................................................................................................................................................................. 4
  3.1      Total Building Permit Value in Clarington...................................................................................................................................... 4
  3.2      Total Building Permit Value in Durham ......................................................................................................................................... 5
  3.3      Clarington Share of Durham Total Building Permit Value ............................................................................................................. 6
  3.4      Policy Updates .............................................................................................................................................................................. 6
4.0     Residential Growth ........................................................................................................................................................................ 8
  4.1      Total Residential Building Permit Value in Clarington ................................................................................................................... 8
  4.2      Residential Unit Production........................................................................................................................................................... 8
  4.3      Built Boundary ............................................................................................................................................................................ 11
  4.4      Servicing Updates ....................................................................................................................................................................... 13
  4.5      Impacts of COVID-19 on the Housing Market ............................................................................................................................. 14
      4.5.1      National Economy ................................................................................................................................................................ 14
      4.5.2      National and Provincial Housing Market............................................................................................................................... 14
      4.5.3      Greater Toronto Area ........................................................................................................................................................... 15
      4.5.4      Durham Region .................................................................................................................................................................... 15
      4.5.5      Clarington ............................................................................................................................................................................. 16
                                                                                                                                                                                                           ii
4.6      Short-Term Population Forecast ................................................................................................................................................. 18
   4.7      Planning for Intensification .......................................................................................................................................................... 19
5.0      Non-Residential Growth .............................................................................................................................................................. 22
   5.1      Total Non-Residential Building Permit Value in Clarington ......................................................................................................... 22
6.0      Clarington’s Share of Durham Building Activity ....................................................................................................................... 24
   6.1      Share of Residential Building Permit Value ................................................................................................................................ 24
   6.2      Share of New Residential Unit Permits ....................................................................................................................................... 24
   6.3      Share of Non-Residential Building Permit Value ......................................................................................................................... 25
   6.4      Non-Residential Floor Space Production in Durham................................................................................................................... 26
7.0      Key Projects and Initiatives......................................................................................................................................................... 27
   7.1      Climate Change .......................................................................................................................................................................... 27
   7.2      Zoning By-Law Review ............................................................................................................................................................... 28
   7.3      Secondary Plans ......................................................................................................................................................................... 29
   7.4      Affordable Housing ..................................................................................................................................................................... 31
8.0      Summary and Short-Term Outlook............................................................................................................................................. 32
   8.1      Residential Building Activity ........................................................................................................................................................ 32
   8.2      Non-Residential Building Activity ................................................................................................................................................ 32
   8.3      Short-Term Outlook .................................................................................................................................................................... 33
References.............................................................................................................................................................................................. 35

                                                                                                                                                                                                        iii
List of Figures
Figure 1: Total building permit value in Clarington, 2010-20. ..................................................................................................................... 4
Figure 2: Proportion of residential to non-residential building permit value, 2010-20. ................................................................................ 5
Figure 3: Durham total building permit value, 2010-20. ............................................................................................................................. 5
Figure 4: Clarington share of Durham total building permit value, 2010-20. .............................................................................................. 6
Figure 5: Clarington residential building permit value, 2010-20. ................................................................................................................ 8
Figure 6: Clarington new residential unit permits issued, 2010-20. ............................................................................................................ 8
Figure 7: New residential unit permits by type, 2010-20. ......................................................................................................................... 10
Figure 8: Map of building permits within and outside of the built boundary, 2020. ................................................................................... 12
Figure 9: Percentage of new residential building permits within or outside the built boundary, 2016-20. ................................................ 13
Figure 10: Canadian building permit value, 2016-20................................................................................................................................ 14
Figure 11: Ontario building permit value, 2016-20. .................................................................................................................................. 15
Figure 12: Average cost of a new single detached dwelling among the Durham Lakeshore municipalities, 2010-20. ............................. 16
Figure 13: Average house price in Clarington by type, 2010-20. ............................................................................................................. 16
Figure 14: Map Clarington within the Greater Golden Horseshoe............................................................................................................ 20
Figure 15: Conceptual illustration of the built-up, greenfield and rural area boundaries and intensification targets. ................................ 21
Figure 16: Total and by type non-residential building permit value, 2010-20. .......................................................................................... 22
Figure 17: Non-residential building permit value proportion by type, 2010-20. ........................................................................................ 22
Figure 18: Proportion of residential building permit value in Durham, 2020. ............................................................................................ 24
Figure 19: Proportion of new residential units issued in Durham, 2020. .................................................................................................. 25
Figure 20: Proportion of non-residential building permit value in Durham, 2020. ..................................................................................... 25
Figure 21: Durham Lakeshore municipalities non-residential floor space production, 2016-20. .............................................................. 26
Figure 22: Map of Secondary Plan areas, 2020. ...................................................................................................................................... 30
Figure 23: Development applications breakdown, 2020. ......................................................................................................................... 33

                                                                                                                                                                                     iv
List of Tables
Table 1: Five-year average of proportion of residential to non-residential building permit value compared to 2020 proportion. ................ 5
Table 2: Durham residential and non-residential building permit value, 2019-2020. .................................................................................. 6
Table 3: Residential unit permits issued by area in Clarington, 2016-20. .................................................................................................. 9
Table 4: Residential unit permits issues in Clarington by type, 2010-20. ................................................................................................. 11
Table 5: Summary of new residential building permits within and outside the built boundary of Clarington by area, 2020. ..................... 11
Table 6: Clarington average house prices by type and location, 2016-20................................................................................................ 17
Table 7: Clarington and Durham population estimates and forecasts, 2016-24. ...................................................................................... 18
Table 8: Clarington and Durham household estimates and forecasts, 2016-24. ...................................................................................... 18
Table 9: List of non-residential building permits issued in 2020 valued at over a million dollars. ............................................................. 23
Table 10: Total residential building permit value in Durham, 2016-20 ..................................................................................................... 24
Table 11: New residential unit permits issued in Durham, 2016-20. ........................................................................................................ 25
Table 12: Non-residential building permit value (millions) by sector in Durham, 2019-20. ....................................................................... 26

                                                                                                                                                                           v
the Planning and Development Services Department directly or
1.0 Introduction                                                      can be accessed online by visiting here.
1.1    Purpose of the Growth Trends Review                            If this information is required in an alternate format, please
The Planning and Development Services Department conducts             contact the Accessibility Coordinator at 905-623-3379 ext. 2131.
on-going monitoring to assess the effectiveness of the
Municipality of Clarington Official Plan policies, as well as other   1.4   Contact Information
Municipal and Durham Region policies. The Growth Trends               Should you have any questions, comments, and/or suggestions
Review reports on these monitoring activities to identify             concerning the Growth Trends Review, please contact the
emerging development-related issues and trends within the             Planning and Development Services Department by telephone
Municipality of Clarington. Building permit activity and other        at 905-623-3379 ext. 2401 or by email at
related data are used as indicators of housing and employment         planning@clarington.net.
activity within Clarington, the level of local investment, and
economic performance.

1.2    Information Sources
The data collected and analyzed in this report is based on
building permit and housing market information gathered from a
variety of sources that include:

   •   The Bank of Canada
   •   Canada Mortgage and Housing Corporation
   •   Toronto Regional Real Estate Board
   •   Statistics Canada
   •   Region of Durham
   •   Municipality of Clarington
Unless otherwise noted, data in this report regarding the
Municipality of Clarington is from the Building Activity Update
and data regarding the Region of Durham is from the 2020
Annual Building Activity Review.

1.3    Publishing of the Growth Trends Review
The Planning and Development Services Department has
published the Growth Trends Review on an annual basis since
2005. The most recent Growth Trends Review is available from
                                                                                                                                     1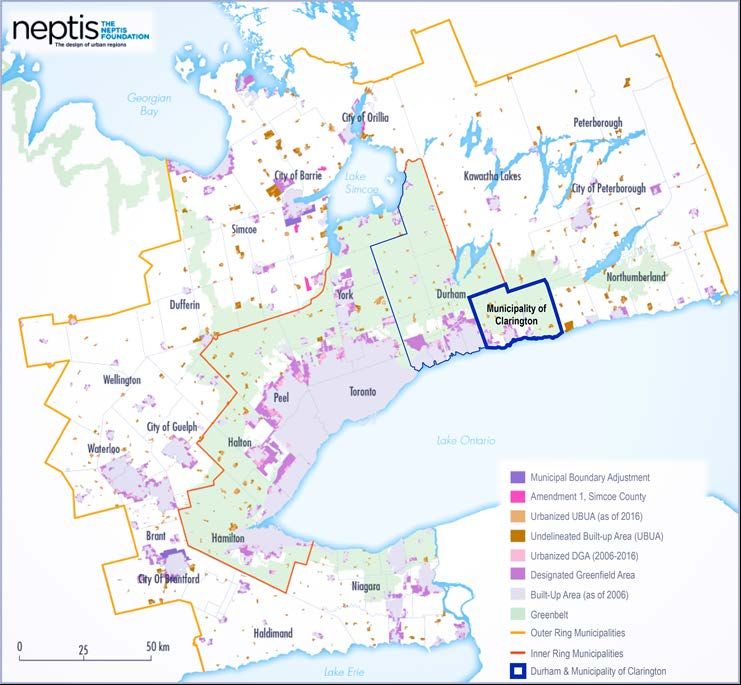
service provision. Existing applications and on-going projects
2.0 COVID-19                                                                         were continued, and new applications and review of building
2.1       Introduction                                                               permits were accepted through both physical and electronic
The COVID-19 pandemic has had unprecedented impacts on                               means. Statutory public meetings, Committee of Adjustment,
public health and caused widespread social and economic                              and Council Advisory Committee meetings were completed
disruption. COVID-19 has brought many challenges to                                  virtually, and all materials were made available online. Building
Canadians, and the Municipality of Clarington has been                               and site inspections continued during regular hours, with the
dedicated to providing on-going assistance to ensure the health                      exception of occupied dwellings, where Facetime, video and
and safety of the community. Furthermore, the pandemic                               photos were used. Despite the disruption of COVID-19, the
brought uncertainty to the building industry and Clarington has                      Planning and Development Services Department continued
worked to provide continuous operations and public services.                         work on the zoning by-law review, secondary plans and
                                                                                     coordination with outside agencies, conservation authorities and
2.2       Clarington’s Response                                                      the Region of Durham.
At the onset of the pandemic Clarington acted quickly to ensure
the health and safety of staff and residents. Municipal facilities
were closed to the public, and the majority of staff began to
work from home. In conjunction with federal and provincial
efforts, Clarington provided financial assistance to struggling
residents and businesses. As part of a comprehensive COVID-
19 relief package, Clarington council approved three separate
financial support programs:

      •   The Property Tax Deferral Program to assist property
          owners by deferring interim tax instalments.
      •   A Monthly Pre-Authorized Payment (PAP) plan to
          allow property owners to spread their taxes over equal
          monthly payments.
      •   The COVID-19 Community Improvement Plan to                                 A Clarington Public Health safety notice reminding residents to
          provide local businesses funding to make physical                          maintain a safe physical distance of 2 metres. 1
          modifications for safety measures.
Clarington’s Planning and Development Services Department
put business continuity measures in place to ensure continuous

1   O’Meara, J. (2021). This rural area has Clarington’s highest number of COVID-19 cases. Clarington This Week.
                                                                                                                                                       2
2.3     Impact on the Building Industry
                                                                                  The initial impact of COVID-19 caused uncertainty within the
                                                                                  building industry. Public health measures in March and April of
                                                                                  2020 temporarily shut down large amounts of economic activity,
                                                                                  including construction and related industries. This caused an
                                                                                  immediate drop in housing sales and starts. Initial forecasts
                                                                                  projected the Canadian housing market would begin to recover
                                                                                  in mid-2021 and reach pre-COVID-19 levels by the end of
                                                                                  2022. 3
                                                                                  Despite the uncertainty, the housing market performed well,
Opened on March 9, 2021, the Garnet B. Rickard Recreation                         especially in the Greater Toronto Area (GTA). While national
Complex vaccine clinic became one of the first mass                               trends saw a decline in building permit value in March and April,
vaccination sites in Durham Region. 2                                             Ontario did not experience the same pattern. Demand increased
                                                                                  and the GTA saw record sales in the Fall months balancing out
                                                                                  the initial spring disruption. COVID-19 changed consumer
                                                                                  behavior, as it accelerated the movement of households away
                                                                                  from urban centres and increased the demand for larger single
                                                                                  detached housing. 4
                                                                                  Although the real-estate market was healthy, housing trends
                                                                                  were affected by the uneven economic impacts of the
                                                                                  pandemic. Higher income households with the ability to adapt to
                                                                                  working from home adjusted well to the pandemic and were
                                                                                  active in the housing market, while families dependent on
                                                                                  pandemic affected industries struggled. As a result, the rental
Clarington continues to work with the Region of Durham and                        market took a hit, which was exacerbated by the reduced
Ontario government to provide COVID-19 information and                            student and immigrant demand. 5
updates. Visit our financial support webpage for information
                                                                                  A more detailed analysis of COVID-19’s impacts on the building
regarding Clarington’s support programs.
                                                                                  industry is provided in Section 4.5.

2 Rosen, B. (2021). Coronavirus: Durham announces vaccine rollout plan with goal of 10K doses administered per day. Global News.
3 CMHC. (2020). Housing Market Outlook – Special Edition – Spring 2020.
4 CMHC. (2021). Housing Market Outlook – Spring 2021.
5 CMHC. (2021). Housing Market Outlook – Spring 2021.

                                                                                                                                                 3
to extra housing supply. However, the market began to recover
3.0 Overall Growth Trends                                                                                                  in late 2019 and this continued into early 2020. As a result of the
3.1                                     Total Building Permit Value in Clarington                                          emergency order in March of 2020, construction was
Clarington’s total building permit value increased by 205.7 per                                                            temporarily put on hold, but permit activity still continued strong.
cent from $130,323,054 in 2019 to $398,366,432 in 2020. Total                                                              Housing demand increased, and the GTA saw record sales in
building permit value in Clarington from 2010-20 can be seen in                                                            the Fall months. 6 COVID-19 accelerated already existing trends
Figure 1. The five-year moving average is one of the best                                                                  of households moving away from city centres and into
indicators of general growth trends. Figure 1 shows the average                                                            surrounding suburban areas. 7 Consumers sought larger homes
total building permit value has been growing over the last five                                                            for more space to work from home, driving price growth in the
years, recovering in 2020 after a major decline in 2019.                                                                   single detached segment. 8

                                       $450                                                                                Overall, building permit values reflect fluctuations in both the
    Building Permit Value (Millions)

                                       $400                                                                                economy and one-time projects. Major building projects in the
                                       $350                                                                                non-residential sector cause significant fluctuation in building
                                       $300                                                                                permit values from year-to-year. Section 5.1 highlights major
                                                                                                                           non-residential building projects reported in 2020, these are
                                       $250

                                                                                                      $423
                                                                                                                           examples of projects that cause yearly fluctuations. It should be

                                                                                                                    $398
                                                                                               $380
                                                                                 $362

                                       $200
                                                                                        $341
                                                     $327

                                                                                                                           noted that building permit fees increase by three per cent each
                                                                          $291
                                                            $290

                                       $150
                                                                                                                           year, effective on the first day of January, causing a minor
                                              $203

                                                                   $187

                                       $100                                                                  $130          increase in annual building permit value. Furthermore, change
                                       $50
                                                                                                                           in the scope of permits and cancellations will result in minor
                                        $0
                                                                                                                           discrepancies in total permit value from year-to-year.
                                              2010

                                                     2011

                                                            2012

                                                                   2013

                                                                          2014

                                                                                 2015

                                                                                        2016

                                                                                               2017

                                                                                                      2018

                                                                                                             2019

                                                                                                                    2020

                                                               5 Year Moving Average
                                                                                                                                      Clarington’s total building
Figure 1: Total building permit value in Clarington, 2010-20.                                                                         permit value increased by
Despite the disruption due to COVID-19, building permit value                                                                               205.7 per cent
rebounded substantially from the dip in 2019. The real estate
market fell in 2019 due to a number of factors, most notably new
Building Code requirements and stricter mortgages tests leading

6 Toronto Regional Real Estate Board. (2020). Market Watch – September 2020.
7 CMHC. (2021). Housing Market Outlook – Spring 2021.
8 CMHC. (2021). Housing Market Outlook – Spring 2021.

                                                                                                                                                                                             4
The proportion of residential to non-residential building permit where it can be seen that 2020 saw the highest building permit
value can be seen in Figure 2. The proportion of residential value since 2010, amounting to an all-time high.
building permit value was slightly below the five-year average
Consistent with the Clarington trends, COVID-19 had little
from 2016-20, however, these proportions are susceptible to
impact on the total building permit value in Durham. The small
large fluctuations reflecting year-to-year changes.
decline in 2019 was met with substantial growth in 2020, as the
Table 1: Five-year average of proportion of residential to non- demand for housing in Durham continued.
residential building permit value compared to 2020 proportion.
$3,000
Building Permit Value (Millions)
Residential Non-Residential
5 Year Average 81.5 % 18.5 % $2,500
2020 76 % 24 % $2,000
$2,868
$1,500
2020 $304,665,970
$2,059
$1,974
$1,961
2019 $89,729,141
$1,630
$1,000
$1,526
$1,524
$1,485
$1,460
$1,391
$1,300
2018 $343,472,347
2017 $330,300,324 $500
2016 $320,328,005
2015 $291,322,557 $0
2010
2011
2012
2013
2014
2015
2016
2017
2018
2019
2020
2014 $217,649,678
2013 $119,417,902
2012 $163,432,307 5 Year Moving Average
2011 $237,405,670
2010 $154,857,538 Figure 3: Durham total building permit value, 2010-20.
0% 20% 40% 60% 80% 100% Residential building permit value across Durham Region
Non-Residential Residential accounted for 63.3 per cent while non-residential accounted for
36.7 per cent. As shown in Table 2, both residential and non-
Figure 2: Proportion of residential to non-residential building residential building permit value increased substantially in 2020
permit value, 2010-20. from 2019, increasing by 69 and 17 per cent, respectively.
3.2 Total Building Permit Value in Durham
Durham Region saw a large spike in total building permit value
in 2020, increasing by 45.3 per cent from $ 1.974 billion in 2019
to $2.868 billion in 2020. This growth is illustrated in Figure 3,
5Table 2: Durham residential and non-residential building permit 3.4 Policy Updates
value, 2019-2020. 2020 saw provincial policy updates, while work continued on
revamping regional and municipal land use planning. These
Residential Non-Residential
changes will impact the development process and how the
2019 $1,075,000,000 $1,816,500,000
Clarington provides facilities and services for new development.
2020 $899,300,000 $1,051,900,000
On a provincial level, Bill 197 was passed in response to
3.3 Clarington Share of Durham Total Building COVID-19, the new Provincial Policy Statement (PPS) was
Permit Value released and A Place to Grow: Growth Plan for the Greater
Clarington accounted for 13.9 per cent of the total building Golden Horseshoe, was updated.
permit value in Durham, an increase from 6.6 per cent in 2019. In response to the COVID-19 pandemic, the Ontario
Clarington’s share experiences year-to-year fluctuations, as government passed Bill 197 which received Royal Assent in
seen in Figure 4. These fluctuations are expected due to large July 2020. The Bill made sweeping changes to several statutes,
one-time projects in the remaining municipalities, and having an immediate impact on planning legislation. The most
Clarington’s share illustrates general stability. notable changes were made to the Development Charges Act,
Planning Act, and Environmental Assessment Act. The Bill
25%
Clarington Share of Durham
expanded the list of services municipalities can apply
Building Permit Value
20% development charges to under the Development Charges Act,
while prohibiting municipalities from applying development
15% charges where community benefits charges are already in
place. Amendments to the Planning Act rolled back many of the
10% changes proposed in 2019, while prohibiting community benefits
charges on smaller scale developments. The Environmental
5%
Assessment Act saw major changes including a new class of
projects that can undergo a streamlined environmental
0%
assessment.
2010
2011
2012
2013
2014
2015
2016
2017
2018
2019
2020
The new PPS, which took effect in May 2020, includes several
5 Year Moving Average additions seeking to promote flexible and diverse land
development, while planning to mitigate the effects of climate
Figure 4: Clarington share of Durham total building permit value, change. The new PPS permits municipalities to conditionally
2010-20. adjust the settlement area boundaries outside of a
comprehensive review. Manufacturing, industrial and economic
areas are offered additional protections in order to facilitate
6stronger economic growth. The new PPS seeks to create more
housing options through incentivizing the development of a
variety of housing types and tenures, while promoting residential
intensification in areas already developed.
The latest version of A Place to Grow: Growth Plan for the
Greater Golden Horseshoe, took effect in August 2020. This
version included changes to the population and employment
forecasts and included policies to increase housing supply,
create jobs, attract businesses and encourage transit-oriented
development.
On a regional level, the Region of Durham continued to work on,
Envision Durham, a Municipal Comprehensive Review of the
Durham Region Official Plan. The review, which was launched
in 2019, seeks to create a land use planning vision for the
Region until 2051, outlining policies for growth, housing and job
opportunities, resource and environmental protection, and
transportation. The review is currently projected to be completed
in 2022.
Locally, the current Clarington Official Plan was adopted by
Council in 2016 and approved by the Region of Durham in
2017. Since then, staff have been working on implementing the
adopted plan through new and updated secondary plans. These
plans are detailed land use and policy frameworks for specific
geographic areas. They implement the policies of the Official
Plan at a neighbourhood level and provide more specific
direction than the general designations of the Official Plan.
74.0 Residential Growth 4.2 Residential Unit Production
In 2020, Clarington approved 994 new residential units, an
4.1 Total Residential Building Permit Value in increase of 250 per cent from 284 in 2019. Only twice since
Clarington 1993 has a higher number of residential units been approved, in
From 2013 to 2018, Clarington saw steady growth in residential 2004 and 2016. Clarington’s new residential permits per year
building permit value, which halted with a drastic dip in 2019. since 2010, can be seen in Figure 6.
This decline was a result of compounding factors, most notably
new requirements in the Building Code and mortgage tests and
Number of Building Permits Issued
was consistent with market trends. Growth rebounded in 2020, 1000
as residential building permit value increased from $89,729,141
800
in 2019 to $304,665,970 in 2020. Residential building permit
value in Clarington from 2010-20 can be seen below in Figure 5. 600
$400 863 931 995 972 994
400 809
Residential Building Permit Value
$350 593 657
537
200 439
$300 284
$250 0
(Millions)
2010
2011
2012
2013
2014
2015
2016
2017
2018
2019
2020
$200
$343
$330
$320
$305
$291
$150
$237
$218
5 Year Moving Average
$163
$100
$155
$119
$90
$50 Figure 6: Clarington new residential unit permits issued, 2010-
$0 20.
2010
2011
2012
2013
2014
2015
2016
2017
2018
2019
2020
The majority of new permits approved were within Bowmanville,
5 Year Moving Average with 78 per cent, while the other urban areas of Newcastle and
Courtice saw the next largest share with 16.6 and 3.2 per cent,
respectively. There were 22 rural residential permits issued,
Figure 5: Clarington residential building permit value, 2010-20.
slightly below the previous decades average of 29. The bulk of
the rural permits were in the rural area outside of the hamlets,
consistent with previous years trends. A complete breakdown of
the new residential units by geographic area can be seen in
Table 3. It should be noted that residential permits contain all
8permits pertaining to residential activity, including decks and be within Clarington’s three lakeshore urban areas of
accessories etc., hence the discrepancy between residential Bowmanville, Courtice and Newcastle. This trend is expected to
unit permits (994) and residential permits (1011). continue, enabling the urban areas of Clarington to gradually
increase in population. 9
This building pattern is consistent with objectives in Clarington’s
Official Plan, which directs the majority of urban development to
Table 3: Residential permits issued by area in Clarington, 2016-20.
2016 2017 2018 2019 2020
Units % Share Units % Share Units % Share Units % Share Units % Share
Bowmanville 521 52.4% 589 60.5% 724 89.4% 184 63.7% 789 78.0%
Courtice 294 29.5% 112 11.5% 14 1.7% 12 4.2% 32 3.2%
Newcastle 149 15.0% 227 23.3% 42 5.2% 67 23.2% 168 16.6%
Wilmot Creek 0 0.0% 0 0.0% 0 0.0% 0 0.0% 0 0.0%
Orono 0 0.0% 0 0.0% 1 0.1% 1 0.3% 0 0.0%
Darlington 7 0.7% 13 1.3% 11 1.4% 10 3.5% 10 1.0%
Clarke 15 1.5% 11 1.1% 6 0.7% 6 2.1% 6 0.6%
Burketon 0 0.0% 0 0.0% 0 0.0% 0 0.0% 0 0.0%
Enfield 0 0.0% 0 0.0% 0 0.0% 0 0.0% 0 0.0%
Enniskillen 2 0.2% 15 1.5% 4 0.5% 4 1.4% 1 0.1%
Hampton 1 0.1% 2 0.2% 0 0.0% 1 0.3% 0 0.0%
Haydon 0 0.0% 0 0.0% 0 0.0% 0 0.0% 0 0.0%
Kendal 0 0.0% 0 0.0% 0 0.0% 1 0.3% 1 0.1%
Kirby 0 0.0% 0 0.0% 0 0.0% 0 0.0% 0 0.0%
Leskard 0 0.0% 0 0.0% 0 0.0% 0 0.0% 0 0.0%
Maple Grove 0 0.0% 0 0.0% 0 0.0% 0 0.0% 0 0.0%
Mitchell Corners 0 0.0% 2 0.2% 0 0.0% 0 0.0% 0 0.0%
Newtonville 3 0.3% 0 0.0% 5 0.6% 3 1.0% 3 0.3%
Solina 3 0.3% 2 0.2% 2 0.2% 0 0.0% 1 0.1%
Tyrone 0 0.0% 0 0.0% 1 0.1% 0 0.0% 0 0.0%
Total 995 100.0% 973 100.0% 810 100% 289 100% 1011 100%
9 Municipality of Clarington. (2018). Municipality of Clarington Official Plan – “Chapter 4: Managing our Growth”.
92020 saw a similar housing mix to 2019, with a relatively lower and Municipal policy has shifted towards encouraging higher
single detached and higher townhouse proportion compared to density housing in already developed areas.
previous years’ trends. Apartment development continued at a
strong pace. Single detached and townhouses each accounted
for approximately one third of all the new units. The new unit
permit proportion by type since 2010 can be seen below in
Figure 7.
2020
Single Semi- Townhouse Apartment
Detached Detached
38.5 % 1% 39.3 % 21.2 %
2020
2019
2018 Proposed three-storey residential apartment at Nash Road and
2017 Trulls Road in Courtice.
2016
2015 Clarington’s Development Charges By-law, 2015-035, which
2014 came into effect July 1, 2015, provides incentives for mid-rise
2013
residential development in the Revitalization Areas of
2012
Bowmanville, Courtice, Newcastle, and Orono. Incentives are
2011
2010 designed to encourage more compact mid-rise residential
development. Clarington is positioning itself such that it will
0% 20% 40% 60% 80% 100%
attract future residential developments that are of higher
Single Detached Semi-detached Townhouse Apartment density. The Municipality’s objective is to provide opportunities
for residential intensification and a broad range of housing types
Figure 7: New residential unit permits by type, 2010-20. within the built-up areas to meet the changing needs of
residents. 10 In addition, Clarington’s Development Charges By-
The composition of new residential units is consistent with law, supported apartment growth. Development charges by-
recent trends in housing development as Provincial, Regional laws must be updated every five years and Clarington has
enacted an updated development charges bylaw, 2021-010,
10 Municipality of Clarington. (2018). Municipality of Clarington Official Plan – “Chapter 6: Encouraging Housing Diversity”.
10which took effect in 2021. The new development charges By- development occurring within defined built-up areas across the
law will be reviewed in 2022 upon the completion of the ongoing Region. Intensification targets may be difficult to achieve in
work with Secondary Plans to ensure that the capital some municipalities due to servicing issues and the extent of
investments required for growth are included and recoverable the built-up area. However, the Region is generally meeting its
from development charges. targets as local municipalities, such as Clarington, are largely
building within the built boundary. Table 5 provides the number
All housing types experienced an increase in volume, notably
of permits within and outside the built boundary in 2020, while
single detached and townhouses which increased by 397.4 and
Figure 8 displays the location of these permits. Figure 9 shows
279.6 per cent, respectively. The number of new residential
the proportion of permits within to outside the build boundary
permits issued by type since 2010 can be seen in Table 4.
from 2016-20.
Table 4: Residential unit permits issues in Clarington by type,
2010-20.
Year Single Semi- Townhouse Apartments Total
Clarington has surpassed the
Detached Detached minimum intensification
2010 347 114 111 21 593 target of 1,770 residential
2011 527 110 137 89 863 units built within the built
2012 327 88 108 14 537
2013 217 86 121 15 439
boundary by 2021
2014 411 142 89 15 657
2015 490 78 99 264 931 Table 5: Summary of new residential building permits within and
2016 480 2 182 331 995 outside the built boundary of Clarington by area, 2020.
2017 488 22 70 392 972
2018 551 76 154 28 809 Within Outside Total
2019 77 6 103 98 284 Courtice 25 7 32
2020 383 10 391 210 994 Bowmanville 329 460 789
Newcastle 156 12 168
4.3 Built Boundary Rural 0 22 22
The Built Boundary is part of the intensification targets set by Total 510 501 1011
the Province of Ontario. As of 2015, the Region of Durham must
meet a minimum of 40 per cent intensification for all residential
11Figure 8: Map of building permits within and outside of the built boundary, 2020.
12The intensification target for Clarington is 32.0 per cent which 4.4 Servicing Updates
Clarington has consistently been exceeding over the past five In Bowmanville, the extension of the sanitary sewer in
years. 11 In 2019, Clarington surpassed the minimum conjunction with the Region’s intersection improvements at
intensification target of 1,770 residential units built within the Bowmanville Avenue and Highway 2 will provide service to the
built boundary by 2021. updated Brookhill Secondary Plan located north of Stevens
Road to Nash Road and from Bowmanville Avenue to just west
It is expected that the ratio of building permits within and outside of Green Road.
of the built boundary will fluctuate on a year-to-year basis. In Newcastle, the Municipality issued Site Plan Approval early in
However, developments within the built boundary are likely to 2020 and the Region is moving forward with plans to build a
increase as policies in the Official Plan state that priority will be new Water Supply Plant to address future growth needs. A
given to those capital projects that are within the built-up areas. sanitary sewer, and watermain where required, is currently
Furthermore, the percentage within the built boundary is being extended from just north of the 401 to North Newcastle
anticipated to increase over time as a result of higher via North Street and along the west side of Rudell Road to
intensification targets and environmental protection areas service the west end of Newcastle.
combined with fewer options for greenfield development.
In Courtice, the Region continues to extend the sanitary trunk
100%
sewer and watermain north along Trulls Road which will provide
Percentage of New Residential
90% service to the Courtice Secondary Plans area.
25%
Building Permits Issued
80% 46% 53% 50%
70% 60%
60%
50%
40% 75%
30% 54% 47% 50%
20% 40%
10%
0%
2016 2017 2018 2019 2020
Within Built Boundary Outside Built Boundary
Figure 9: Percentage of new residential building permits within South Courtice servicing construction. 12
or outside the built boundary, 2016-20.
11 Municipality of Clarington. (2018). Municipality of Clarington Official Plan – “Chapter 4: Managing our Growth”.
12 Ontario Construction News. (2021). Clarington: Community growth in the face of the pandemic.
134.5 Impacts of COVID-19 on the Housing Market when both the residential and non-residential sectors hit their
lowest values.
4.5.1 National Economy
Prior to COVID-19 the Canadian economy had been performing $7,000,000.00
well as the labour market was healthy, unemployment was low,
Canada Building Permit Value
$6,000,000.00
and the rate of wage growth was increasing. The onset of
COVID-19 had dramatic effects on economic and employment $5,000,000.00
(Thousands)
activity. Public health measures to contain the spread of the
$4,000,000.00
virus shut down significant amounts of economic activity,
causing a sudden drop in income for households and firms. 13 $3,000,000.00
When containment measures were most restrictive it is
$2,000,000.00
predicted economic activity fell by 15% compared to the end of
2019 and approximately 3 million jobs were lost. The effects of $1,000,000.00
the pandemic were felt unevenly, as certain industries were able
$0.00
to adapt quickly to working remote, while some, most notably
2016
2017
2018
2019
2020
the services, were hit hard. 14 The economy began to recover
later in the year and had entered a recuperation phase by Residential Non-Residential
October, however, ongoing and intermittent lockdowns continue
to have negative impacts on the economy. 15 Figure 10: Canadian building permit value, 2016-20. 16
4.5.2 National and Provincial Housing Market Ontario experienced trends similar to national patterns,
The first wave of COVID-19 and the resulting public health however, the initial dip in March and April was not as extreme.
measures had an immediate and drastic impact on the Residential permit value recovered quickly and saw substantial
Canadian building industry. National building permit value growth in the later months of 2020, while non-residential value
experienced a large dip in March and April but by May, recovered but experienced large fluctuations. The construction
residential permit value had recovered. Following the recovery, and real estate industries fared better than others in Ontario, as
residential building permit value saw record growth. Non- they were among the few that grew in 2020. The construction
residential permit value was slower to recover, and by the end industry grew by 0.3 per cent while real estate, rental and
of 2020 was still below pre-COVID-19 levels. The seasonally leasing grew by 1.6 per cent. 17 The seasonally adjusted Ontario
adjusted Canadian building permit value from 2016-20 can be
seen in Figure 10. The red dashed line highlights April 2020,
13 Bank of Canada. (2020). Monetary Policy Report – April 2020.
14 Bank of Canada. (2020). Monetary Policy Report – July 2020.
15 Bank of Canada. (2020). Monetary Policy Report – October 2020.
16 Statistics Canada (2021). Building permits, by type of structure and type of work (x1,000).
17 Building (2021). Ontario construction industry growth hits new record in 2020: Statistics Canada.
14building permit value from 2016-20 can be seen below in Figure COVID-19 trend of movement away from city centres and into
11, again with April 2020, highlighted. suburban areas as discussed earlier. 19
$3,500,000.00 4.5.3 Greater Toronto Area 20
2020 started out strong in the GTA as the lower number of new
Ontario Building Permit Value
$3,000,000.00
listings led to higher competition and home prices. COVID-19
$2,500,000.00 caused an immediate drop in sales in the latter half of March
(Thousands)
and April, however, prices remained relatively stable. Sales
$2,000,000.00 began to slowly rebound in May and had recovered by June. In
$1,500,000.00 the summer months, with fewer people going on vacation, more
people were around in the GTA and active in the housing
$1,000,000.00 market. Sales growth was seen in the single detached and low-
$500,000.00
rise segments while the better supplied condominium market
saw slower growth. With the economy recovering and low-
$0.00 borrowing costs, record sales were seen in the fall as the pent-
2016
2017
2018
2019
2020
up demand from the spring dip was accounted for. In December
2020 sales were up 65 per cent from December 2019 and the
Residential Non-Residential average price had increased by 11 per cent.
Given the housing market’s strong performance during COVID-
Figure 11: Ontario building permit value, 2016-20. 18 19, forecasts for 2021 predict further growth. The real estate
Housing trends were affected by the uneven economic impacts market was a stabilizing economic force during the pandemic
of the pandemic. Higher income households who were able to and is expected to be a major driver of recovery. Total home
adapt to working from home, remained active in the housing sales in the GTA are expected to range from 100,000 to
market. The pandemic and resulting economic conditions limited 110,000 and the overall average selling price is expected to
household spending which led to historic savings levels. These reach over $1,000,000 for the first time. 21
factors combined with low mortgage rates led to well-adjusted 4.5.4 Durham Region
households being able to fund home purchases. This drove The Durham Region continued to see growth in the housing
sales growth in the relatively more expensive single detached sector. The average cost of a new single detached dwelling
unit segment, as homeowners sought larger homes to work increased by 4.6 per cent, from $810,424 in 2019 to $848,088 in
from home more comfortably. This further exacerbated the pre- 2020. The average resale price (all dwelling types) increased by
15 per cent, from $611,342 in 2019 to $706,913 in 2020.
18 Statistics Canada (2021). Building permits, by type of structure and type of work (x1,000).
19 CMHC. (2021). Housing Market Outlook – Spring 2021.
20 Toronto Regional Real Estate Board. (2020). Market Watch – 2020 January to December
21 Toronto Regional Real Estate Board. (2021). Market Year in Review and Outlook 2021.
15Clarington saw the largest per cent increase in average cost of higher demand within Clarington, driving house prices up.
a new single detached dwelling from $735,765 in 2019 to Despite the COVID-19 emergency order in March of 2020,
$902,362 in 2020, an increase of 22.6 per cent. Growth in the Clarington continued to see building permit applications and the
Durham Region has been driven by the shortage of listings strong building activity has continued into 2021.
combined with the trend of home buyers moving away from city
Price growth was relatively equal among the housing types as
centres. The average cost of a new single detached dwelling
can be seen in Figure 13. Townhouses experienced the highest
among the Lakeshore municipalities can be seen below in
price growth rate with 29.2 per cent, while condo-townhouses
Figure 12.
had the lowest with 12.1 per cent. Single detached dwellings
$1,400 have continued to be the most expensive housing type.
Average New Single Detached Cost
$1,200 $800
Average House Prices (Thousands)
$750
$1,000 $700
$650
(Thousands)
$600
$800 $550
$500
$600 $450
$400
$400 $350
$300
$200 $250
$200
2010
2011
2012
2013
2014
2015
2016
2017
2018
2019
2020
2015 2016 2017 2018 2019 2020
Ajax Clarington Oshawa Detached Semi-Detached
Pickering Whitby Townhouse Condo-Town
Condo Apt Other
Figure 12: Average cost of a new single detached dwelling Figure 13: Average house price in Clarington by type, 2010-20.
among the Durham Lakeshore municipalities, 2010-20.
Average house prices vary by location in Clarington. Among the
4.5.5 Clarington urban centres, Bowmanville and Courtice have generally had
Clarington house prices surged in 2020, with the average house the highest house prices and growth rate. Table 6 below
price increasing by 22.6 per cent. The decline in building activity summarizes the average house prices by type and location
in 2019 combined with the COVID-19 pandemic has led to within Clarington from 2016-20.
16Table 6: Clarington average house prices by type and location, 2016-20.
Bowmanville Courtice Newcastle Orono Rural Average
Clarington
2016 Detached $517,000.00 $574,000.00 $550,000.00 $537,000.00 $655,000.00 $566,600.00
Semi-Detached $375,000.00 - - - - $375,000.00
Attached/Row/Town $397,000.00 $395,000.00 - - - $396,000.00
Condo-Townhouse $288,000.00 $325,000.00 - - - $306,500.00
Condo Apartment $268,000.00 - $304,000.00 - - $286,000.00
Other $450,000.00 $461,000.00 - - - $455,500.00
2017 Detached $542,000.00 $626,000.00 $494,000.00 $464,000.00 $704,000.00 $566,000.00
Semi-Detached $398,000.00 - - - - $398,000.00
Attached/Row/Town $425,000.00 $435,000.00 - - - $430,000.00
Condo-Townhouse $368,000.00 $343,000.00 - - - $355,500.00
Condo Apartment $319,000.00 - - - - $319,000.00
Other $473,000.00 $476,000.00 $435,000.00 - - $461,333.33
2018 Detached $585,000.00 $614,000.00 $515,000.00 $510,000.00 $805,000.00 $605,800.00
Semi-Detached $397,000.00 $470,000.00 - - - $433,500.00
Attached/Row/Town $439,000.00 $429,000.00 - - - $434,000.00
Condo-Townhouse - $412,000.00 - - - $412,000.00
Condo Apartment $324,000.00 - $323,000.00 - - $323,500.00
Other $489,000.00 $482,000.00 $530,000.00 - - $500,333.33
2019 Detached $601,000.00 $625,000.00 $544,000.00 $491,000.00 $819,000.00 $616,000.00
Semi-Detached $454,000.00 - - - - $454,000.00
Attached/Row/Town $475,000.00 $475,000.00 - - - $475,000.00
Condo-Townhouse $416,000.00 $421,000.00 - - - $418,500.00
Condo Apartment $351,000.00 - - - - $351,000.00
Other $519,000.00 $507,000.00 - - - $513,000.00
2020 Detached $765,000.00 $785,000.00 $712,000.00 $615,000.00 $906,000.00 $756,600.00
Semi-Detached $571,000.00 - - - - $571,000.00
Attached/Row/Town $602,000.00 $625,000.00 - - - $613,500.00
Condo-Townhouse $523,000.00 $416,000.00 - - - $469,500.00
Condo Apartment $399,000.00 - $453,000.00 - - $426,000.00
Other $644,000.00 $643,000.00 $687,000.00 - - $658,000.00
174.6 Short-Term Population Forecast 22 Table 8: Clarington and Durham household estimates and
Clarington’s 2020 population was estimated to be 102,900, forecasts, 2016-24.
which accounts for 14.6 per cent of the population of Durham.
Clarington % Change Durham % Change
This amounted to 35,750 households which translates to a ratio
2016 33225 1.98% 229005 1.11%
of approximately 2.9 persons per household. Forecasts project
2017 34020 2.39% 232495 1.52%
Clarington will maintain its proportion within Durham Region,
2018 34710 2.03% 236040 1.52%
however, the previous Clarington rates of change are outpacing
2019 35435 2.09% 239100 1.30%
Durham’s. Clarington and Durham population and household
figures can be seen in Table 7 and Table 8, respectively. 2020 35750 0.89% 240780 0.70%
Forecasts
Table 7: Clarington and Durham population estimates and 2021 37380 4.56% 250840 4.18%
forecasts, 2016-24. 2022 38470 2.92% 258290 2.97%
2023 39570 2.86% 265710 2.87%
Clarington % Change Durham % Change
2024 40670 2.78% 273140 2.80%
2016 96490 1.72% 673040 0.94%
2017 98550 2.13% 682250 1.37%
2018 100290 1.77% 691580 1.37%
2019 102110 1.81% 699460 1.14%
2020 102900 0.77% 704140 0.67%
Forecasts
2021 107300 4.28% 732800 4.07%
2022 110150 2.66% 753500 2.82%
2023 113000 2.59% 774000 2.72%
2024 115850 2.52% 794600 2.66%
As seen in both tables, Clarington’s population and household
numbers are expected to grow at a stable rate in the coming
years. Both growth rates have seen declines since 2017 and did
not reach their projected numbers in 2020, however, these
projections did anticipate an eventual decrease in growth rate. Nearly completed townhouses on Port Darlington Road,
Bowmanville.
22 Regional Municipality of Durham. (2020). Monitoring of Growth Trends – Commissioner’s Report #2020-INFO-98.
184.7 Planning for Intensification The policies in Clarington’s Official Plan require a minimum
The 2020 Provincial Policy Statement (PPS) requires planning intensification target of 32 per cent for all residential
authorities to identify appropriate locations for intensification development in the built-up area by 2021, and 40 per cent
opportunities, as well as establish minimum intensification thereafter. The Municipality is required to plan on this basis and
targets based on local conditions. According to the PPS, is required to update these policies in keeping with the 2020
“intensification” is defined as the development of a property, site Growth Plan. Figure 14 shows the Municipality of Clarington
or area at a higher density than currently exists, through: within the context of the Greater Golden Horseshoe, while
Figure 15 shows a conceptual example of rural/agricultural,
a) Redevelopment, including the reuse of brownfield sites;
designated greenfield, and built boundary areas.
b) The development of vacant and/or underutilized lots
within previously developed areas;
c) Infill development; and
d) The expansion or conversion of existing buildings.
A Place to Grow: Growth Plan for the greater Golden
Horseshoe, was updated in 2019 and came into effect on May
16, 2019. Amendment 1 was approved in 2020 and came into
effect on August 28. A Place to Grow, provides provincial policy
that prioritizes intensification through density targets for built-up
and greenfield areas. The density targets ensure that land is
utilized efficiently to accommodate future growth while
protecting natural areas and providing for complete
communities. This Plan projects 1.3 million residents and
460,000 jobs in the Region of Durham by 2051.
Based on the Growth Plan and current targets in the Region’s
Official Plan, upper and single-tier municipalities, such as the Directing new residential development to existing urbanized
Region of Durham, are to direct a minimum of 40 per cent of all lands, the 2020 Growth Plan requires a greenfield area density
new residential units to the built-up area. The Region of Durham target of 50 residents and jobs per hectare – the minimum
set Clarington’s minimum intensification allocation to 32 per density needed to support frequent transit service. These
cent, which is 13 per cent of the Regional total. These targets, intensification objectives focus on complete communities that
however, are based upon the 2006 Growth Plan. support active transportation and encourage the integration and
sustained viability of transit services.
19Figure 14: Map Clarington within the Greater Golden Horseshoe. 23
23 Neptis Foundation. (2014). An update on the total land supply: Even more land available for homes and jobs in the Greater Golden Horseshoe.
202020 Growth Plan:
• Minimum of 50% of all
2020 Growth Plan: residential
• Greenfield density development within
of 50 residents/jobs the delineated built-up
per hectare area
• 200 residents/jobs per
hectare in urban
growth centres
Figure 15: Conceptual illustration of the built-up, greenfield and rural area boundaries and intensification targets. 24
24 Neptis Foundation. (2014). Distinguishing the Built Boundary and Settlement Area Boundary.
21while the industrial sector was led by the EastPenn Warehouse
5.0 Non-Residential Growth and Office facility, valued at $21.9 million. The government and
5.1 Total Non-Residential Building Permit Value industrial sector accounted for the majority of the non-residential
in Clarington building value with a combined 82.7 per cent. The proportion of
The total non-residential building permit value in 2020 was non-residential building permit value by type since 2010 can be
$93.7 million, an increase of 134.8 per cent from $39.9 million in seen in Figure 17.
2019. The industrial and government sectors saw significant
2020
increases, while commercial, agricultural and institutional
Industrial Commercial Government Institutional Agricultural
sectors saw modest declines reflecting normal fluctuations. The
34.4% 12.6% 48.3% 2.9% 1.7%
total non-residential building value, both total and broken down
by type, from 2010-20 can be seen in Figure 16.
2020
2019
Building Permit Value (Millions)
$120 2018
2017
$100 2016
2015
$80 2014
2013
$60 2012
2011
$40 2010
0% 20% 40% 60% 80% 100%
$20
$0 Industrial Commercial Government Institutional Agricultural
Figure 17: Non-residential building permit value proportion by
Industrial Government
type, 2010-20.
Commercial Institutional
Agricultural Total Non-Residential Non-residential building permit values fluctuate greatly year-to-
year. Additionally, the total permit values for all non-residential
Figure 16: Total and by type non-residential building permit projects vary due to major projects requiring permits to be paid
value, 2010-20. at the beginning of the construction period. Agricultural,
government, and institutional building permit values remain fairly
The substantial increase in the government sector was driven stable due to the lower scale and cost of structures when
by the Newcastle Water Supply Plant, valued at $40 million, compared to other building projects as exemplified in Figure 13.
22You can also read